In this Power BI tutorial, We will discuss how to get a percentage of total by month in Power BI. Additionally, we will see how to display the percent of grand total by month in Power BI. We will also cover the below headings:
- Power BI percentage of total per month
- Power BI percentage of total by year
Power BI percentage of total by month
Let us see how we can display the percentage of the total by month in Power Bi.
In this example, we will use the financials data table, to calculate the percentage of total sales value in Power BI.
- Log in to the Power Bi desktop and use the get data option to load data.
- Select a new measure option under the modeling tab and use the below formula to find the total sales value by month.
Sales (%) =
VAR CurrentValue =
    DISTINCTCOUNT (financials[Product category] )
VAR AllMonth =
    CALCULATE (
        DISTINCTCOUNT (financials[Product category] ),
        ALL ( 'financials' ),
        VALUES ( financials[Month Name])
    )
RETURN
    DIVIDE ( CurrentValue, AllMonth )
Where,
- Sales (%) = New Measure name
- Current Value, AllMonth = Variable Names
- financials = Table Name
- Product category, Month Name = Column Names
- Select the matrix visual from the visualization and drag-drop the Month field and Product Category in the row section.
- In the Column section, drag and drop the Product category field as below, In the value section drag and drop the created measure value to display the sales percent.
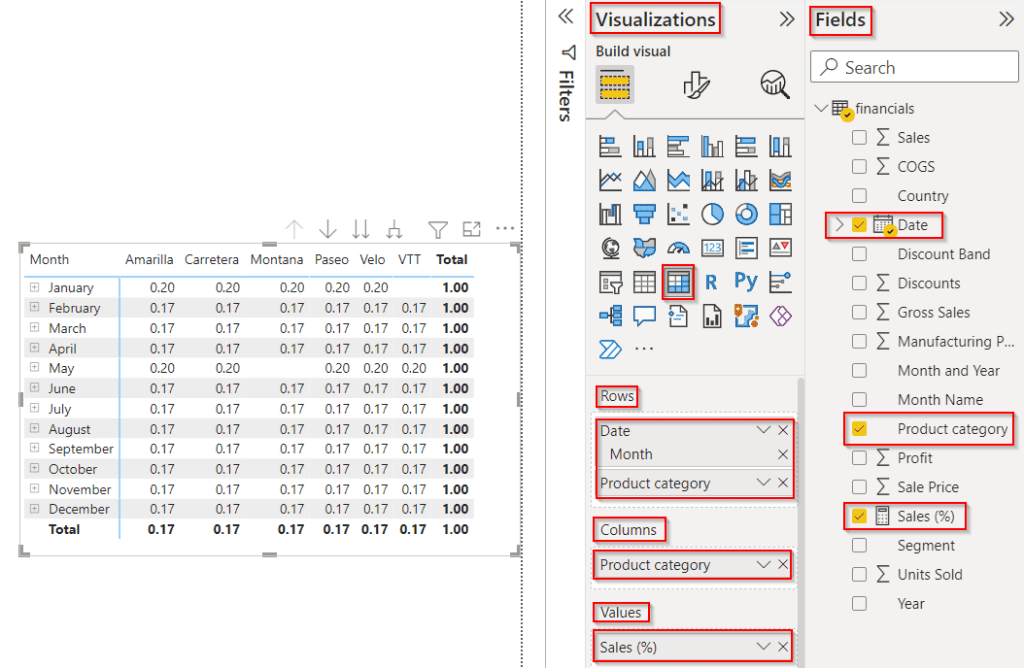
- To show Percentages change the format to a percentage by selecting Measure tools -> Percentage as highlighted below:
- In the below screenshot, you can see that the matrix visual displays the sales percentage in Power BI.
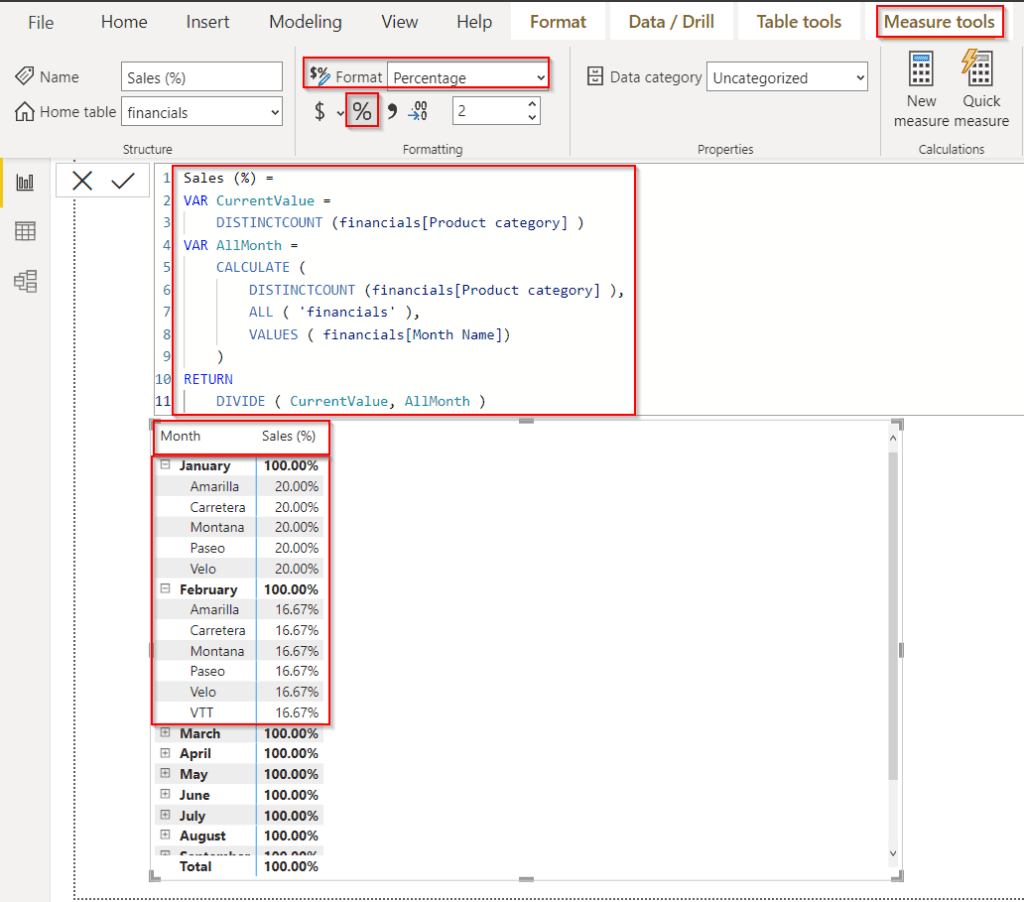
This is how to display the percentage of the total by month in Power Bi.
Read Power BI Percent of Total
Power BI percent of grand total by month
Here we will see how to display the percent of grand total by month in Power Bi,
In this example, we can see how to calculate the percentage of total profit value in Power BI.
- Load data into the Power Bi desktop, Choose a new measure option under the modeling tab, and use the below formula to find the percent total profit value by month.
Percentage of Grand Total =
DIVIDE (
    SUM ( financials[Profit] ),
    CALCULATE ( SUM ( financials[Profit] ), ALL ( financials[Country] ) )
)
Where,
- Percentage of Grand Total = Measure Name
- financials = Table Name
- Profit ,Country = Column Names
- Select Table visual from visualizations and drag-drop the Country and Profit fields from the field pane, also add the created measure into the column section.
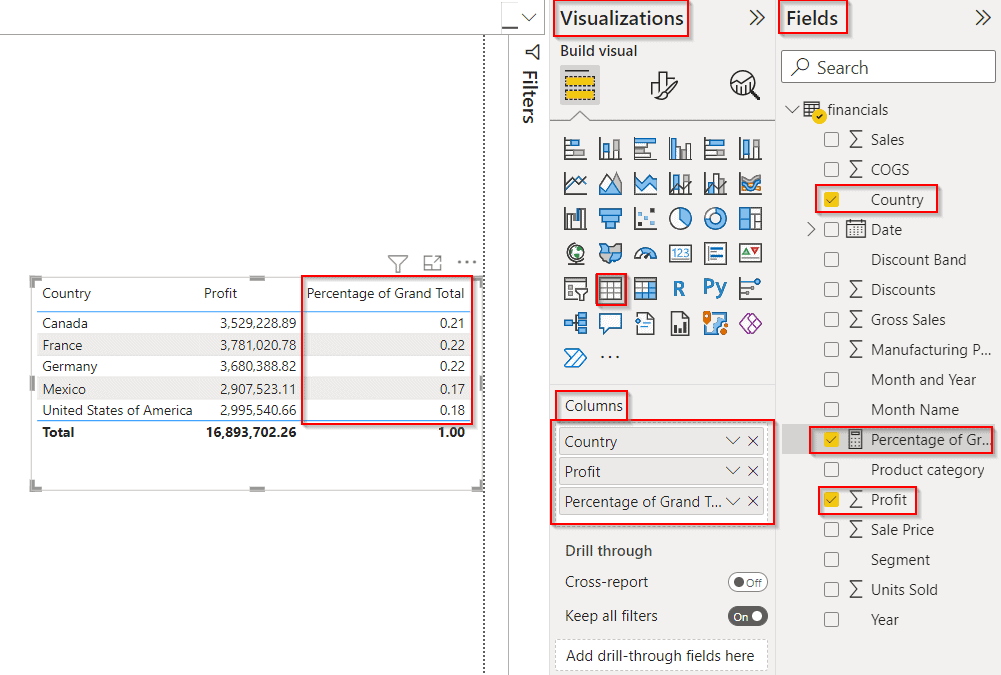
- To show Percentages change the format to a percentage by selecting Measure tools -> Percentage as highlighted below:
- In the below screenshot, you can see that the table visually displays the profit percentage in Power BI.
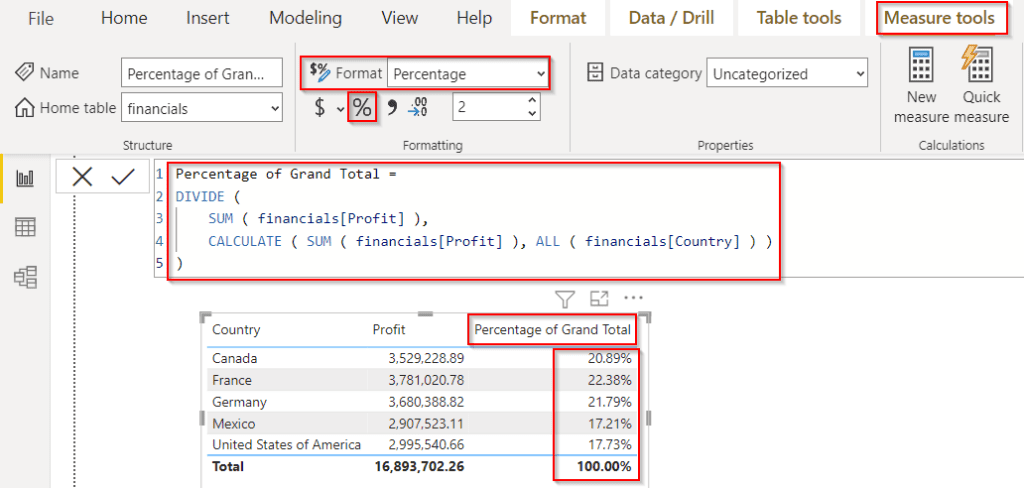
This is how to display the percent of grand total by month in Power Bi.
Power BI percentage of total per month
Let us see how we can display the percentage of the total per month in the Power BI report,
In this example, we will see the sales percentage of the total value per month in Power Bi.
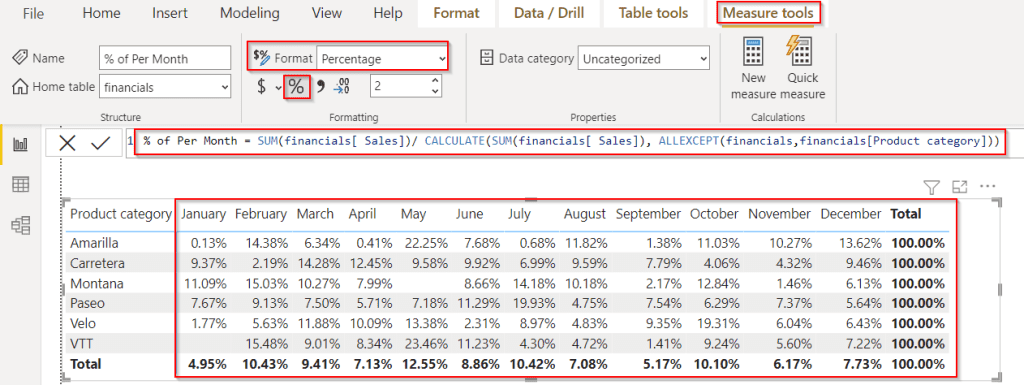
Open Power Bi desktop and load data, Select the new measure option and use the below formula to find the percentage of total sales value per month.
% of Per Month = SUM(financials[ Sales])/ CALCULATE(SUM(financials[ Sales]), ALLEXCEPT(financials,financials[Product category]))Where,
- % of Per Month = Measure Name
- financials = Table Name
- Sales, Product category = Column Names
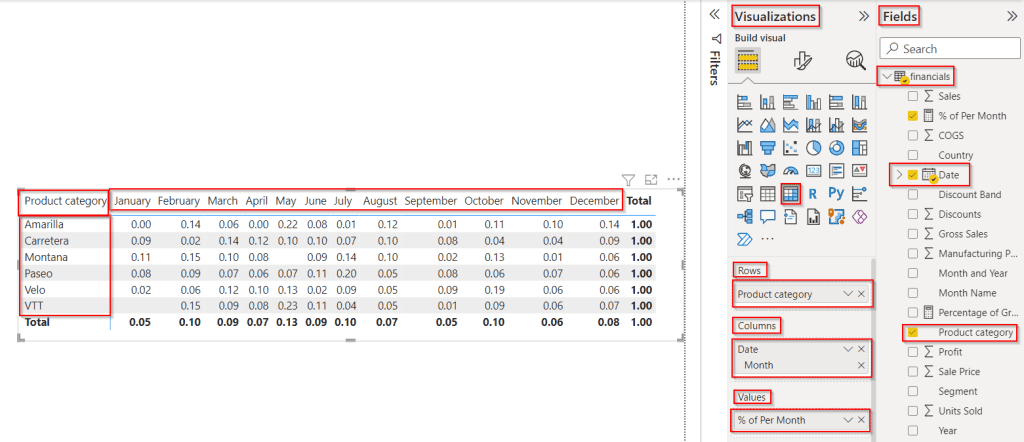
- Select Matrix visual from visualizations and drag-drop the product category field in the row section, and the date field month value in the column section.
- In the value section, drag-drop the created % of Per Month measure value as highlighted below:
- Select the measure and choose Measure tools -> Percentage as highlighted below to change the measure format to percentage.
- The below screenshot displays the matrix visual of the percentage of the total sales per month in the Power BI report.
This is how to display the percentage of the total per month in the Power BI report.
Read Power BI Percentage of Total by Category
Power BI percentage of total by year
Let us see how we can display the percentage of total by year in the Power Bi report,
In this example, we will calculate the profit percentage value based on the product in Power Bi.
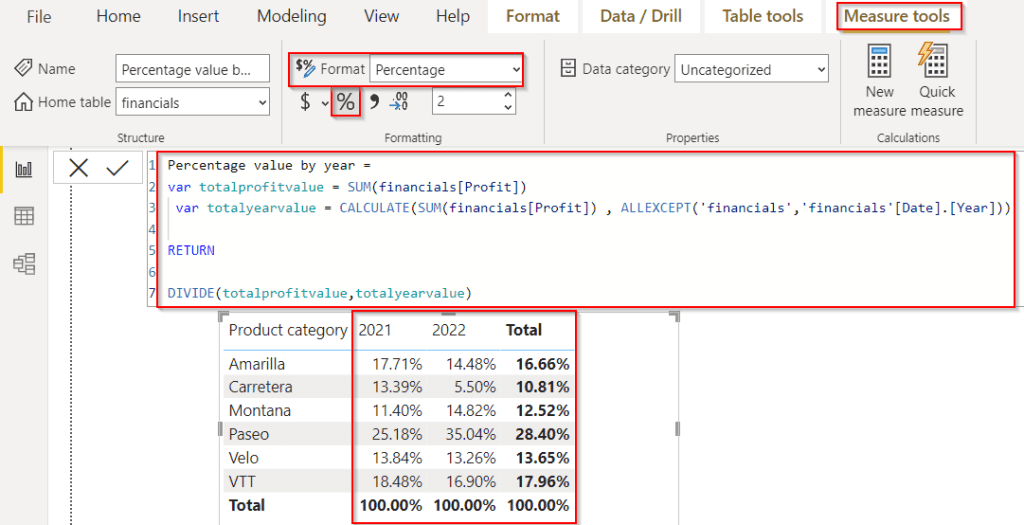
Load data to the Power Bi desktop, click on the new measure under the modeling tab, and apply the below formula to find the profit value by year based on the product.
Percentage value by year =
var totalprofitvalue = SUM(financials[Profit])
 var totalyearvalue = CALCULATE(SUM(financials[Profit]) , ALLEXCEPT('financials','financials'[Date].[Year]))

RETURN

DIVIDE(totalprofitvalue,totalyearvalue)
Where,
- Percentage value by year = Measure Name
- total profit value, total year value = Variable Names
- financials = Table Name
- Date, Profit = Column Names
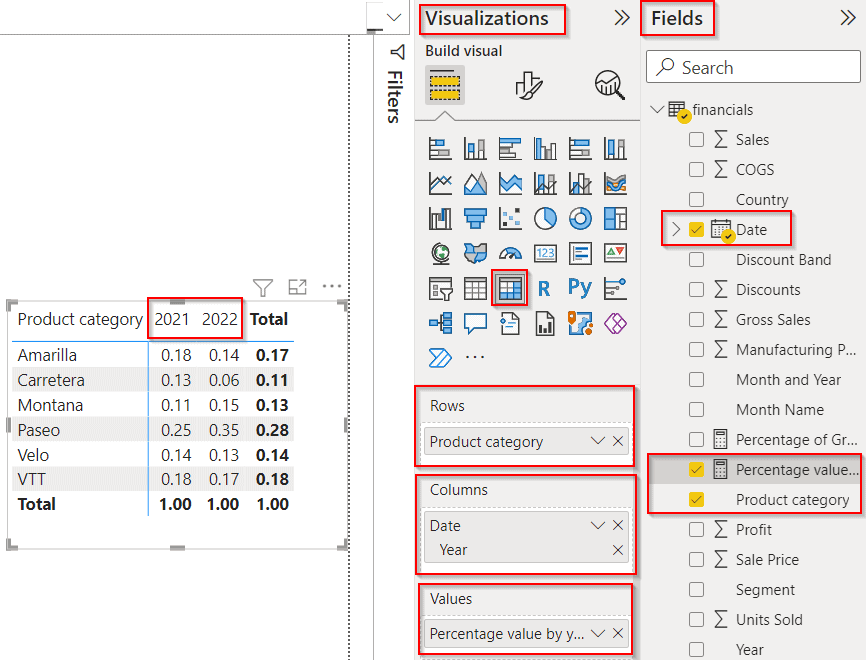
- Choose Matrix visual from visualizations and drag-drop the product category field in the row section, and the date field year value in the column section.
- In the value section, drag-drop the created Percentage value by year as highlighted below:
- To change the measure format to percentage select the measure, Measure tools -> Percentage as highlighted below:
- The below screenshot displays the matrix visual of the percentage of the total profit value by year in the Power BI report.
This is how to display the percentage of total by year in the Power Bi report.
In this Power BI tutorial, We have discussed how to get a percentage of the total by month in Power BI. Additionally, we also saw how to display the percent of grand total by month in Power BI. We also covered the below headings:
- Power BI percentage of total per month
- Power BI percentage of total by year
You may also like the following Power BI tutorials:
- How to Concatenate Text and Number in Power BI
- Power BI Zip Code Starting With 0
- How to Remove Leading Zeros in Power BI
- Power BI Switch Multiple Conditions
I am Bijay a Microsoft MVP (10 times – My MVP Profile) in SharePoint and have more than 17 years of expertise in SharePoint Online Office 365, SharePoint subscription edition, and SharePoint 2019/2016/2013. Currently working in my own venture TSInfo Technologies a SharePoint development, consulting, and training company. I also run the popular SharePoint website EnjoySharePoint.com