When working with the Power Apps Data table, you may need to design the table as per the requirement. Unfortunately, the data table has no property to change the alternative row color.
In this case, instead of using a Data table, you can use a Blank vertical gallery control where you can insert some labels inside the gallery to look like a data table.
This article will show you how to set an alternative row color in the Power Apps data table with simple examples.
Alternate Row Color in Power Apps Data Table
Let’s take a simple scenario.
I have a SharePoint Online list [Vacation Budget], and inside this list, I have added some records based on the different columns.
Input:
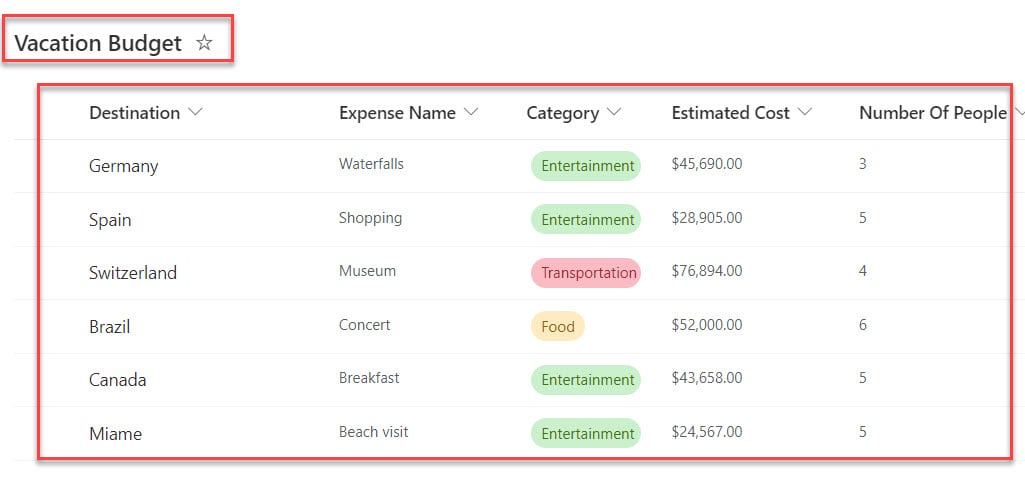
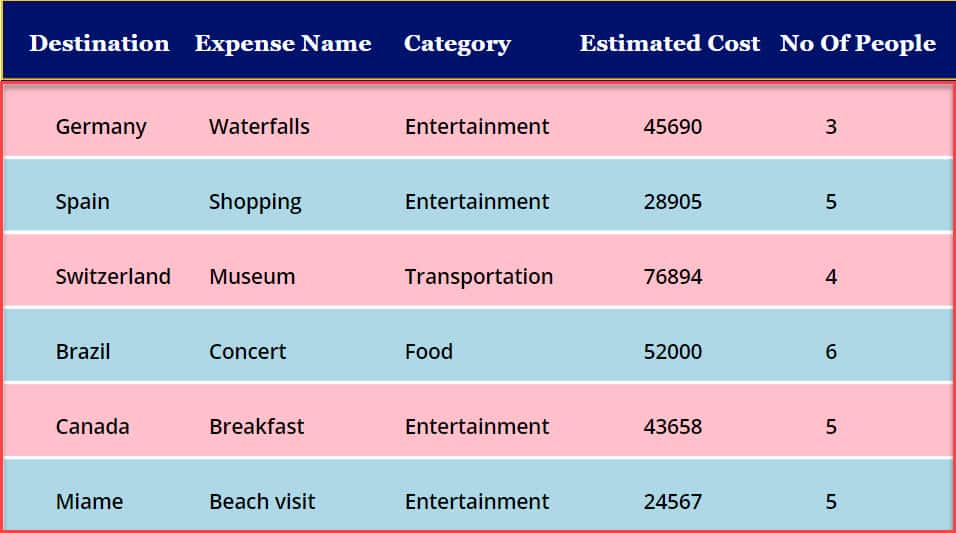
Now, I would like to add these records to the Power Apps data table and set the alternative row color using with TemplateFill property. Have a look at the below screenshot for the output.
Output:
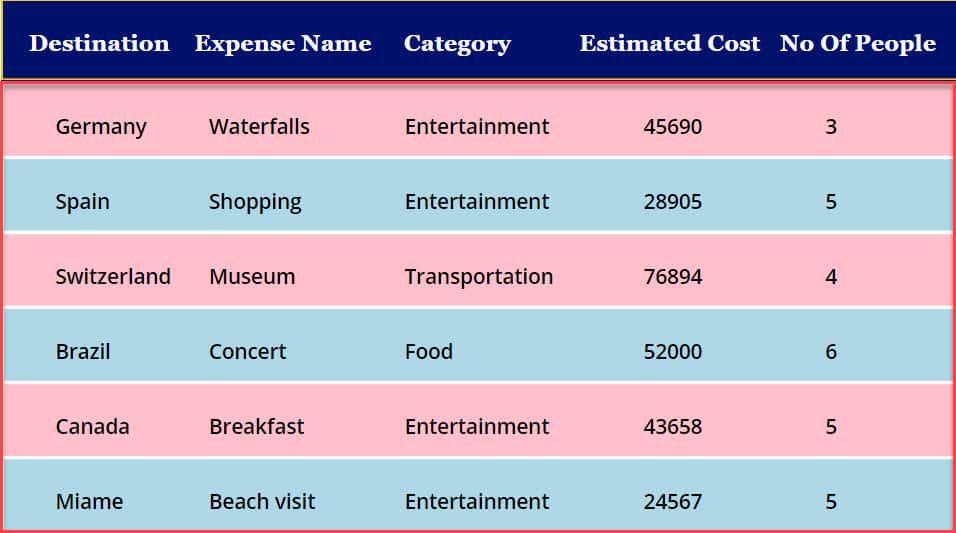
To achieve it, follow the below-mentioned steps. Such as:
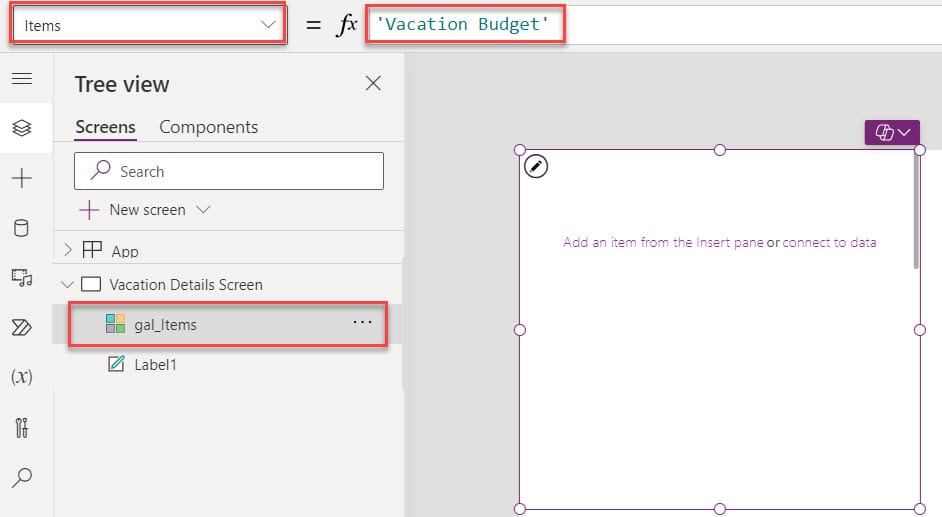
1. Open your Power Apps app -> On the Power Apps Screen -> Insert a Blank vertical gallery control and set its Items as:
Items = 'Vacation Budget'Where,
- ‘Vacation Budget’ = SharePoint Online List
2. Next, select the Edit icon inside the gallery, insert respective Text labels, and set their Text properties as shown below.
Text = ThisItem.Title

Text = ThisItem.'Expense Name'

Text = ThisItem.Category.Value

Text = ThisItem.'Estimated Cost'

Text = ThisItem.'Number Of People'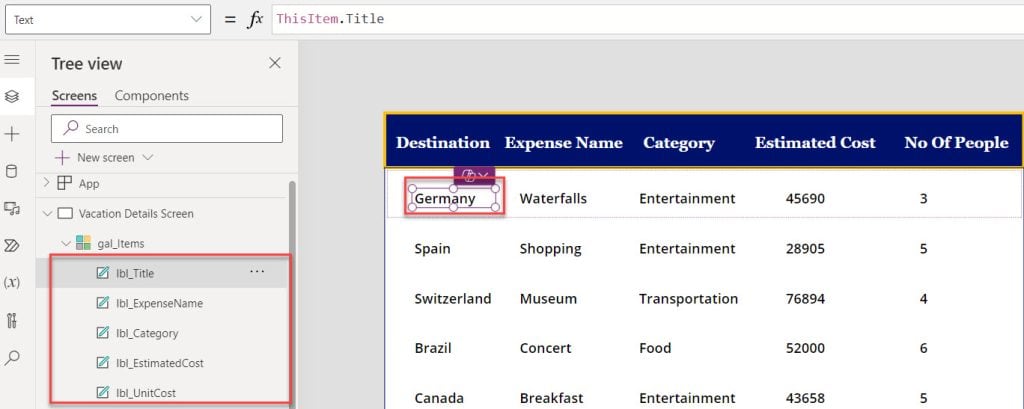
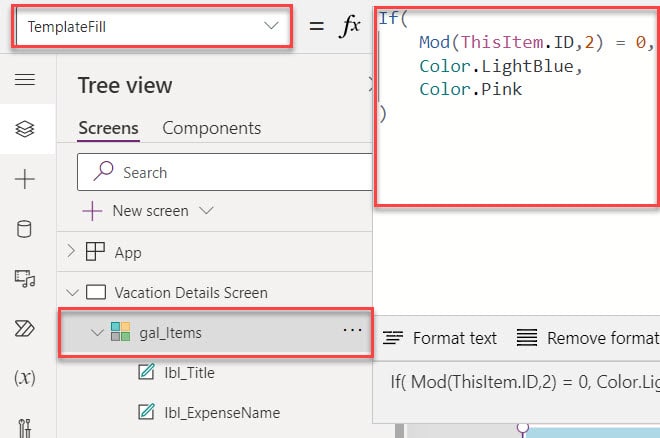
3. Now, select the gallery control and set its TemplateFill property to the code below.
TemplateFill = If(
    Mod(ThisItem.ID,2) = 0,
    Color.LightBlue,
    Color.Pink
)
Where,
- If() = This Power Apps If() function is used to find a set of records that match one or more criteria
- Mod() = The Mod function returns the remainder after a number is divided by a divisor
- ThisItem.ID = SharePoint list ID column
Note: While using the SharePoint list ID column for setting a Power Apps data table alternative row, sometimes it might be give wrong results, i.e., [If the SharePoint list items are removed or added, the data table will mismatch the row colors].
Refer to the below image:
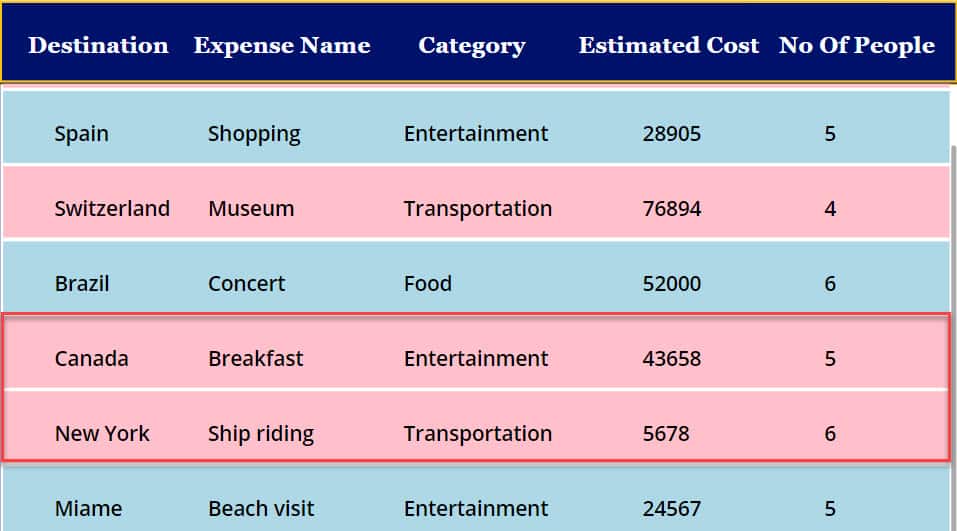
To overcome this issue, there is another way, unlike using the ID column, to set the alternative row color in the Power Apps data table. To do so, follow the below steps.
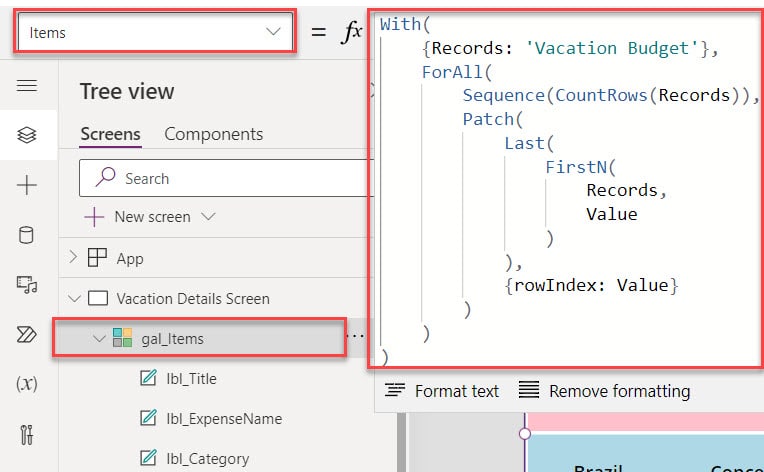
4. Select the Gallery control and change the Items property with the following code.
Items = With(
    {Records: 'Vacation Budget'},
    ForAll(
        Sequence(CountRows(Records)),
        Patch(
            Last(
                FirstN(
                    Records,
                    Value
                )
            ),
            {rowIndex: Value}
        )
    )
)
Where,
- rowIndex = Provide a name to create a sequential row number for the data source
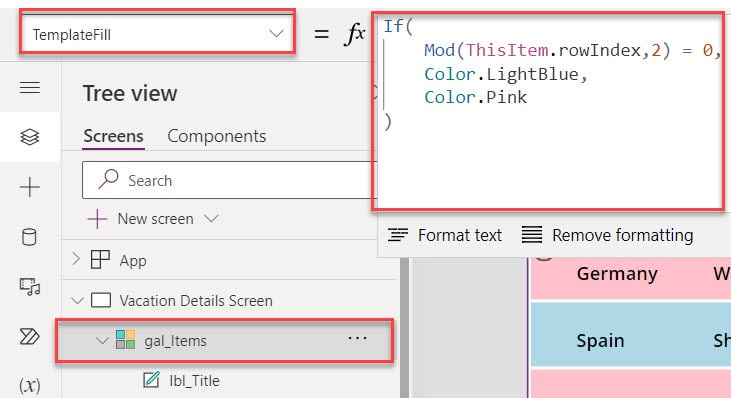
5. Next, set the gallery’s TemplateFill property using with below code.
TemplateFill = If(
    Mod(ThisItem.rowIndex,2) = 0,
    Color.LightBlue,
    Color.Pink
)
6. Once your app is ready, Save, Publish, and Preview the app. The Power Apps data table displays all the rows with alternative colors like the one below.
I hope you find this Power Apps tutorial helpful. Here, we learned how to set the Power Apps data table alternative row color with a simple scenario.
Also, you may like some more Power Apps articles:
- Power BI Table Conditional Formatting
- Power Apps Data Table vs Gallery
- Sort Data Table in Power Apps
I am Bijay a Microsoft MVP (10 times – My MVP Profile) in SharePoint and have more than 17 years of expertise in SharePoint Online Office 365, SharePoint subscription edition, and SharePoint 2019/2016/2013. Currently working in my own venture TSInfo Technologies a SharePoint development, consulting, and training company. I also run the popular SharePoint website EnjoySharePoint.com