Do you know how to apply conditional formatting in the Power BI table visual? Using the Cell elements format option, you can effortlessly apply conditional formatting within the Power BI table visual.
Recently, I worked on a Power BI report where I found with the help of the Power BI table conditional formatting. Based on value, we can change the background color, font color, data bars, icons, and web URLs.
In this Power BI tutorial, we learned what the Power BI table conditional formatting is and how to apply conditional formatting in the Power BI table.
Power BI Table Conditional Formatting
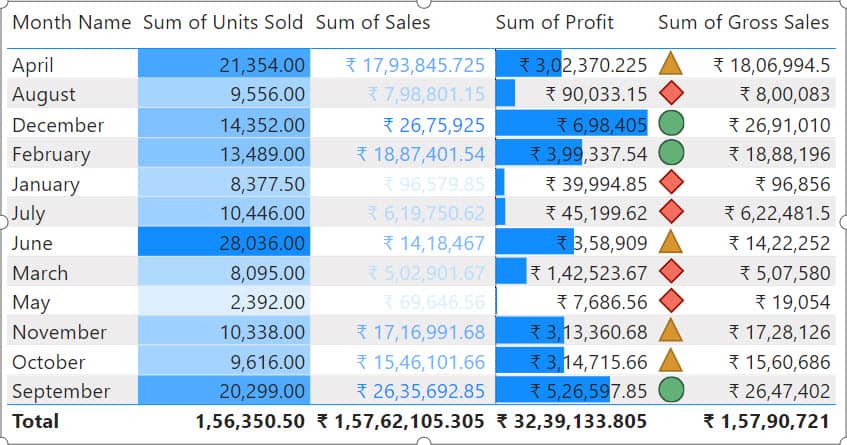
In Power BI, table conditional formatting allows us to change the appearance of your data based on certain conditions. With the help of conditional formatting in Power BI Table Visual, we can highlight data in text or numeric fields by applying color, icons, data bars, and web URLs.
Check the screenshot below that shows the conditional formatting of the Power BI table visual:
How to Apply Conditional Formatting in a Power BI Table
Here, I will explain how to apply conditional formatting in the Power BI table visual.
Here, I have a SharePoint list (Finance Sample) that contains below columns with various data types:
| Columns | Data Types |
|---|---|
| Product | Single line of text |
| Month Name | Single line of text |
| Country | Single line of text |
| Sale Price | Currency |
| Units Sold | Number |
| Sales | Currency |
| Profit | Currency |
| Gross Sales | Currency |
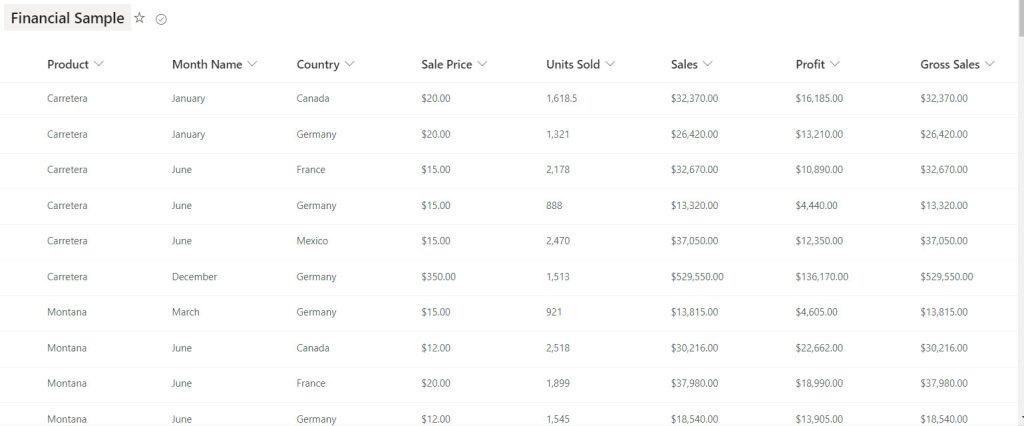
Follow the below steps to apply conditional formatting in the Power BI table visual:
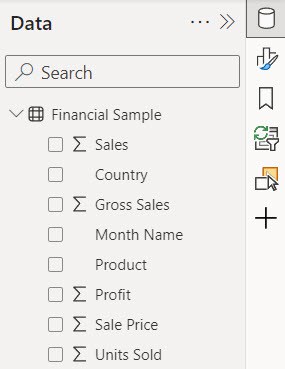
1. Open Power BI Desktop and load the SharePoint list. Then, we can see the data set in the Data Panel.
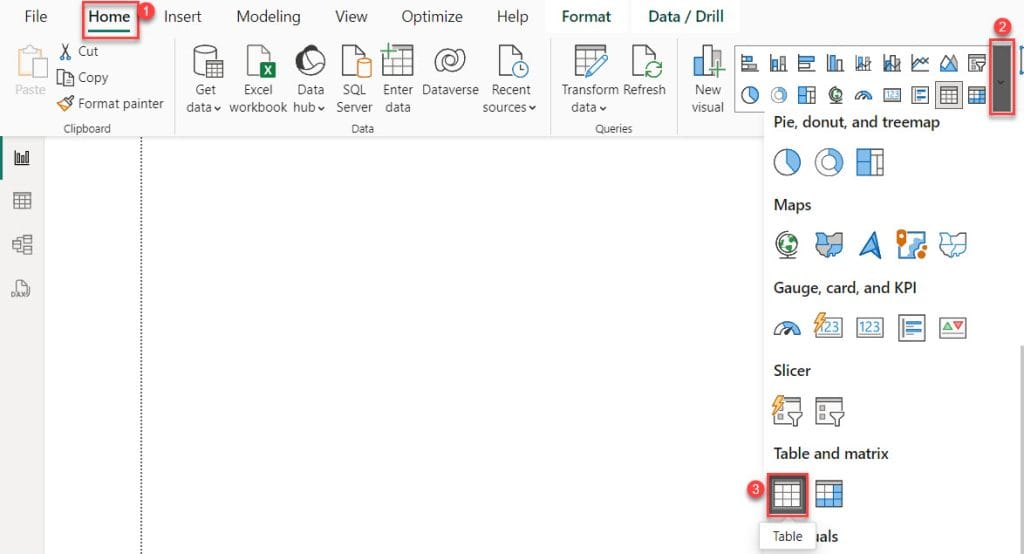
2. Under the Home tab, expand Visual gallery(black box) -> Click the Table visual.
3. Then, use the +Add data option to add the Month Name, Units Sold, Sales, Profit, and Gross Sales into the Columns field.
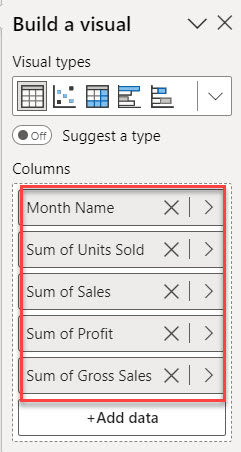
4. Now, our Power BI table visual has been created.
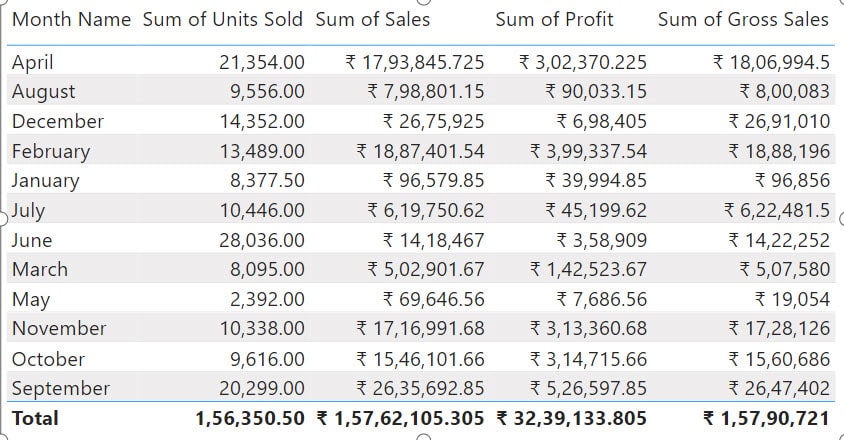
Now, Using the above Power BI table, let’s apply conditional formatting. with conditional formatting:
- Power BI table visual conditional formatting using the background color
- Power BI table visual conditional formatting using font color
- Power BI table visual conditional formatting using data bar
- Power BI table visual conditional formatting using icons
- Power BI table visual conditional formatting using web URL
Power BI Table Visual Conditional Formatting using the Background Color
I will tell you how to format cells with color based on a value in the Power BI table visual.
Now, I hope you have created a table visual. Follow the below steps:
1. Select the Matrix visual -> go to the Format pane -> click Visual -> expand the Cell elements.
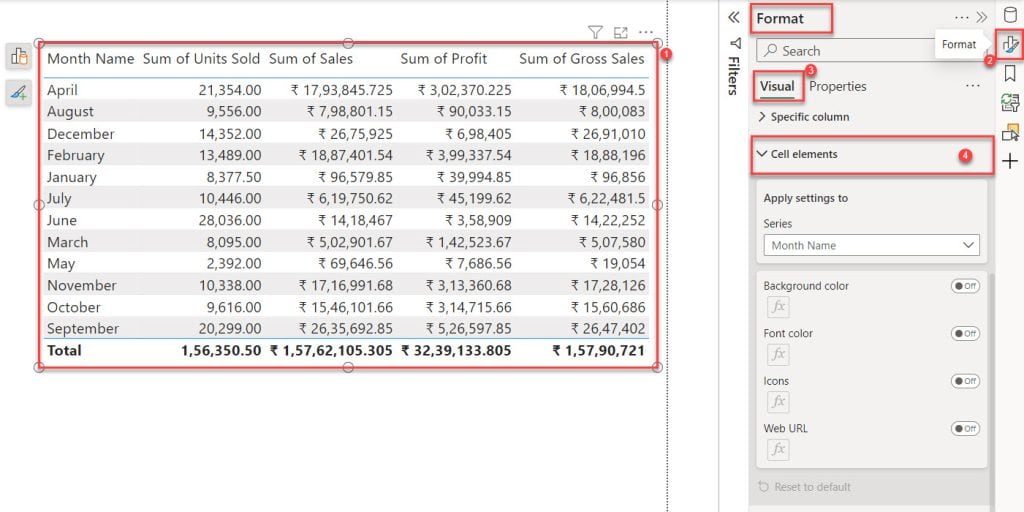
2. Next, expand the Series and select the column to which you want to apply conditional formatting (in this case, Month Name). Depending on the value, conditional formatting offers options when selecting a text value column: it shows Background color, Font color, Icons, and web URL. Check the screenshot below.
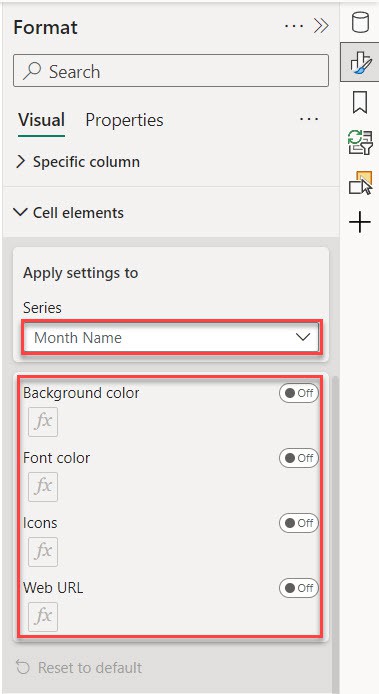
As the month name is textual data, it shows four options. here, my requirement is to change the background color.
3. Next, enable the Background color. Then, you see the one Background color window open.
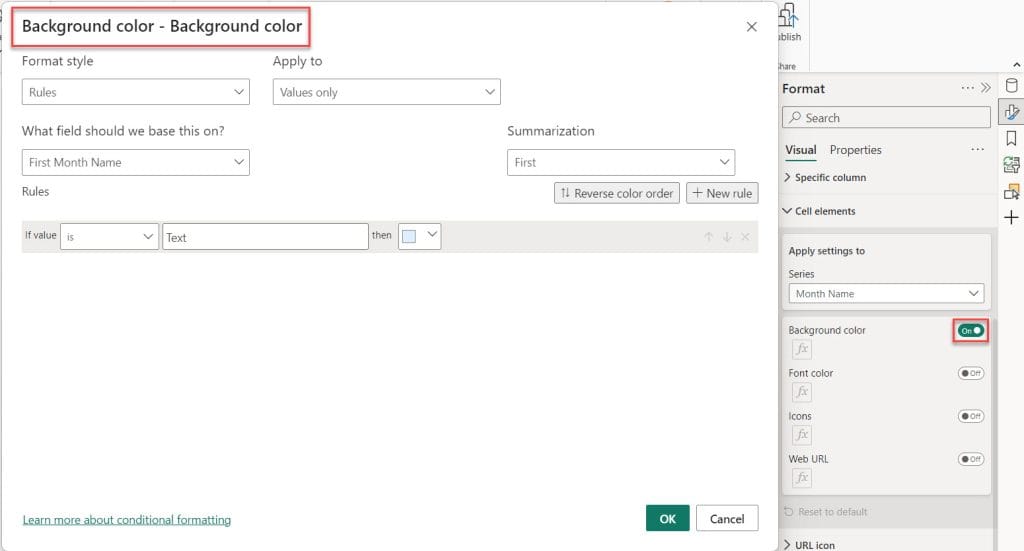
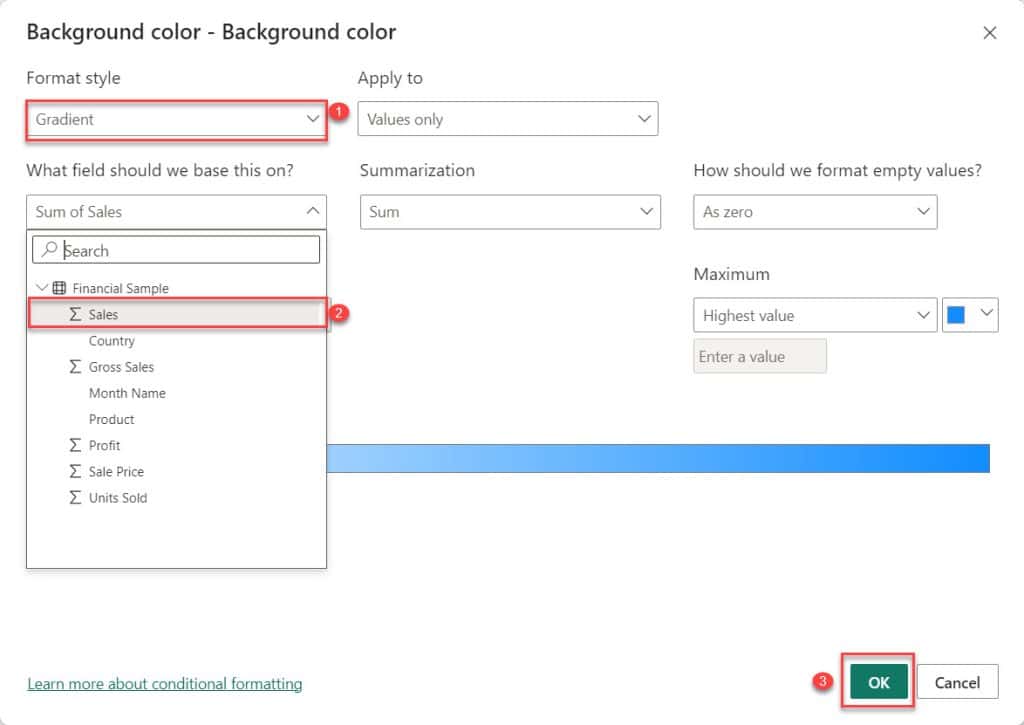
4. In this window, select Format style as Gradient. it means that the lowest value is set to one color and the highest to another. Then select What field should we base this on? as Sales. After that, click OK.
5. Next, conditional formatting applies to the Month Name column based on sales.
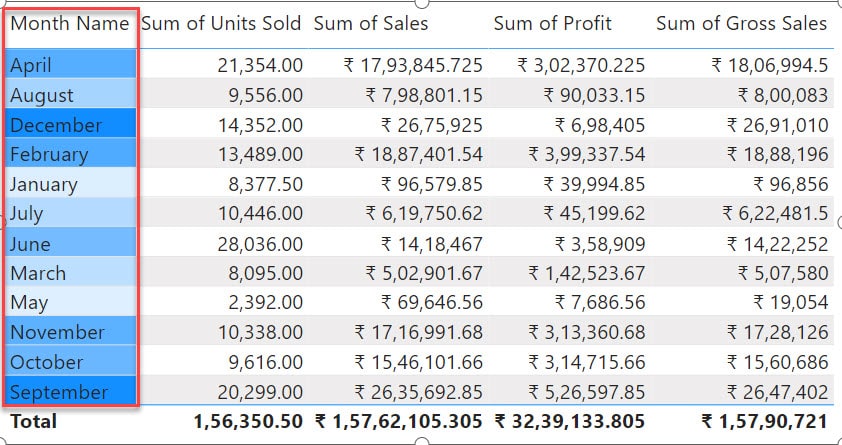
This way, you can apply Power BI table visual conditional formatting using background color.
Power BI Table Visual Conditional Formatting using Font Color
I will tell you how to apply conditional formatting using font color based on the Power BI table visual column value.
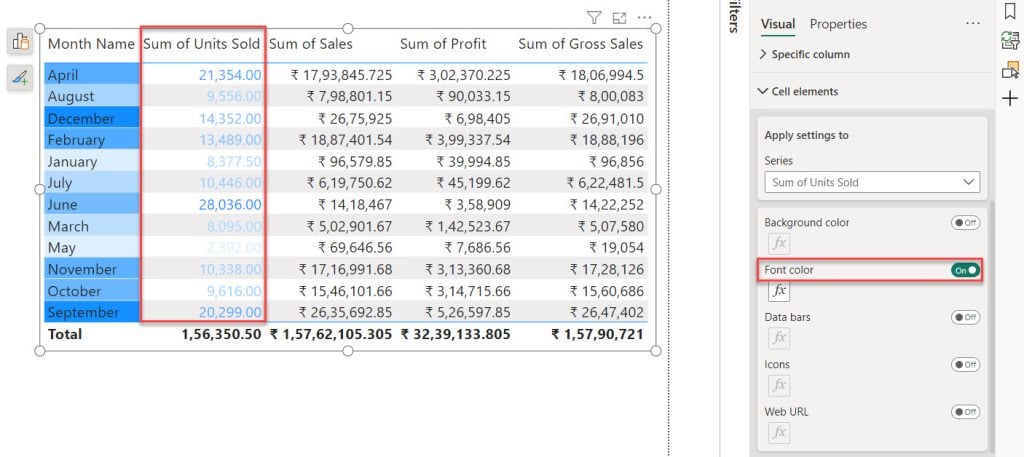
1. Select the Matrix visual -> go to the Format pane -> click Visual -> expand the Cell elements -> select Sum of Unit sold -> enable the Font color.
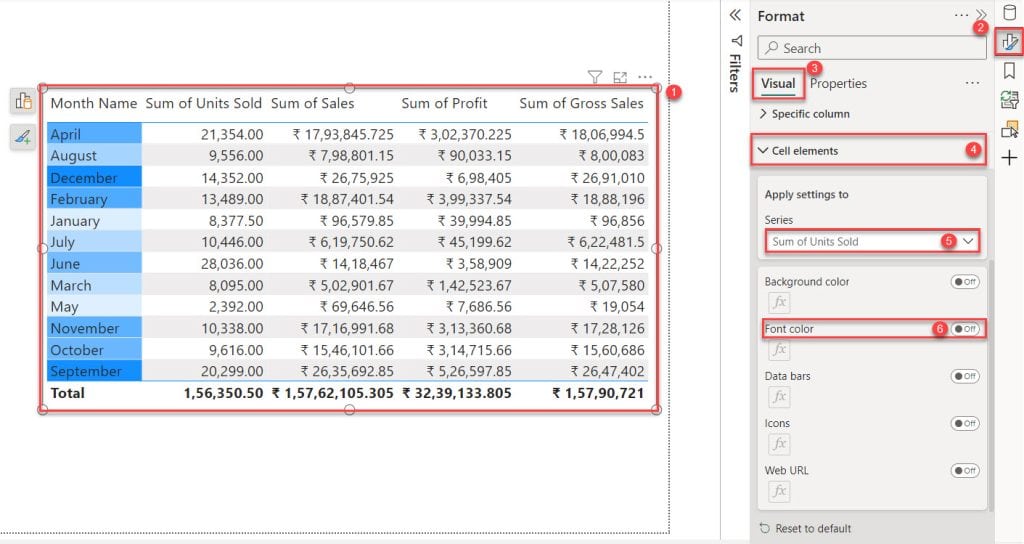
2. After enabling Font color, you see the Units Sold column value font color automatically formatted based on value.
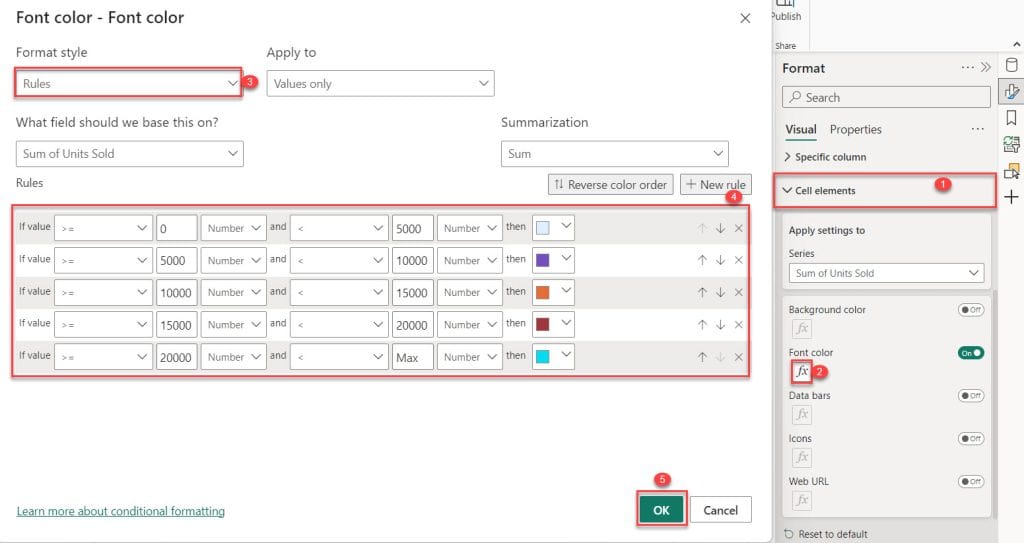
3. To change font color, expand the Cell elements -> under the Font color, click fx. Then, the Font color window opens here. Select Format style as Rules, add some rules using +New rule then click OK.
4. The column value font color changes according to the value.
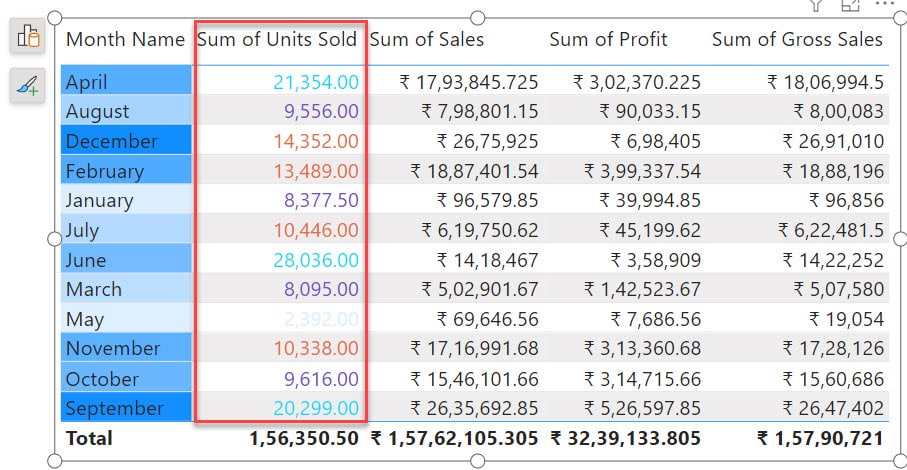
You can change the font color in the Power BI table visual using the above steps.
Power BI Table Visual Conditional Formatting using Data Bars
Next, in the Power BI table visual, I will tell you how to format cells with bars based on their column values.
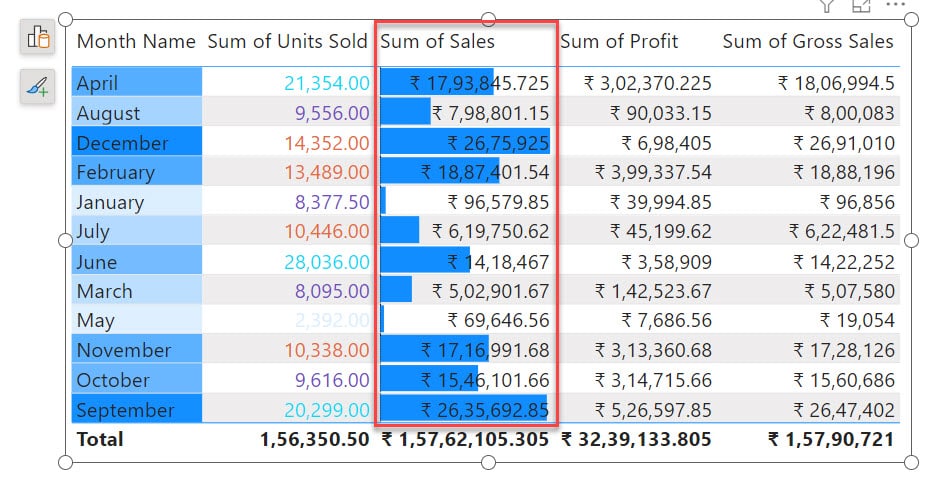
1. Select the Matrix visual -> go to the Format pane -> click Visual -> expand the Cell elements -> select Sum of Seles -> enable the Data bars.
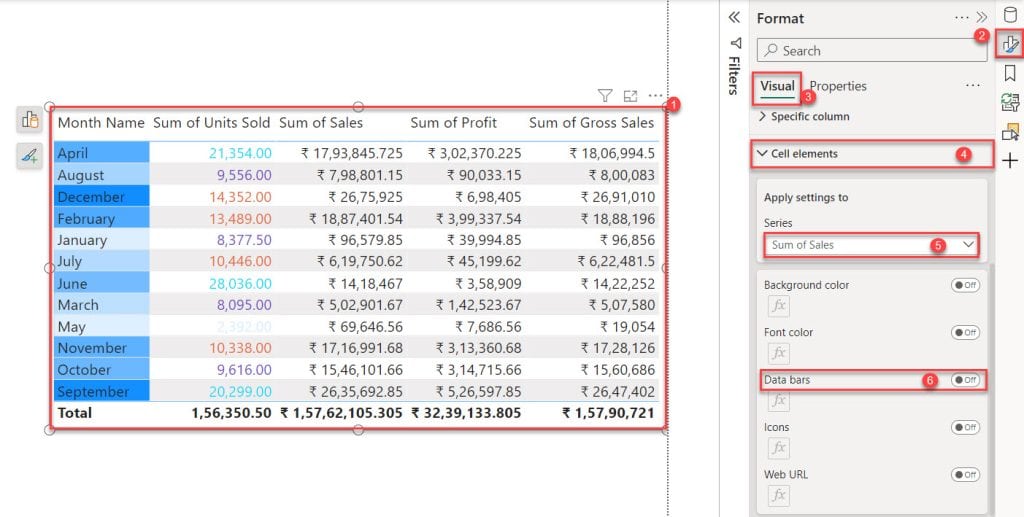
2. After enabling Data bars, you see in the Sales column that data bars are added automatically based on value.
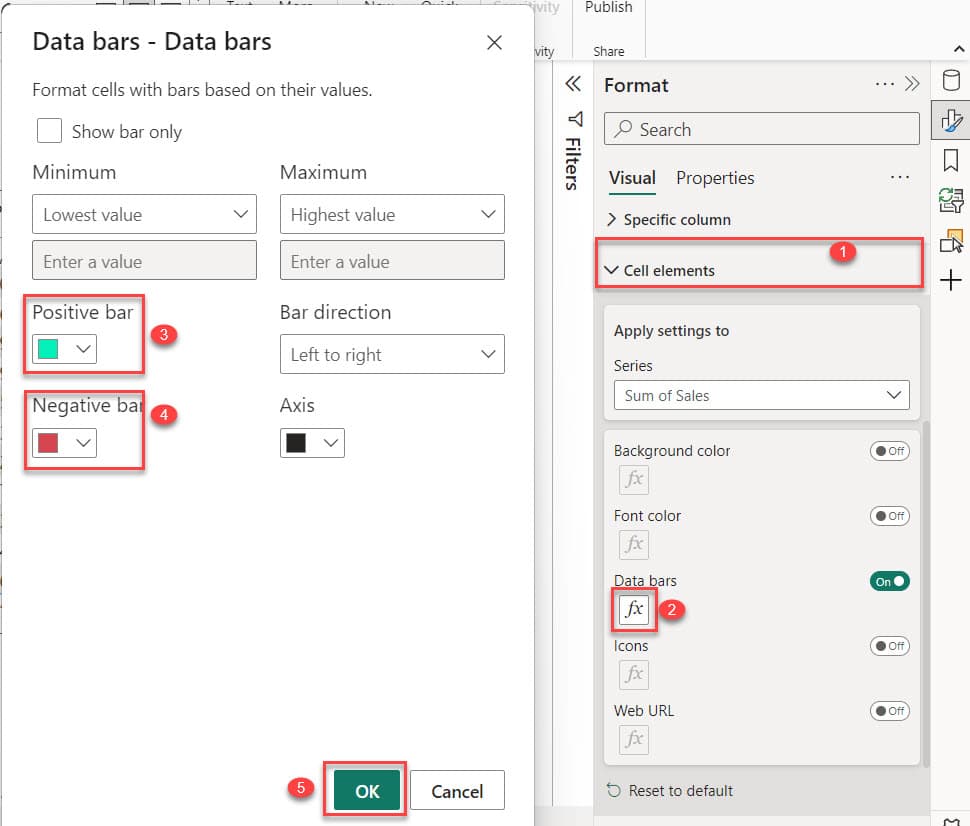
3. To change the Data bar color, expand the Cell elements -> Under the Data bar, click fx. Then, a Data bars window opens. We can set colors for the positive and negative values based on the maximum and minimum values in our data range. Then click OK.
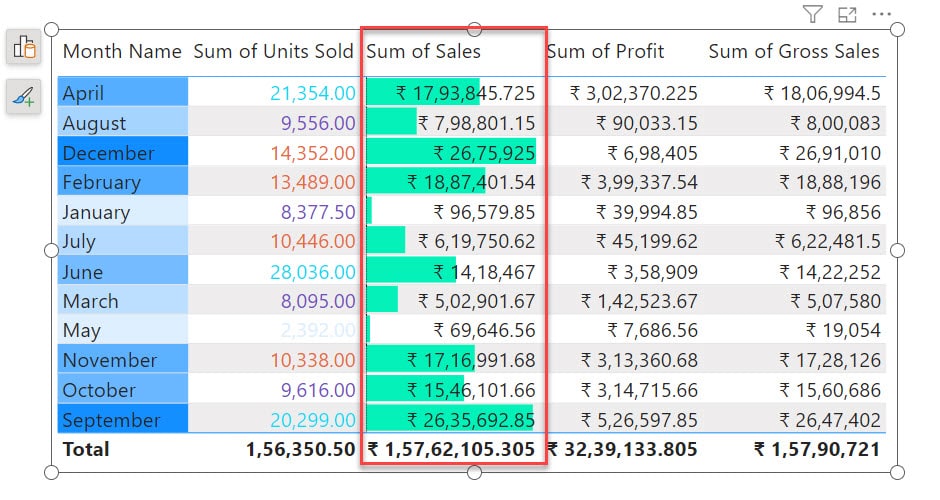
4. The cell’s Data bar color changes according to the Column values.
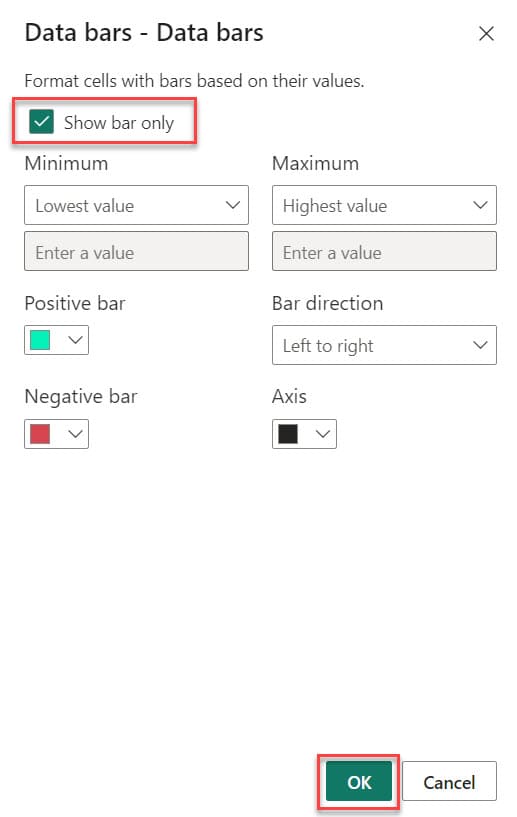
5. We can only show the Data bar and remove the font value. To do this, expand the Cell elements -> Under the Data bar, click fx -> check the Show bar Only check box -> click OK.
6. Then, you can see that the Sales column only shows the data bar.
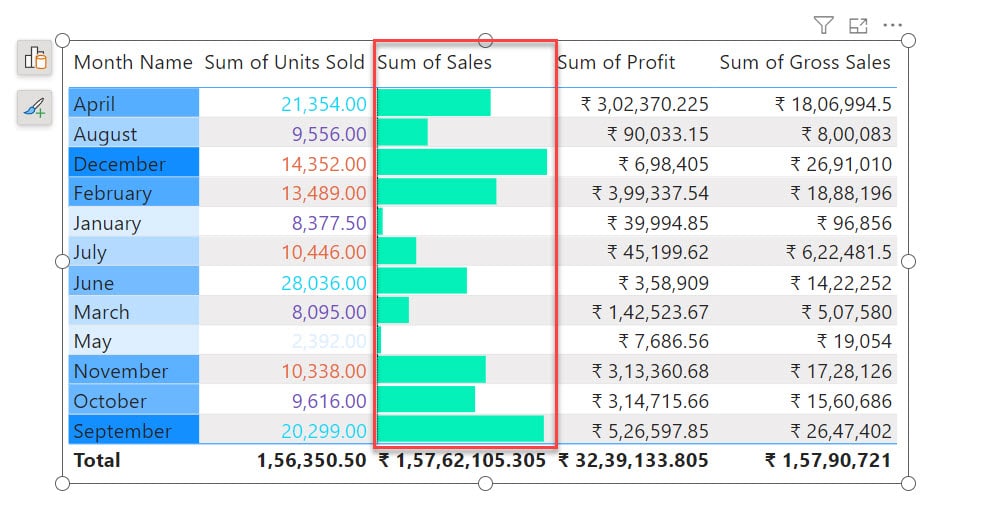
This way, you can format conditional using the Data Bar in the Power BI table visual.
Power BI Table Visual Conditional Formatting using Icons
In the Power BI table visual, I will tell you how to add icons to columns based on their values. It is also known as KPIs(key performance indicators) in Power BI.
1. Select the Matrix visual -> go to the Format pane -> click Visual -> expand the Cell elements -> select Sum of Profit -> enable the Icons.
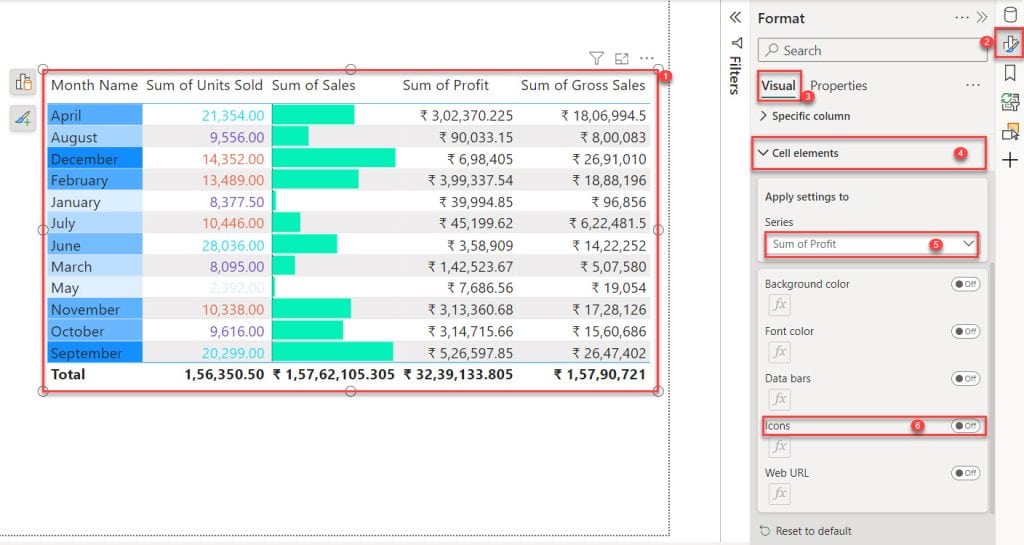
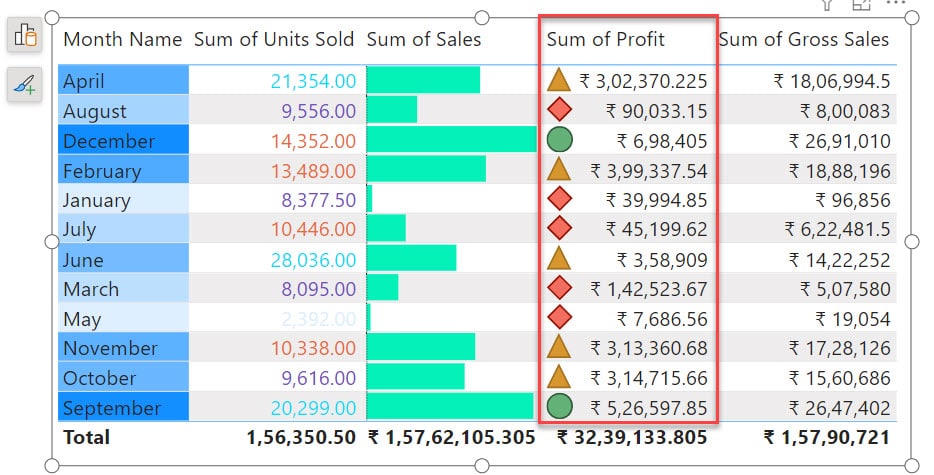
2. After enabling Icons, the icons are automatically added based on the value in the Profit column.
3. We can change the icons. To do this, go to the Cell elements section -> below the Icons, click the fx. The icons window box opens. In this box, expand the Style box. We can set up 25 different pairs of icons. Choose one pair icon and click the OK button.
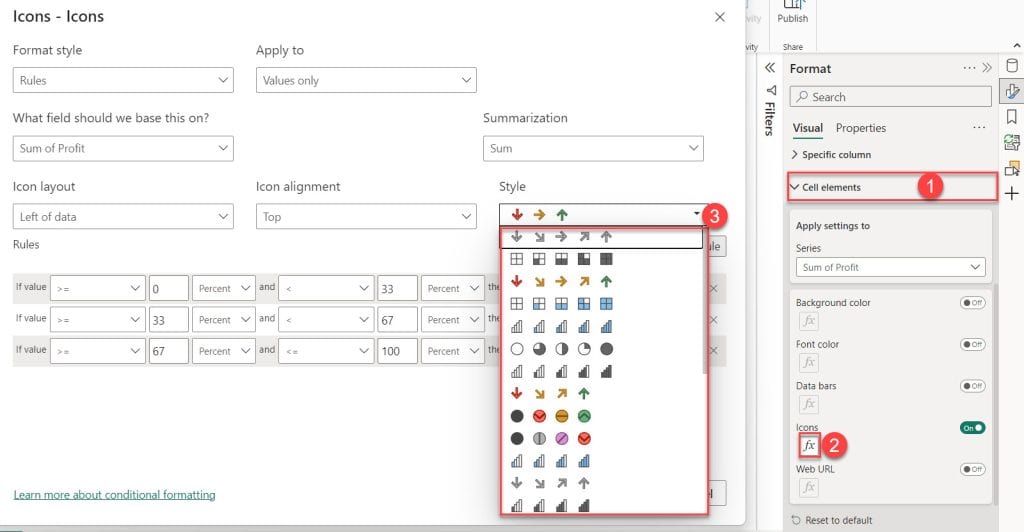
4. The icons are added to the Profit column based on value.
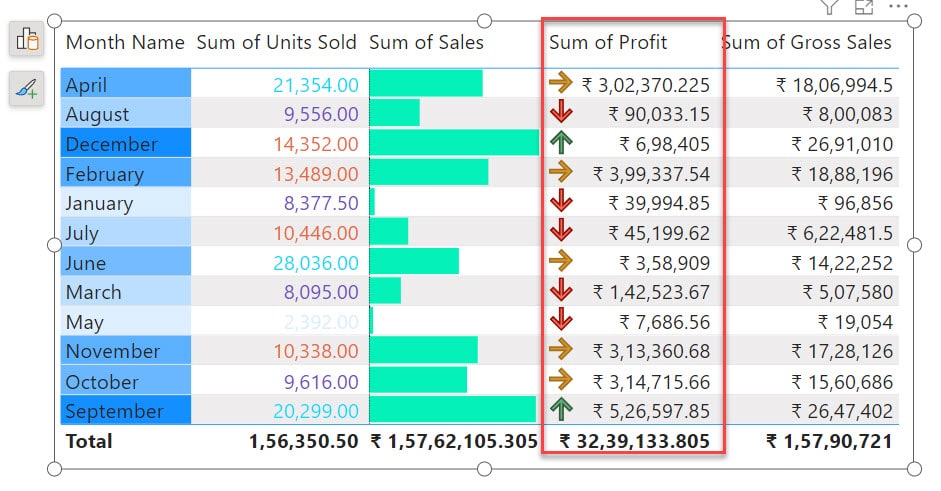
This way, you can add the icons to the table visual column in Power BI.
Power BI Table Visual Conditional Formatting using Web URL
I will tell you how to use web URL conditional formatting in the Power BI table visual.
To achieve this, I created an additional table in Power BI with columns for Country, Sales, and Profit.
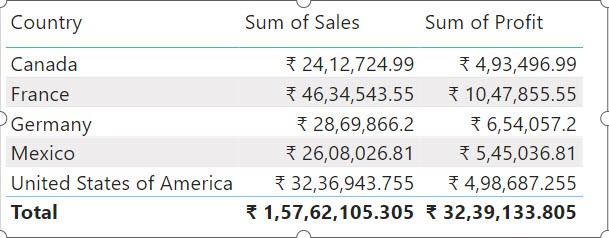
1. Under the Home tab, click on the New measure.

2. In the formula bar, put the below DAX expression. Then click Commit.
Web URL =
        SWITCH(
                MIN('Financial Sample'[Country]),
                "Canada","https://en.wikipedia.org/wiki/Canada",
                "France","https://en.wikipedia.org/wiki/France",
                "Germany","https://en.wikipedia.org/wiki/Germany",
                "Mexico","https://en.wikipedia.org/wiki/Mexico",
                "United States of America",
                 "https://en.wikipedia.org/wiki/United_States",
                ""
)
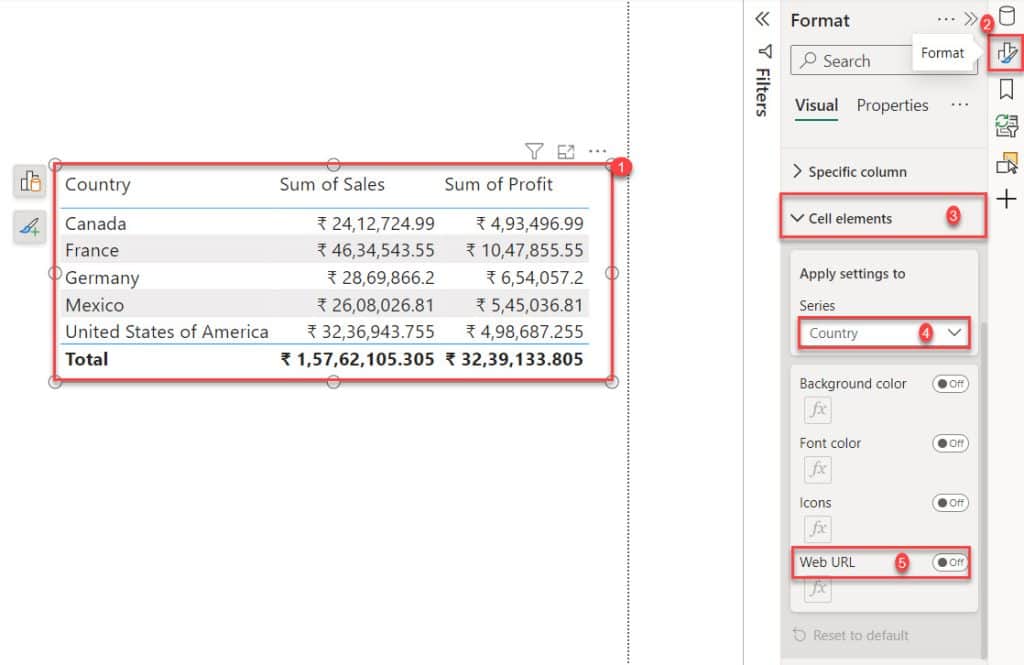
2. Select the Matrix visual -> go to the Format pane -> click Visual -> expand the Cell elements -> select Country -> enable the Web URL.
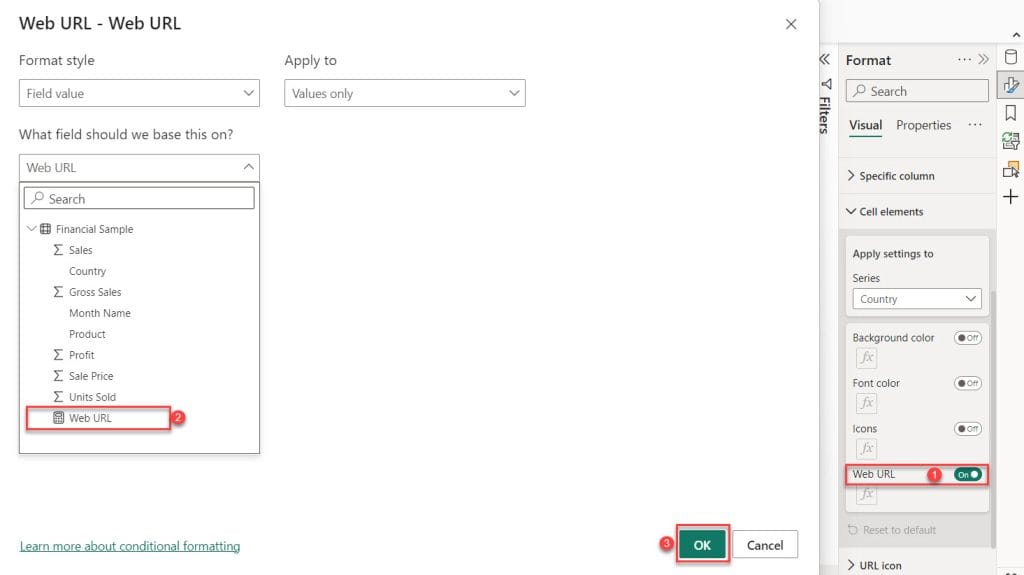
3. After enabling Web URL. A window Web URL comes. Here, choose the Web URL (Measure) in the What field should we base this on? Section. Then click OK.
4. After that, a web URL will be displayed when you hover over a value in the Country column. Check the screenshot below.
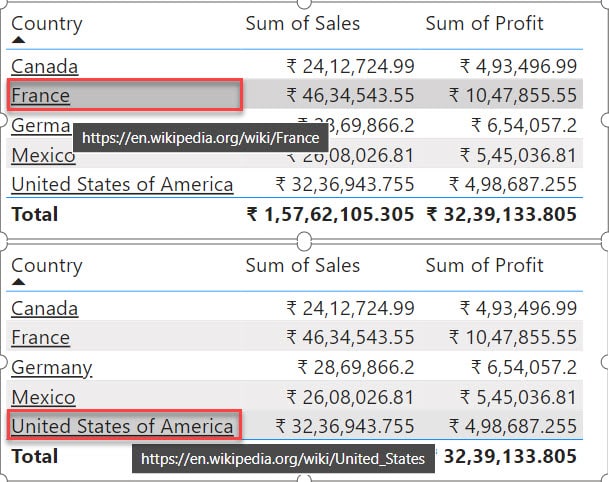
Using the above method, you add a URL to the table visual using the web URL conditional formatting.
Conclusion
I hope you know now how to apply conditional formatting in the Power BI table visual.
In this tutorial, we covered the concept of conditional formatting in Power BI table visuals. We explored applying it using various options such as background color, font color, data bars, icons, and web URLs.
You may also like:
- Power BI Conditional Formatting Based On Field Value
- Power BI Conditional Formatting Positive and Negative Numbers
- Power BI Bar Chart Conditional Formatting Multiple Values
- Power BI Conditional Formatting Based on Measure
I am Bijay a Microsoft MVP (10 times – My MVP Profile) in SharePoint and have more than 17 years of expertise in SharePoint Online Office 365, SharePoint subscription edition, and SharePoint 2019/2016/2013. Currently working in my own venture TSInfo Technologies a SharePoint development, consulting, and training company. I also run the popular SharePoint website EnjoySharePoint.com