In this Power BI tutorial, we will learn Power BI Conditional Formatting Positive and Negative Numbers. In addition, we will also learn how we can show negative numbers in brackets in Power BI.
Moreover, we will also cover below topics:
- Power BI conditional formatting negative percentage
- Power BI conditional formatting negative numbers red
- Power BI conditional formatting icon negative percentage
- Power BI negative numbers in brackets and red
Also, Read: Power BI Group by Column [With Various Examples]
Power BI conditional formatting positive and negative numbers
Let us see how we can apply conditional formatting to positive and negative numbers in Power BI.
In this example, we are going to use the below-mentioned Revenue table data to display the positive and negative numbers in Power BI.
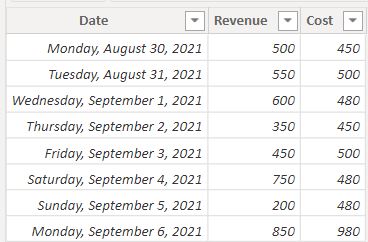
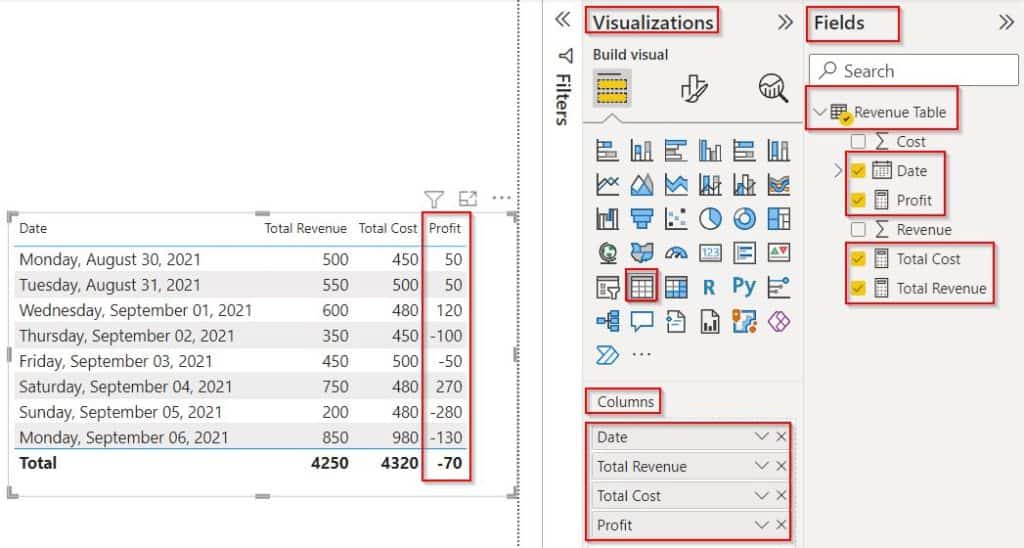
- Open the Power Bi desktop and load data into it. Here we will create three measure values to calculate the Total Revenue, Total cost, and Profit values.
- Select the new measure under the modeling tab and apply the below measure to find the Total Revenue value.
Total Revenue = SUM('Revenue Table'[Revenue])Where,
- Total Revenue = Measure Name
- Revenue Table = Table Name
- Revenue = Existing Column name
In the same way, create another new measure and apply the below formula to calculate the Total cost value.
Total Cost = SUM('Revenue Table'[Cost])Where,
- Total Cost = Measure Name
- Revenue Table = Table Name
- Cost = Existing Column name
Similarly, create another new measure and apply the below formula:
Profit = [Total Revenue] - [Total Cost]Where,
- Profit = Measure Name
- Total Revenue & Total Cost = Existing measure names
Now select the Power BI table visual from the visualization and drag-drop the created measure values and Date field from the fields pane as below:
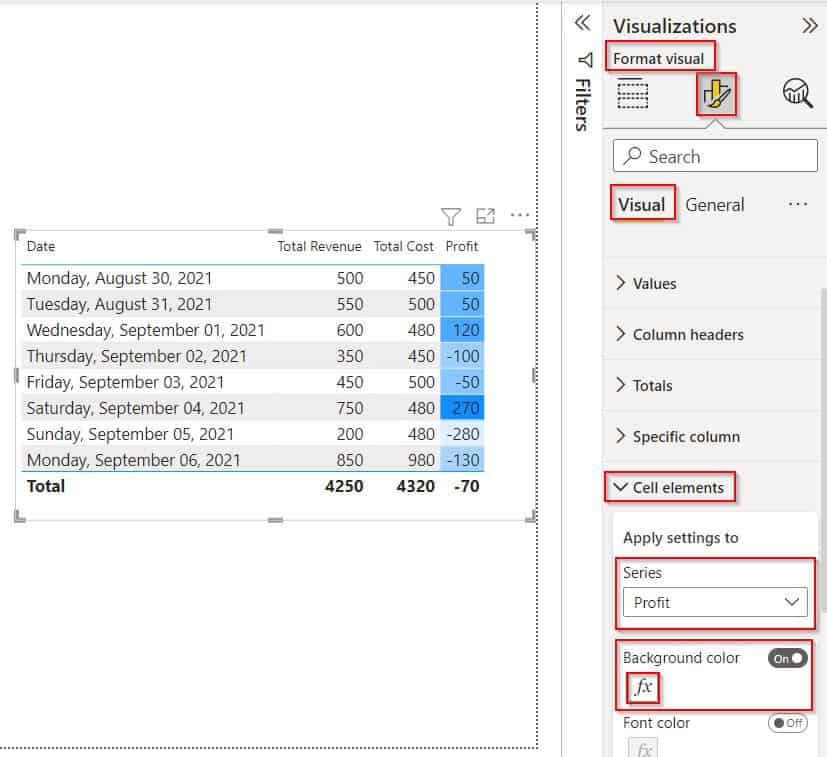
- To apply conditional formatting, select the Format Visual under the Visualisation pane, and Expand Cell Elements under the Visual tab (highlighted in Red):
- Enable the background color and click on the Fx icon as shown below:
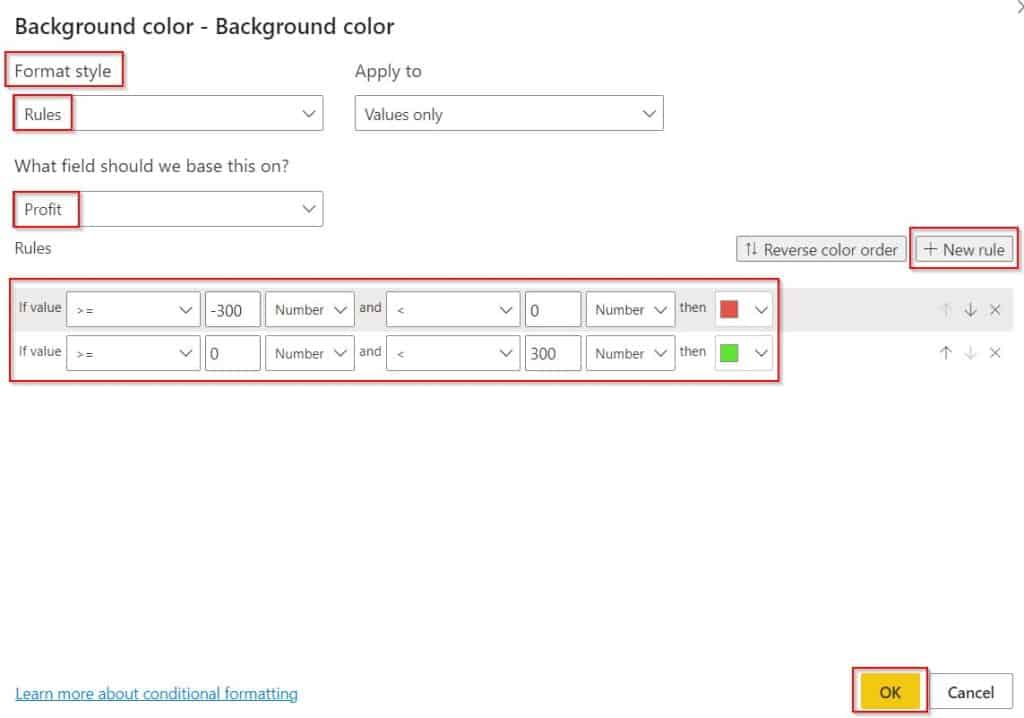
- Now, Select the Format style as Rules and choose the measure field value, Now add the rule that you want to apply. Select +New rule to add a new rule condition.
- Add the condition to apply the conditional formatting for the created measure value.
- Click on the Ok button to display the table visual based on the condition applied.
In the below screenshot, you can see that the displays the conditional formatting value for the created measure value is applied for the table visual.
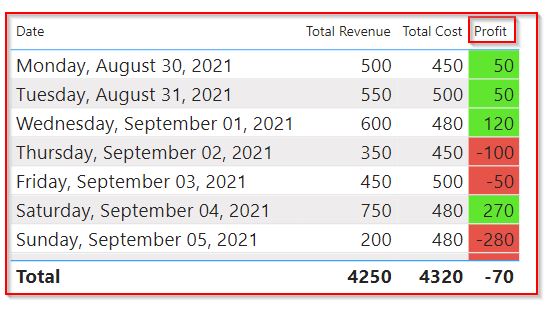
This is how to apply conditional formatting to positive and negative numbers in Power BI.
Check out: How to Convert Decimal to Text in Power BI
Power BI shows negative numbers in brackets
Here we will see how we can show negative numbers in brackets in Power Bi.
In this example, we will use the Power BI Format function to format the negative numbers in Parenthesis in Power BI.
Load data into the Power Bi desktop using the get data option. Once the data has been loaded select the new measure option under the modeling tab.
negative numbers in brackets = FORMAT([Profit],"##,###;(##,###);-")Where,
- Profit = Measure Name
- Total Revenue & Total Cost = Existing measure names
Now select the Power BI table visual from the visualization and drag-drop the created measure values and Date field from the fields pane as below:

- Drag-drop the created negative numbers in brackets measure into the table visual in Power BI.
- In the below screenshot, you can see that the negative value is formatted in parentheses as highlighted below:
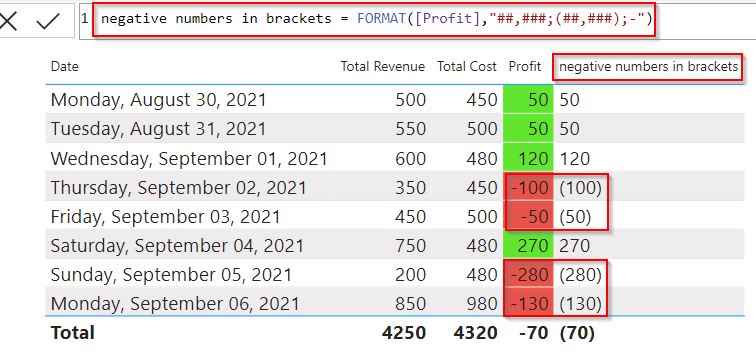
This is how to show negative numbers in brackets in Power Bi.
Have a look: Power BI Bar Chart Conditional Formatting Multiple Values
Power BI conditional formatting negative percentage
Let us see how we can apply conditional formatting negative percentages in Power BI.
In this example, we will use previously created profit measure value and convert the negative value to a negative percentage in Power BI.
- Open the Power Bi desktop and load data into it. Select the table visual from visualization and drag-drop the created three calculate measure values Total Revenue, Total cost, and Profit values as below:

- To show Percentages change the format to a percentage by selecting Measure tools -> Percentage as highlighted below:
- The screenshot below displays the Profit value in the percentage format.
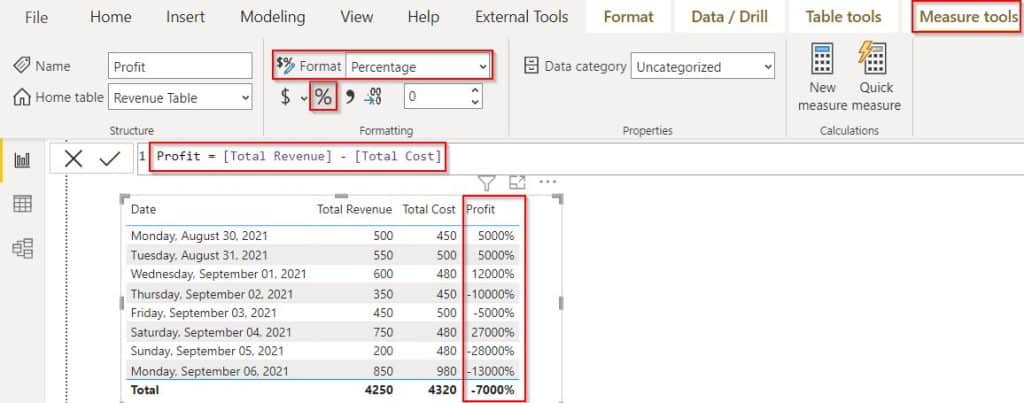
- To apply conditional formatting, select the Format Visual under the Visualisation pane, and Expand Cell Elements under the Visual tab (highlighted in Red):
- Enable the background color and click on the Fx icon.

- Now, Select the Format style as Rules and choose the measure field value to apply the conditional formatting for the negative percentage value.
- Click on the Ok button to display the table visual based on the condition applied.
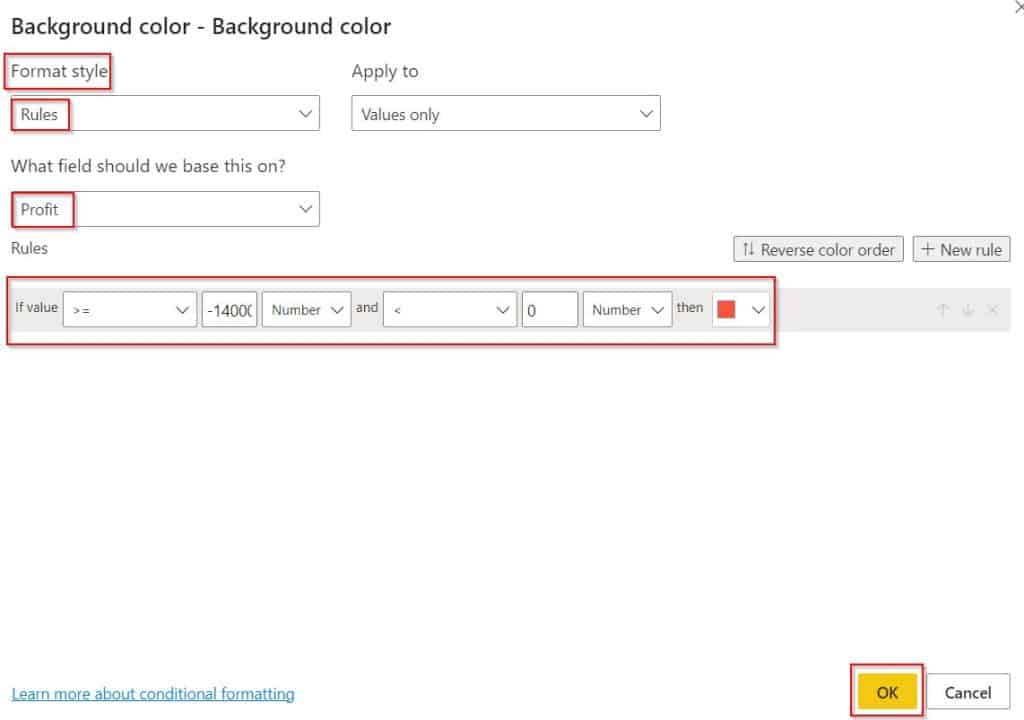
In the below screenshot, you can see that the displays the conditional formatting value for the created measure value is applied for the table visual.
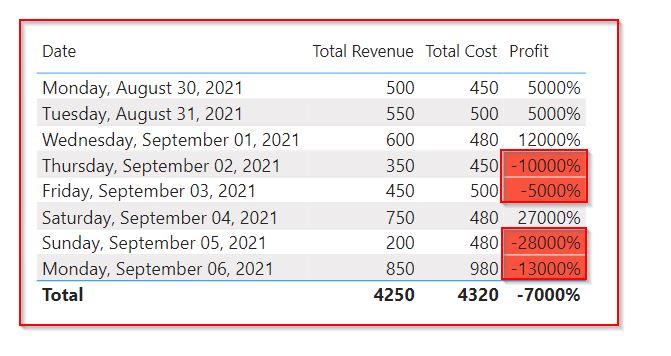
This is how to apply conditional formatting negative percentages in Power BI.
Power BI conditional formatting negative numbers red
Here we will see how to apply conditional formatting negative numbers red in Power BI.
In this example, we will use previously created profit measure value to display the negative numbers in red.
- Open the Power Bi desktop and load data into it. Select the table visual from visualization and drag-drop the date field and also created three calculated measure values Total Revenue, Total cost, and Profit values as below:

- To apply conditional formatting, select the Format Visual under the Visualisation pane, and Expand Cell Elements under the Visual tab (highlighted in Red):
- Enable the font color and click on the Fx icon to display the negative numbers in red as shown below:

- Now, Select the Format style as Rules and choose the measure profit field value to apply the conditional formatting for the negative values in red.
- Click on the Ok button to display the table visual based on the condition applied.

In the below screenshot, you can see that the displayed negative values are in red for the created measure value in the table visual.
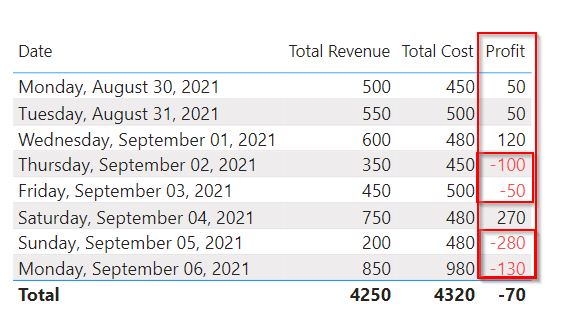
This is how to apply conditional formatting negative numbers red in Power BI.
Power BI conditional formatting icon negative percentage
Let us see how we can apply conditional formatting icon negative percentage in Power BI.
In this example, we will calculate the negative percentage value and later we will apply conditional formatting in Power BI.
Open the Power Bi desktop and load data into it. Select the table visual from visualization and drag-drop the created three calculate measure values Total Revenue, Total cost, and Profit values as below:

- To show Percentages change the format to a percentage by selecting Measure tools -> Percentage as highlighted below:
- The screenshot below displays the Profit value in the percentage format.

- To apply conditional formatting, select the Format Visual under the Visualisation pane, and Expand Cell Elements under the Visual tab (highlighted in Red):
- Enable the icon color and click on the Fx icon.

- Now, Select the Format style as Rules and choose the measure profit field value to apply the conditional formatting for icon negative percentage values in red.
- Click on the Ok button to display the table visual based on the condition applied.
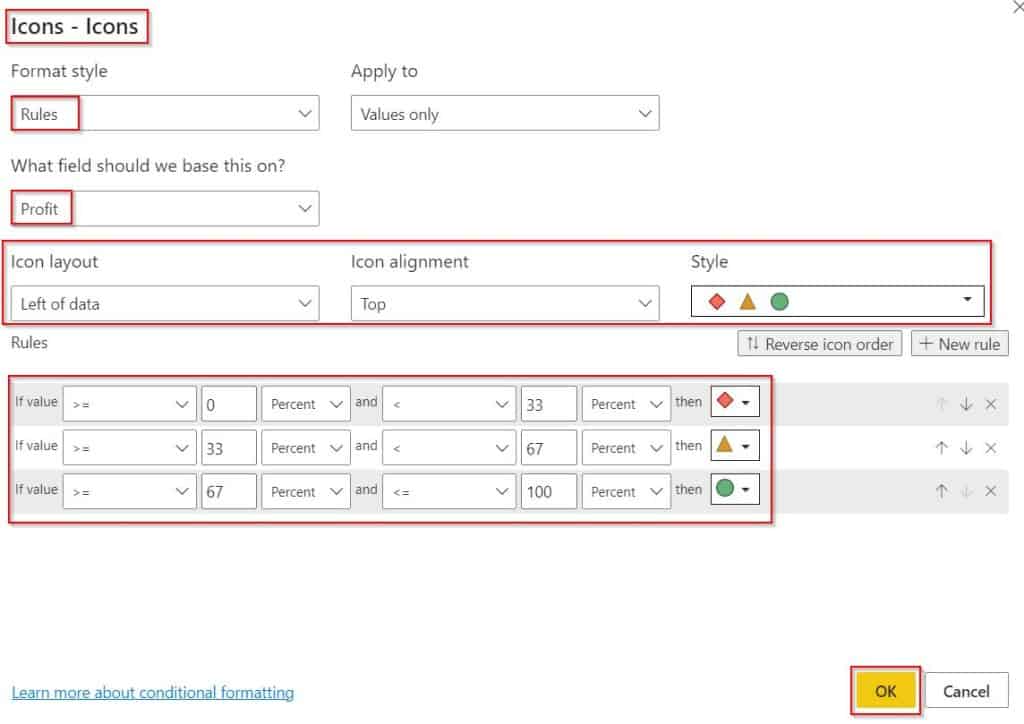
In the below screenshot, you can see that the visual displays the negative percentage value with icons based on the condition applied.
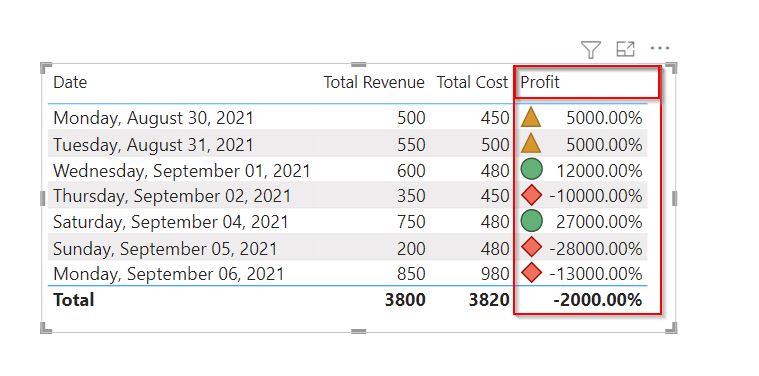
This is how to apply conditional formatting icon negative percentage in Power BI.
Power BI negative numbers in brackets and red
Here we will see how to apply for conditional formatting negative numbers in brackets and red in Power BI.
In this example, we will use previously created profit measure value to display the negative numbers in brackets and red.
- Load data into the Power Bi desktop. Select the table visual from visualization and drag-drop the date field and also created three calculated measure values Total Revenue, Total cost, and Profit values as below:

- select the new measure option under the modeling tab and apply the below-mentioned formula:
Negative numbers = FORMAT([Profit],"#,##0.00;(#,##0.00)") Where,
- Negative numbers = Measure Name
- Profit = Existing measure names
- Drag-drop the created negative numbers in brackets measure into the table visual in Power BI.
- In the below screenshot, you can see that the visual display the negative numbers in brackets and red based on the measure applied.
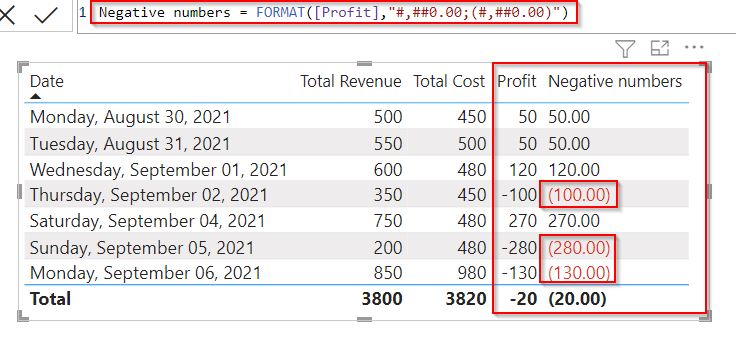
This is how to apply for conditional formatting negative numbers in brackets and red in Power BI.
Additionally, you may like some more Power BI tutorials:
- Power BI Count If True
- Power BI DAX ISBLANK vs ISEMPTY
- Power BI Conditional Formatting Based on Measure
- How to Concatenate with Space in Power BI
- Power BI Conditional Formatting Based On Field Value
In this Power BI tutorial, we have learned how to apply condition formatting for positive and negative numbers. In addition, we also learned how we can show negative numbers in brackets in Power BI.
Moreover, we also covered the below topics:
- Power BI conditional formatting negative percentage
- Power BI conditional formatting negative numbers red
- Power BI conditional formatting icon negative percentage
- Power BI negative numbers in brackets and red
I am Bijay a Microsoft MVP (10 times – My MVP Profile) in SharePoint and have more than 17 years of expertise in SharePoint Online Office 365, SharePoint subscription edition, and SharePoint 2019/2016/2013. Currently working in my own venture TSInfo Technologies a SharePoint development, consulting, and training company. I also run the popular SharePoint website EnjoySharePoint.com