In this Power BI Tutorial, we will learn about how to apply conditional formatting based on a field value in Power BI with a few examples, and also we will cover the below topics:
- Power BI conditional formatting based on field value greyed out
- Power BI conditional formatting icon based on field value
- Power BI conditional formatting based on field value not working
- Power BI conditional formatting based on multiple field value
- Power BI conditional formatting based on another field value
- Power BI conditional formatting bar chart based on field value
Also, Read: Power BI Conditional Formatting Positive and Negative Numbers
Power BI conditional formatting based on field value
Let us see how we can change the background color based on the field value in Power BI,
In this example, we will use the Weather data table to apply the conditional formatting based on a field value.
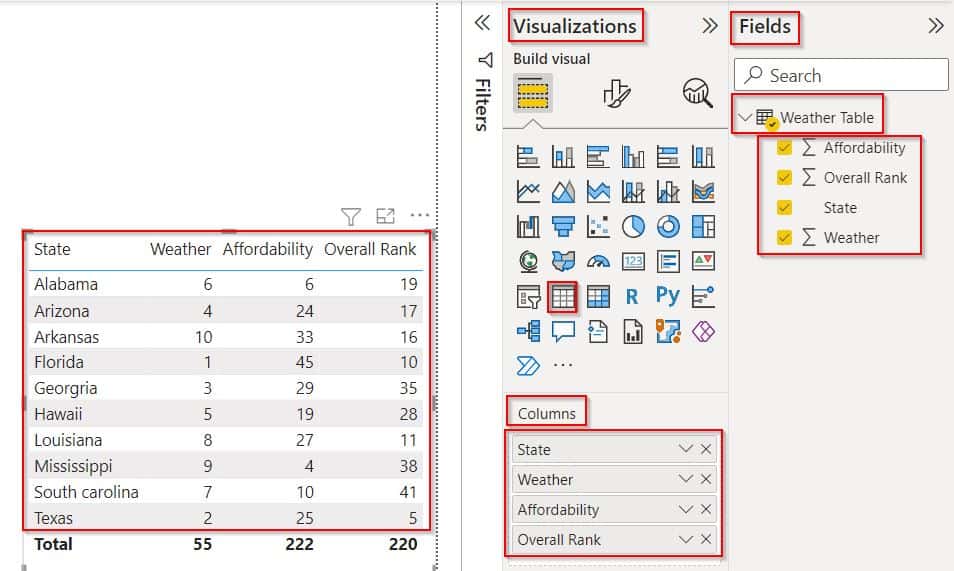
Open the Power Bi desktop and load data into it. Then Select the Table visual, In the column fields drag and drop the State, Weather, Affordability, and Overall rank fields from the field pane as shown below:
Create a new measure and apply the below-mentioned formula, and click on the check icon.
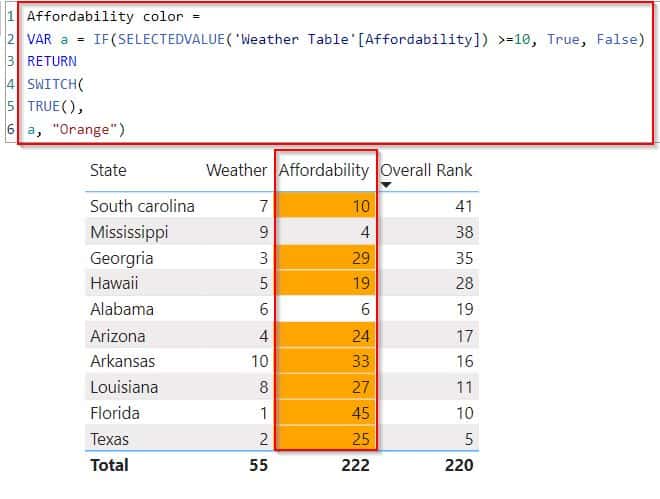
Affordability color =
VAR a = IF(SELECTEDVALUE('Weather Table'[Affordability]) >=10, True, False)
RETURN
SWITCH(
TRUE(),
a, "Orange")
Where,
- Affordability color = Measure Name
- a = variable names
- SELECTEDVALUE,SWITCH = Function Names
- Weather Table = Table Name
- Affordability = Column Name
- Drag and drop the created measure value into the table visual.
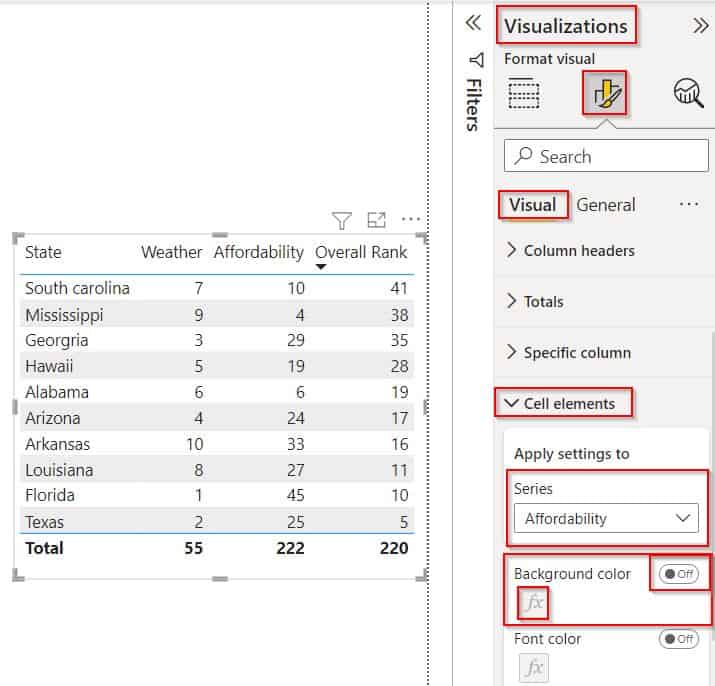
- Select the Format Visual under the Visualisation pane, and Expand Cell Elements under the Visual tab (highlighted in Red):
- Enable the background color and click on the Fx icon as shown below:
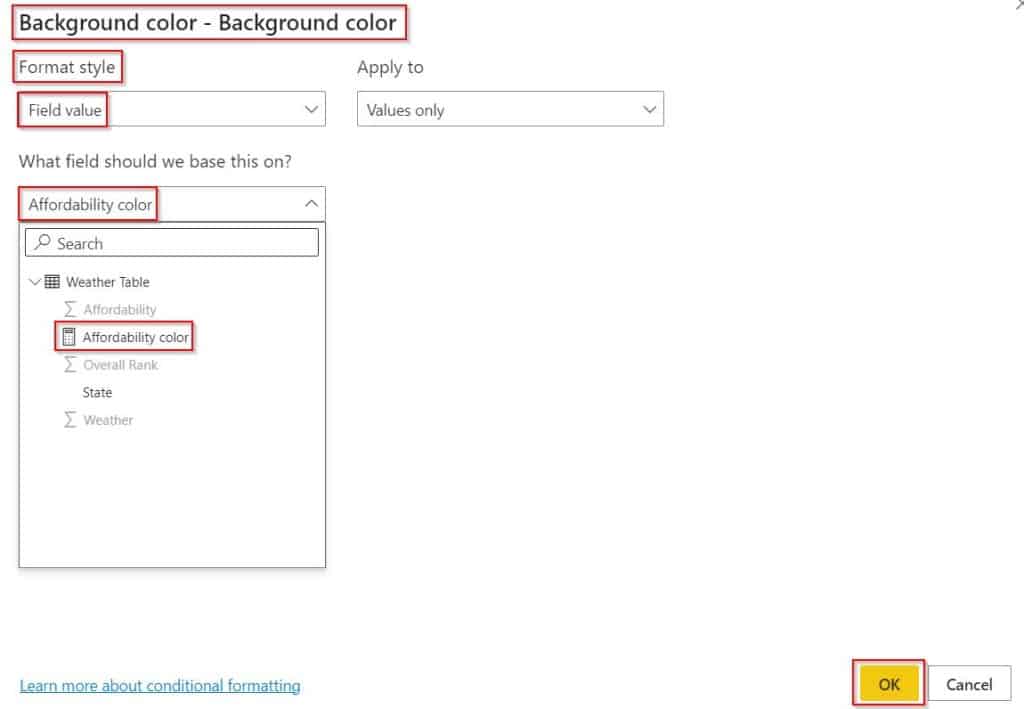
Now in the conditional formatting for background color, select the Format by as Field value, select the Apply to as Value only, and select the measured field that we have created. Click on OK.
The screenshot below shows that the color has been changed based on the selected field value.
This is how to change the background color based on the field value in Power BI.
Check out: Power BI Bar Chart Conditional Formatting Multiple Values
Power BI conditional formatting based on field value greyed out
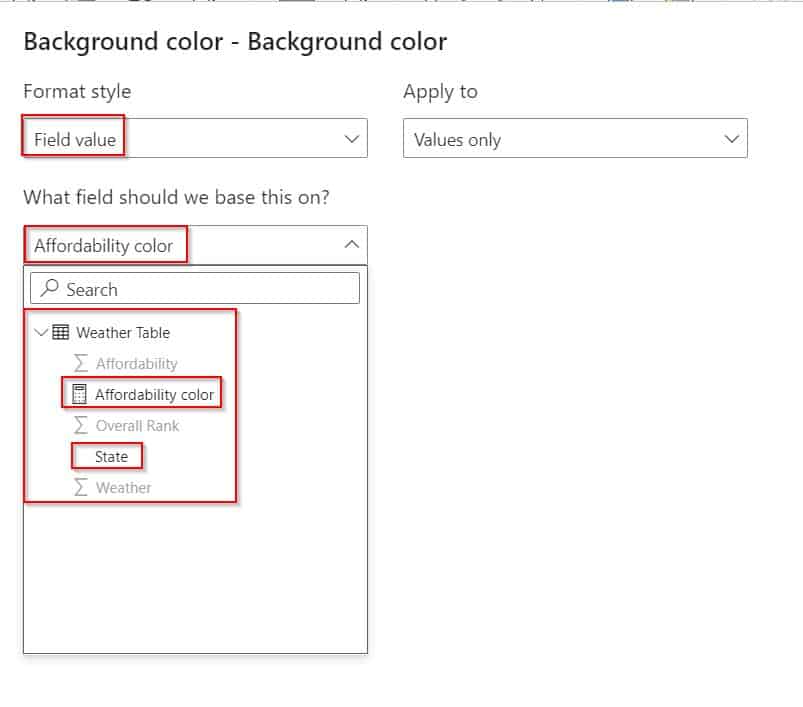
- In Power Bi, Conditional formatting based on field value supports only the text data type value.
- For the field value which is of number data type value it displays as greyed out and it is not possible to select the numeric field values to apply conditional formatting in Power BI.
- In the below screenshot, you can see that the under the field values only the text data type values called State and Affordability color value fields are enabled and the numeric values are disabled and greyed out.
Check out: Power BI conditional formatting based on field value text
Power BI conditional formatting icon based on field value
Here we will see how we can apply conditional formatting icons based on a field value in Power BI.
In this example, we will add icons to the measure based on the field value presented in the table visual in Power BI.
- Load data into the Power Bi desktop, Select the Table visual, In the column fields, drag and drop the State, Weather, Affordability, and Overall rank fields from the field pane.
- Select a new measure and apply the below-mentioned formula, and click on the check icon.
Overall Rank status =
VAR a = IF(SELECTEDVALUE('Weather Table'[Overall Rank]) <20, True, False)
VAR b = IF(SELECTEDVALUE('Weather Table'[Overall Rank]) >=20, True, False)
RETURN
SWITCH(
TRUE(),
a, "CircleLow",
b,"CircleHigh")
Where,
- Overall Rank status = Measure Name
- a,b = variable names
- SELECTEDVALUE,SWITCH = Function Names
- Weather Table = Table Name
- Overall Rank = Column Name
- Drag and drop the created measure value into the table visual.
- Select the Format Visual under the Visualisation pane, and Expand Cell Elements under the Visual tab (highlighted in Red):
- Enable the Icons and click on the Fx icon as shown below:
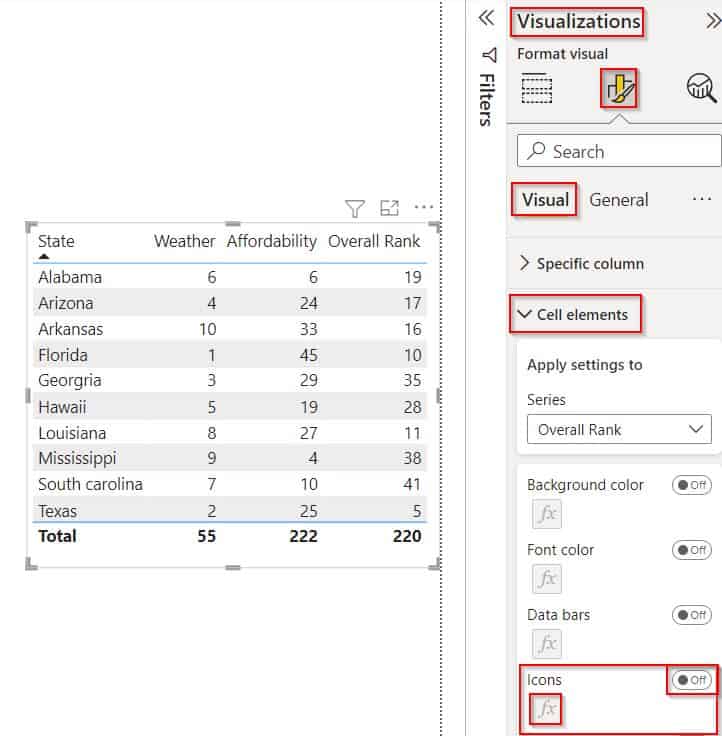
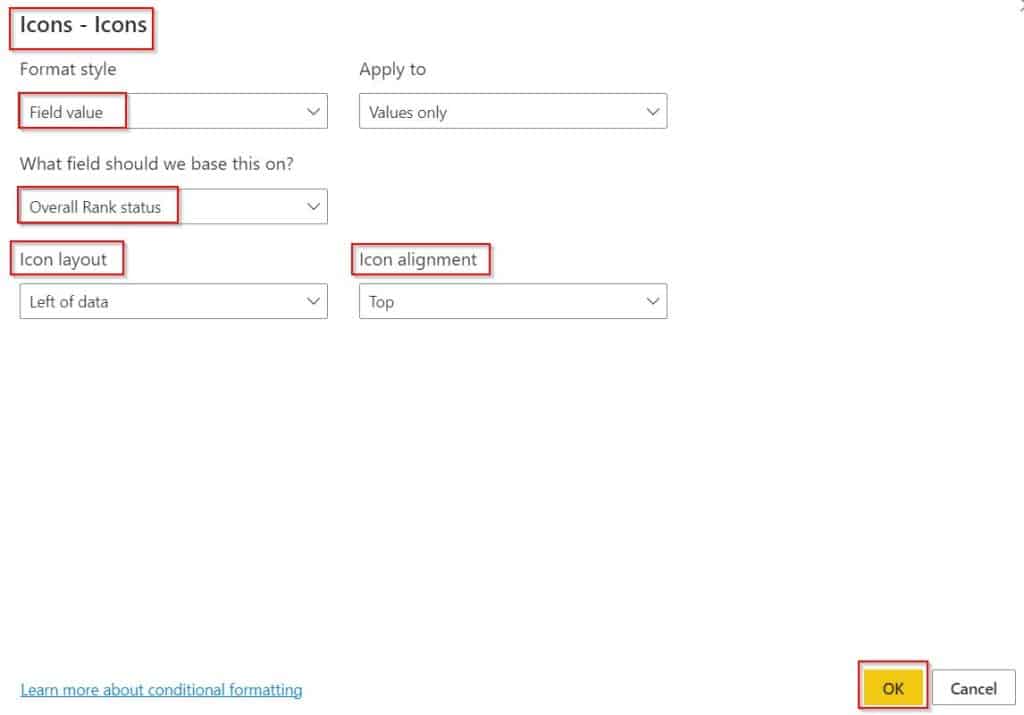
- Now in the conditional formatting for background color, select the Format by as Field value, select the Apply to as Value only, and select the measured field that we have created.
- Choose the Icon Layout and Icon Alignment and then Click on OK.
In the below screenshot, you can see that the icon has been changed based on the selected field value and condition applied.
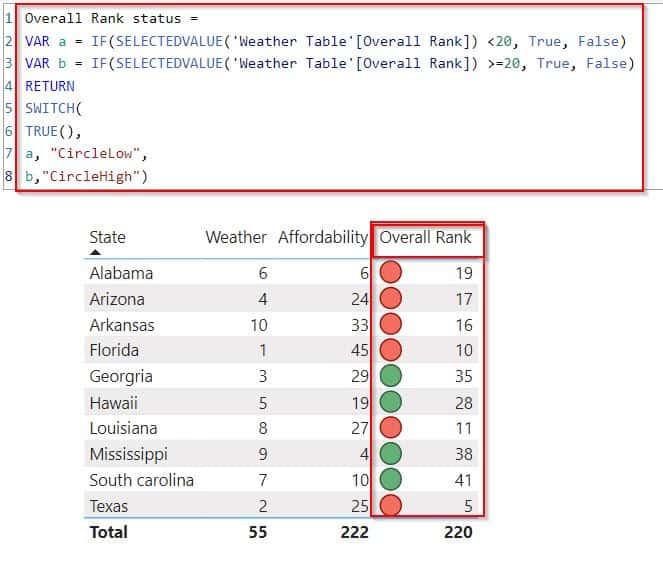
This is how to apply conditional formatting icons based on a field value in Power BI.
Power BI conditional formatting based on field value not working
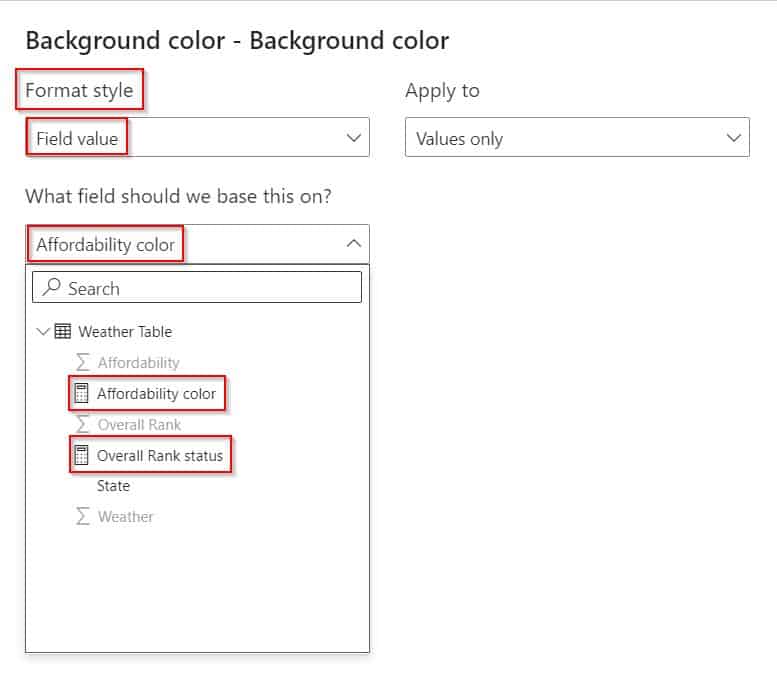
- Power BI conditional formatting based on field value works, when you select the Format style as Field value as highlighted below:
- Field value supports only the text data type value and not the number data type value to apply conditional formatting in Power BI.
Power BI conditional formatting based on multiple field value
Let us see how we can apply conditional formatting based on multiple field values in Power BI.
Yes, it is possible to apply conditional formatting for the matrix visual in Power BI with Multiple field values.
- Load data into the Power Bi desktop, Select the Matrix visual, In the row section select the state fields, and drag and drop the State, Weather, and Affordability fields from the field pane into the values section.
- Select a new measure and apply the below-mentioned formula, and click on the check icon.
Weather Status = VAR a = IF(SELECTEDVALUE('Weather Table'[Weather]) <=2, True, False)
VAR b = IF(SELECTEDVALUE('Weather Table'[Weather]) <=6, True, False)
VAR c = IF(SELECTEDVALUE('Weather Table'[Weather]) >=7, True, False)
RETURN
SWITCH(
TRUE(),
a, "Orange",b, "yellow",c, "lightgreen")
Where,
- Weather Status = Measure Name
- a,b,c = variable names
- SELECTEDVALUE,SWITCH = Function Names
- Weather Table = Table Name
- Weather = Column Name
- Select the Matrix visual and choose Format Visual under the Visualisation pane, and Expand Cell Elements under the Visual tab (highlighted in Red):
- Enable the background color and click on the Fx icon as shown below:
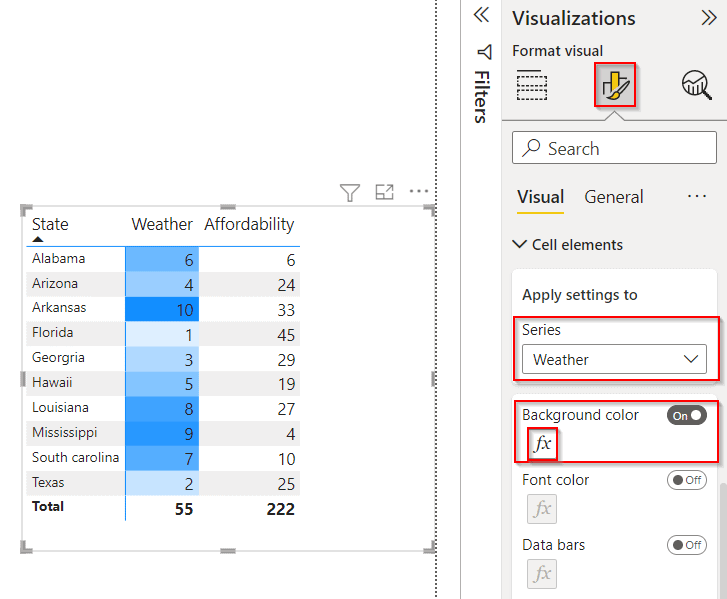
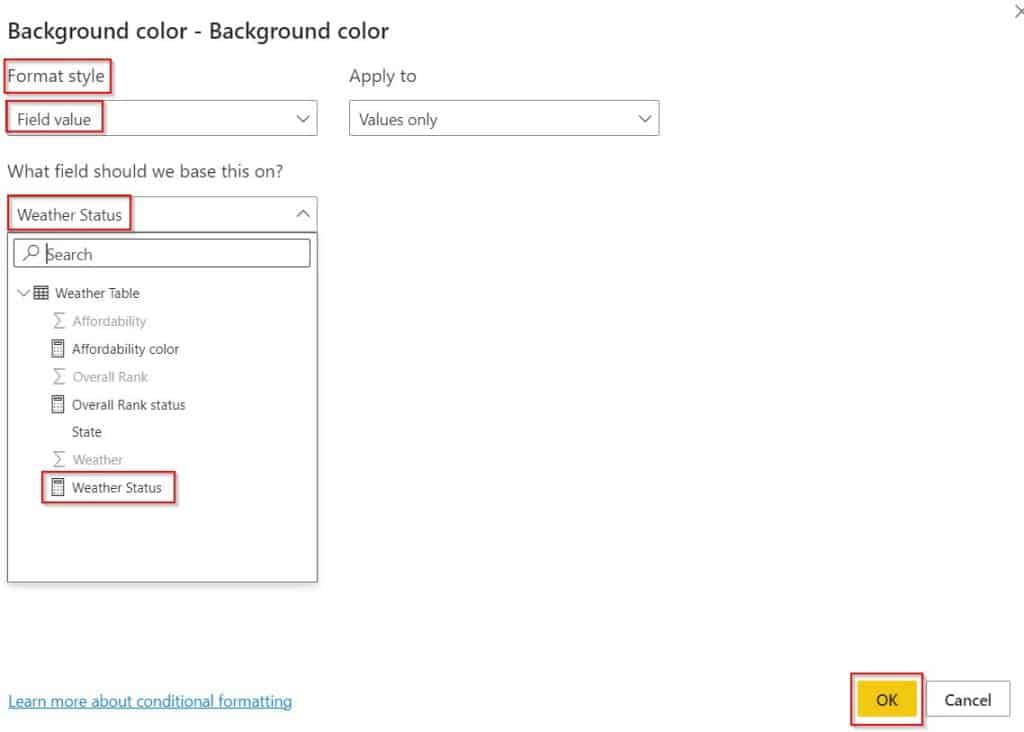
Now in the conditional formatting for background color, select the Format by as Field value, select the Apply to as Value only, and select the measured field that we have created. Click on the OK button.
In the below screenshot, you can see that the conditional formatting has been applied based on the multiple fields in Power BI Matrix visual.
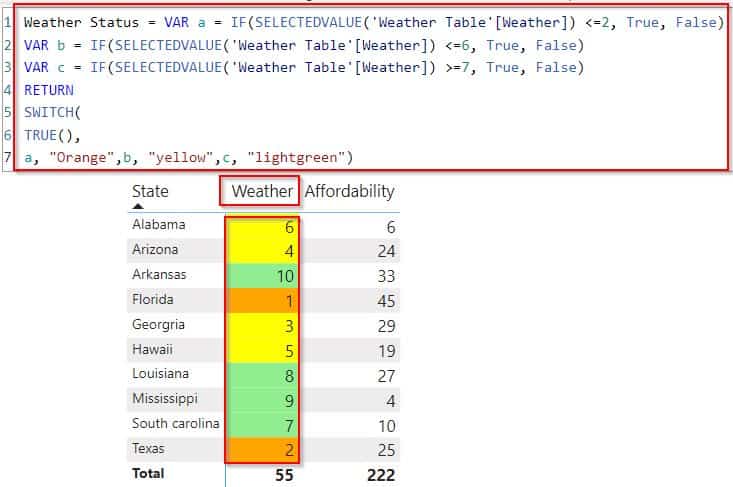
This is how to apply conditional formatting based on multiple field values in Power BI.
Read: Power BI Conditional Formatting Based on Measure
Power BI conditional formatting based on another field value
- It is not possible to apply conditional formatting based on another field value in Power BI.
- If we select any field value, we can apply conditional formatting only for the selected field value, we cannot apply conditional formatting based on another field value.
Power BI conditional formatting bar chart based on field value
Let us see how we can apply the bar chart color based on the field value in Power BI.
Open the Power Bi desktop and load data into it. Selected the stacked bar chart visual drag and drop the state field and the affordability field value in the field section as shown below:
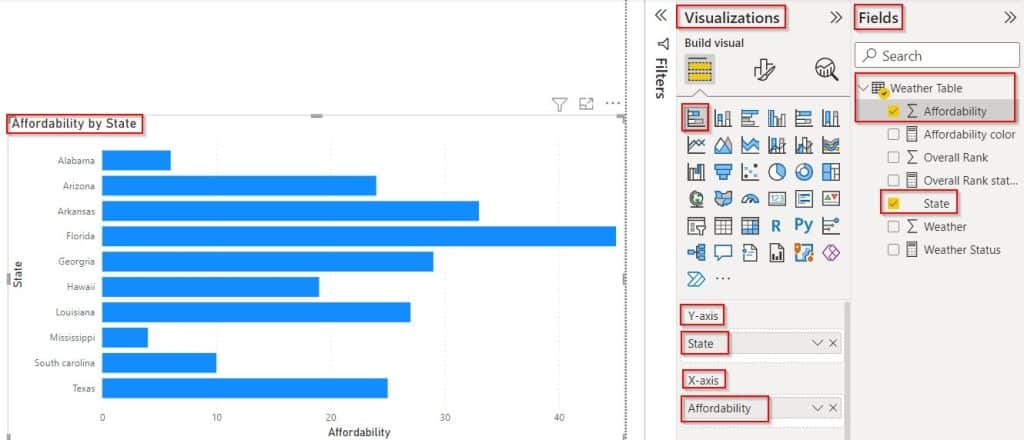
Create a new measure and apply the below-mentioned formula, and click on the check icon.
Affordability color Status = VAR a = IF(SELECTEDVALUE('Weather Table'[Affordability]) <=10, True, False)
VAR b = IF(SELECTEDVALUE('Weather Table'[Affordability]) <=25, True, False)
VAR c = IF(SELECTEDVALUE('Weather Table'[Affordability]) >25, True, False)
RETURN
SWITCH(
TRUE(),
a, "Orange",b, "yellow",c, "lightgreen")
Where,
- Affordability color = Measure Name
- a,b,c = variable names
- SELECTEDVALUE,SWITCH = Function Names
- Weather Table = Table Name
- Affordability = Column Name
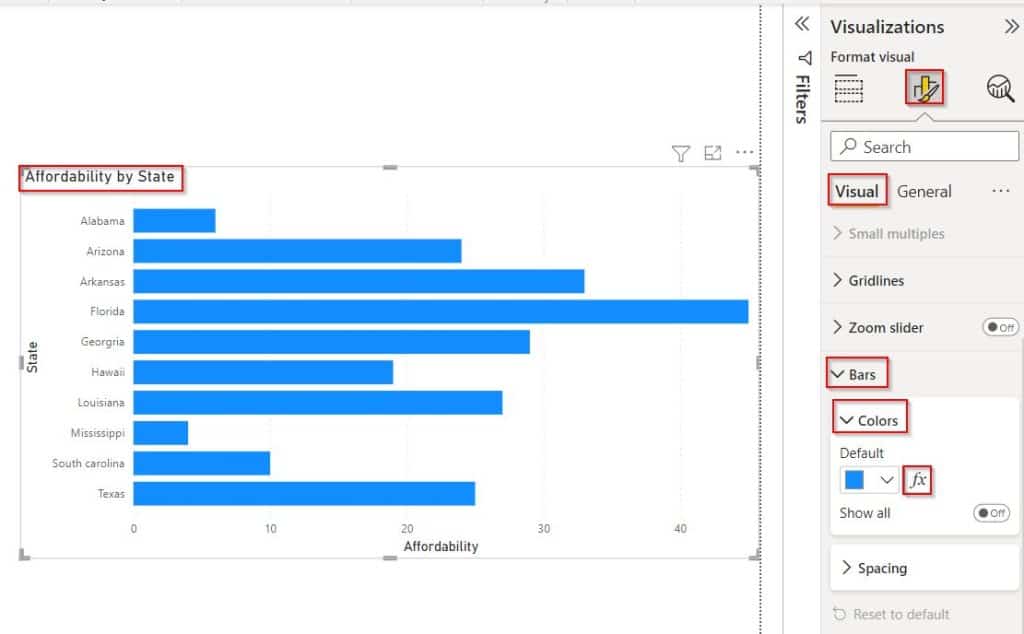
- Select the Format Visual under the Visualisation pane, and Expand Bars under the Visual tab (highlighted in Red):
- Enable the Bars -> Colors and click on the Fx icon as shown below:
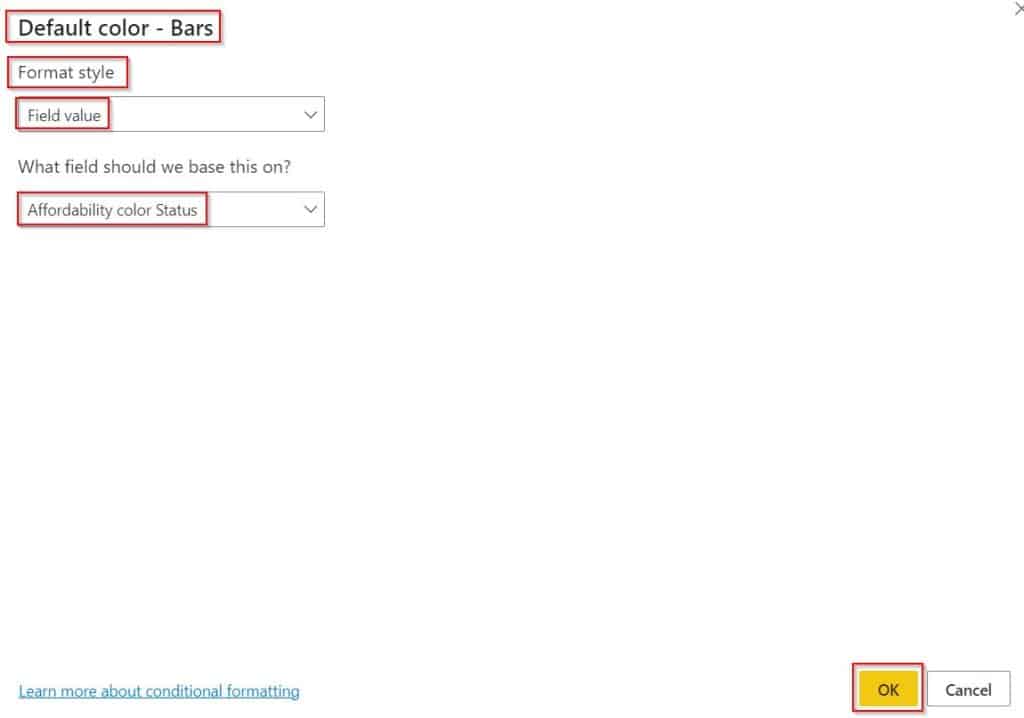
Now in the default color bars select the Format by as Field value, and select the measured field that we have created. Click on the OK button.
The Screenshot below displays the bar colors based on the conditional applied.
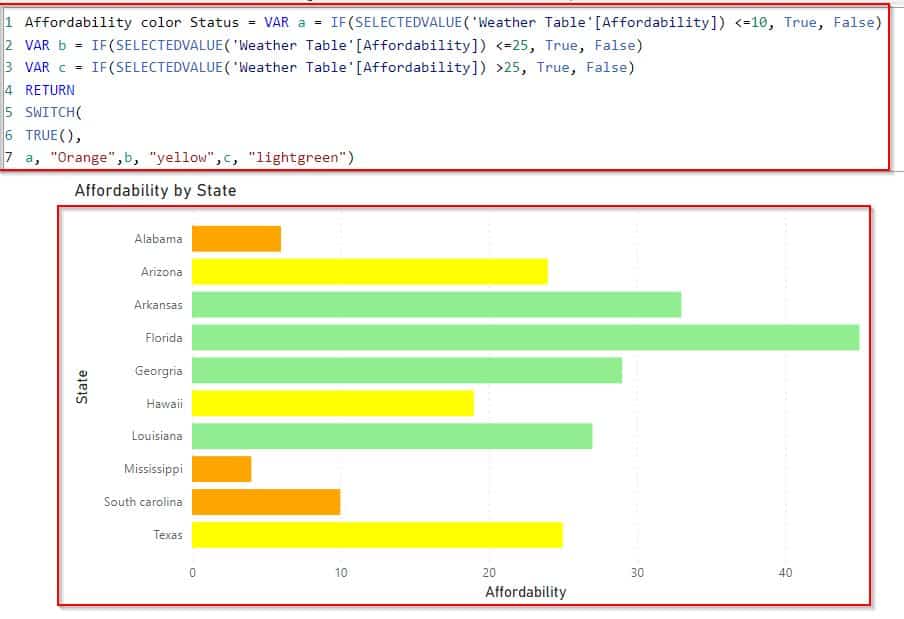
This is how to apply the bar chart color based on the field value in Power BI.
Additionally, you may like some more Power BI tutorials:
- How to Convert Date to Text in Power BI
- Power BI Group by Column [With Various Examples]
- Power BI DAX ISBLANK vs ISEMPTY
- How to Convert Decimal to Text in Power BI
In this Power BI Tutorial, we have learned about how to apply conditional formatting based on a field value in Power BI with a few examples, and also we covered the below topics:
- Power BI conditional formatting based on field value greyed out
- Power BI conditional formatting icon based on field value
- Power BI conditional formatting based on field value not working
- Power BI conditional formatting based on multiple field value
- Power BI conditional formatting based on another field value
- Power BI conditional formatting bar chart based on field value
I am Bijay a Microsoft MVP (10 times – My MVP Profile) in SharePoint and have more than 17 years of expertise in SharePoint Online Office 365, SharePoint subscription edition, and SharePoint 2019/2016/2013. Currently working in my own venture TSInfo Technologies a SharePoint development, consulting, and training company. I also run the popular SharePoint website EnjoySharePoint.com