In this Power BI tutorial, we will learn how to apply conditional formatting based on a text value in Power BI with different examples. In addition, we will also cover the below-mentioned topics:
- Power BI conditional formatting based on text measure
- Power BI conditional formatting based on a text card
- Power BI conditional formatting based on text icon
- Power BI conditional formatting background based on text
- Power BI conditional formatting based on text does not count
Power BI conditional formatting based on text value
Let us see how we can change the background color based on the text value in Power BI,
In this example, we will use the Products ordered data table to apply the conditional formatting based on text value.
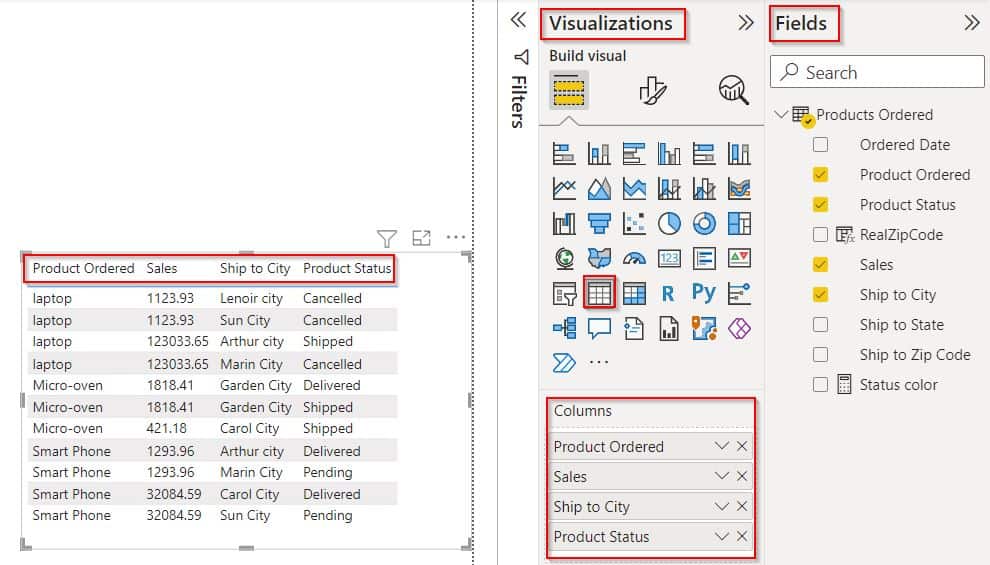
- Open the Power Bi desktop and load data into it. Then Select the Table visual, In the column field drag and drop the Products ordered, Sales, Ship to city, and Product Status fields as shown below:
Create a new measure and apply the below-mentioned formula, and click on the check icon
Status color =
VAR a = IF(SELECTEDVALUE('Products Ordered'[Product Status]) = "Cancelled", True, False)
VAR b = IF(SELECTEDVALUE('Products Ordered'[Product Status]) = "Delivered", True, False)
VAR c = IF(SELECTEDVALUE('Products Ordered'[Product Status]) = "Shipped", True, False)
VAR d = IF(SELECTEDVALUE('Products Ordered'[Product Status]) = "Pending", True, False)
RETURN

SWITCH(
TRUE(),
a , "Red",
b, "Green",
c, "pink",
d," Orange")
Where,
- Status color = Measure Name
- a,b,c,d = variable names
- SELECTEDVALUE,SWITCH = Function Names
- Products Ordered = Table Name
- Product Status = Column Name
- Drag and drop the created measure value into the table visual.
- Select the Format Visual under the Visualisation pane, and Expand Cell Elements under the Visual tab (highlighted in Red):
- Enable the background color and click on the Fx icon as shown below:
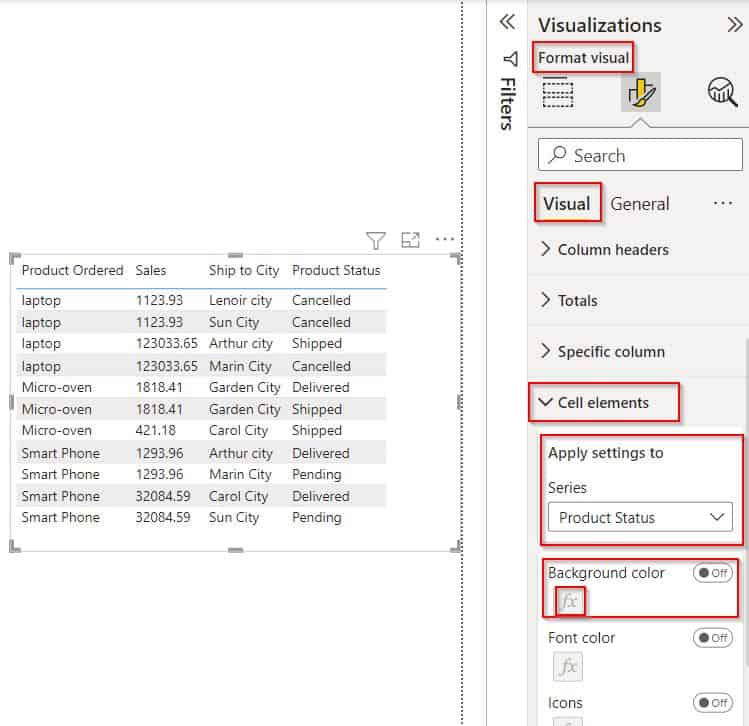
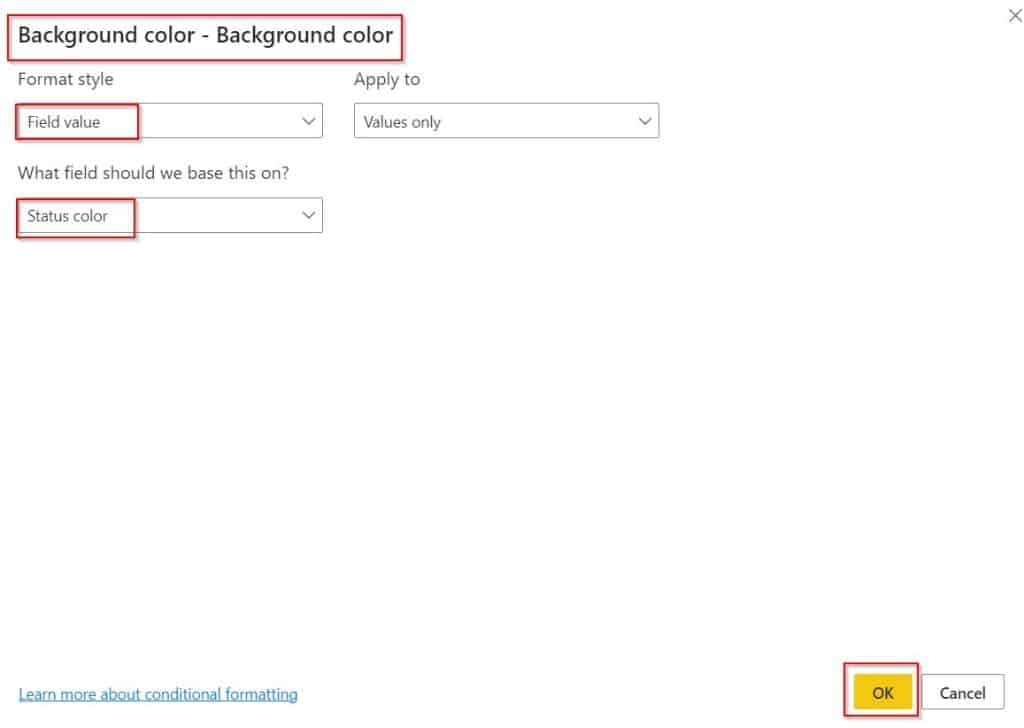
Now in the conditional formatting for background color, select the Format by as Field value, select the Apply to as Value only, and select the measured field that we have created. Click on OK.
The screenshot below shows that the text color has been changed based on the value.
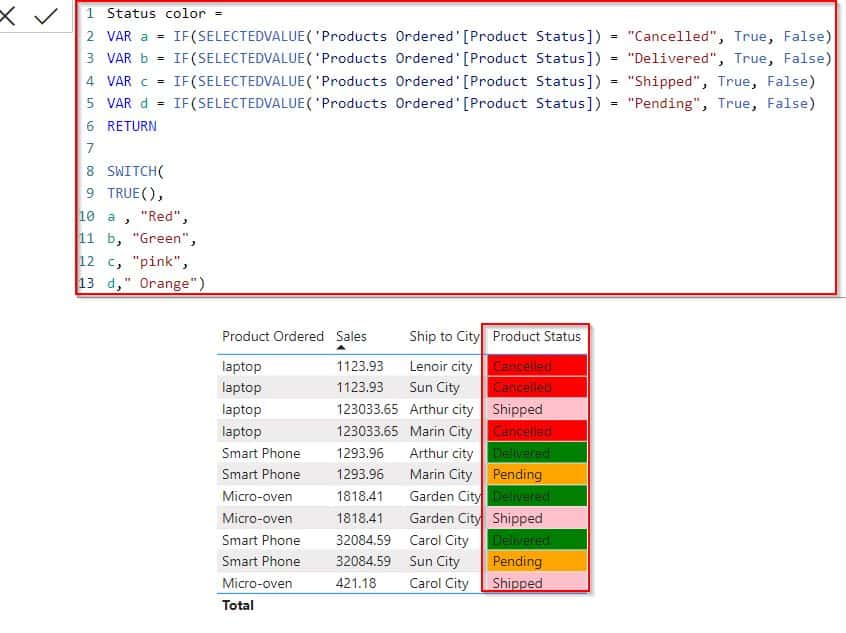
This is how to change the background color based on the text value in Power BI.
Power BI conditional formatting based on text measure
Here we will see how we can apply conditional formatting based on the text measure in a Power BI Matrix visual.
- Load data into the Power bi desktop, and then Select the Matrix visual from visualization.
- In the row section drag and drop the Products ordered and Ship to city fields. In the same way, in the column section drag and drop the Product status field as shown below:
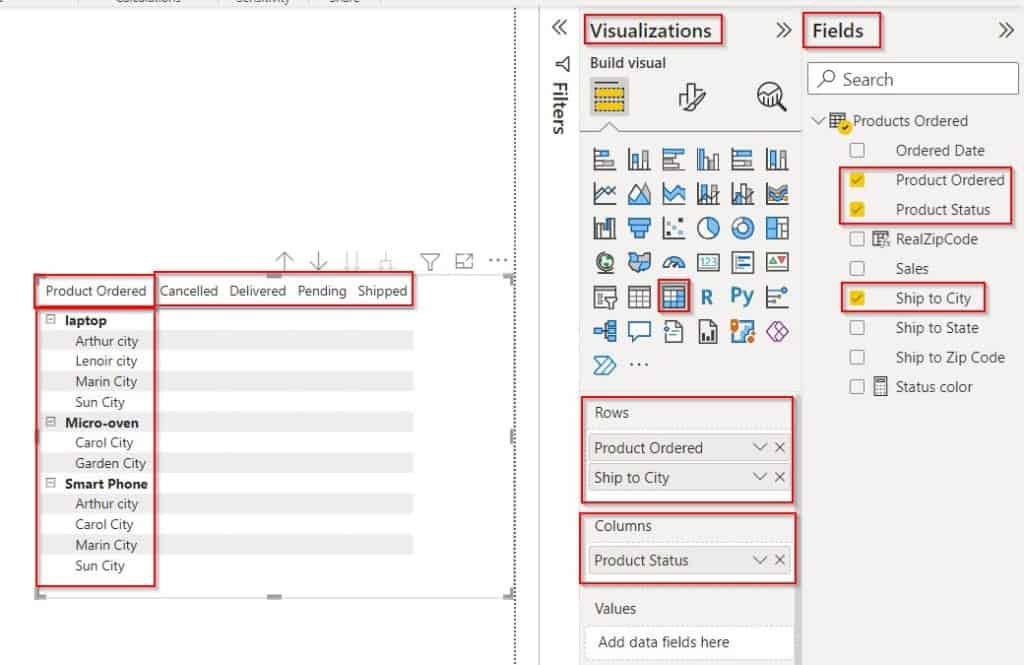
Create a new measure under the modeling tab and use the below-mentioned formula
Status color =
SWITCH(
TRUE(),
SELECTEDVALUE('Products Ordered'[Product Status])="Cancelled", "#FF0000",
SELECTEDVALUE('Products Ordered'[Product Status])="Delivered","#008000",
SELECTEDVALUE('Products Ordered'[Product Status])="Shipped","#FF00FF",
SELECTEDVALUE('Products Ordered'[Product Status])="Pending","#FFFF00","#A52A2A")
Where,
- Status color = Measure Name
- SELECTEDVALUE,SWITCH = Function Names
- Products Ordered = Table Name
- Product Status = Column Name
- Now drag and drop the created measure value into the matrix visual value section field.
- And then Choose the Format Visual under the Visualisation pane, Expand Cell Elements under the Visual tab (highlighted in Red) Enable the background color and click on the Fx icon as shown below:
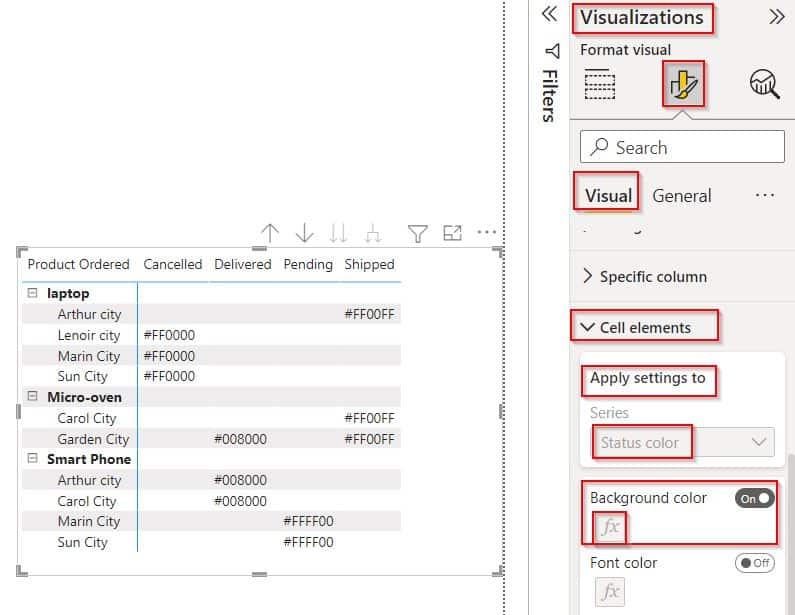
In the conditional formatting for background color, select the Format by as Field value, select the Apply to as Value only, and select the created status color measure value. Click on the OK button.

In the below screenshot, you can see that the matrix visually displays the value based on the conditional formatting applied.
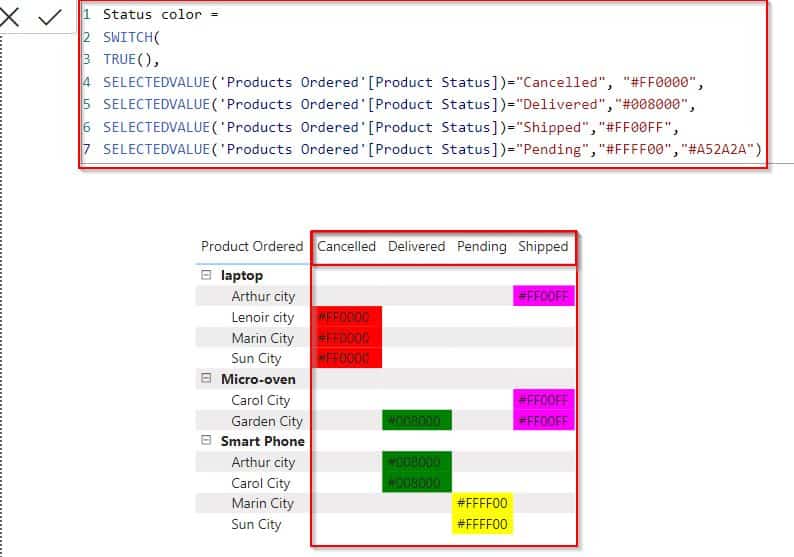
This is how to apply conditional formatting based on the text measure in a Power BI Matrix visual.
Power BI conditional formatting based on text card
Let us see how we can apply conditional formatting to the Power BI card’s visual based on a text value in power Bi,
- In this example, we will use the list slicer to change the card’s visual color based on the text called Products ordered.
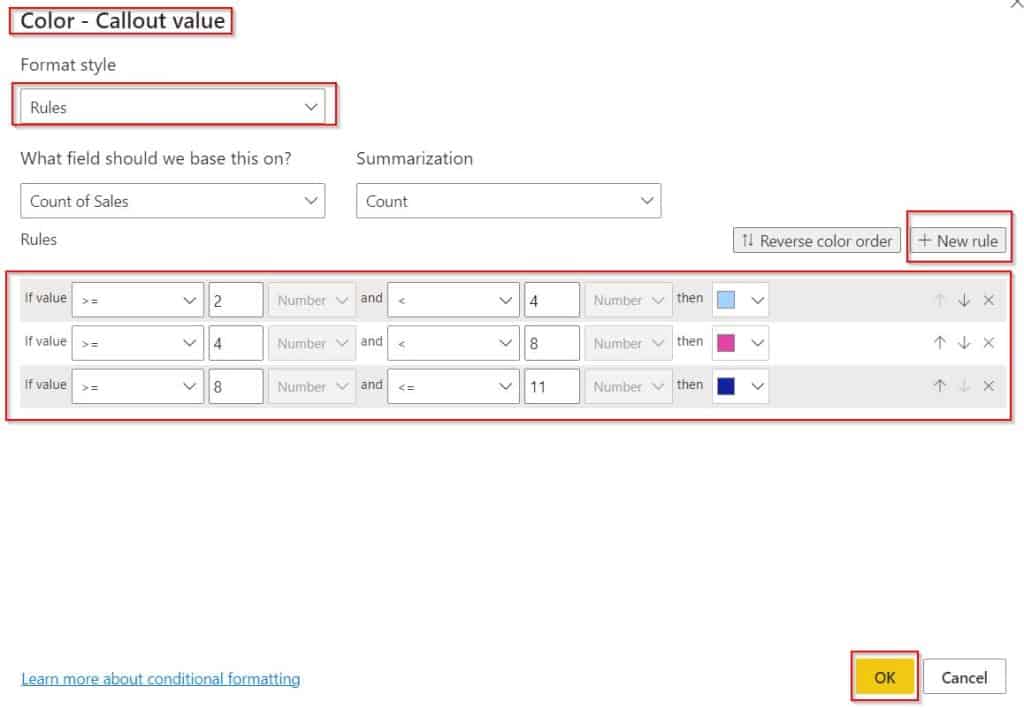
- If the sales count value is greater than or equal to two and less than four then the card value color changes to sky blue.
- If the sales count value is greater than or equal to four and less than or eight then the card value color changes to Pink.
- If the sales count value is greater than or equal to eight and less than or eleven then the card value color changes to Darkblue.
Follow the below steps to change the card color value in Power BI:
- Initially, add the list slicer visual and card visual to the Power BI report canvas.
- In the slicer visual drag and drop the Products ordered field, and in the card visual drag and drop the sales field and change to the count option to display the sales count as below:
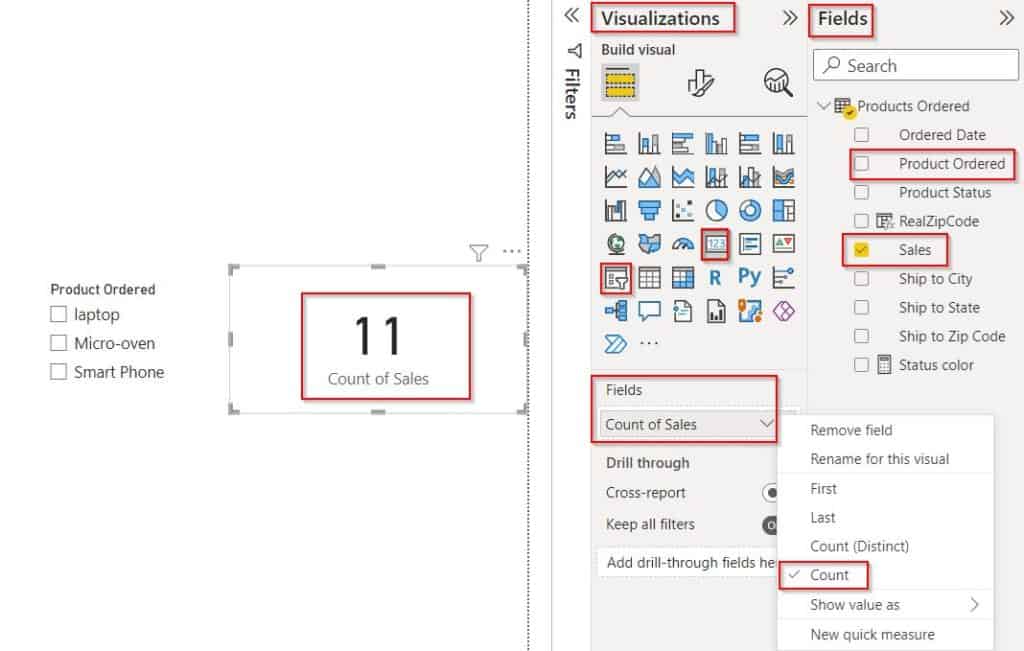
Select the Format Visual under the Visualisation pane, Expand the Callout value under the Visual tab (highlighted in Red), and click on the Fx icon as shown below:
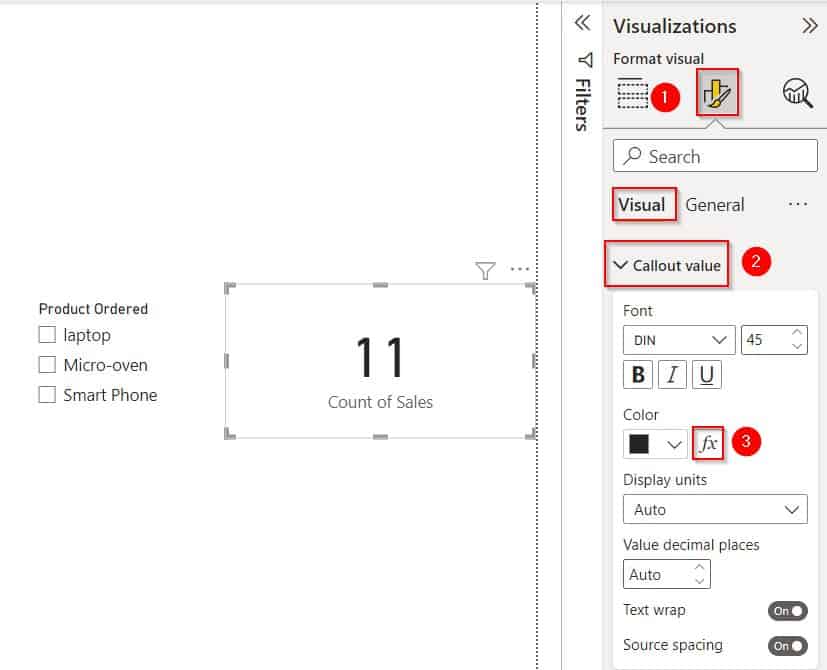
- Now, Select the Format style as Rules and choose the column field value, Now add the rule that you want to apply. Select +New rule to add a new rule condition.
- Add the condition to apply the conditional formatting based on the sales count value.
- Click on the Ok button to display the card visual based on the condition applied.
- In the below screenshot, you can see that the default sales count value is 11, when we select the Micro-oven product from the slicer visual the card visual displays the applied conditional formatting sale count value as 3.
- In the same when we select the laptop product, it displays the total sales value count as 4 based on the condition applied in the conditional formatting.
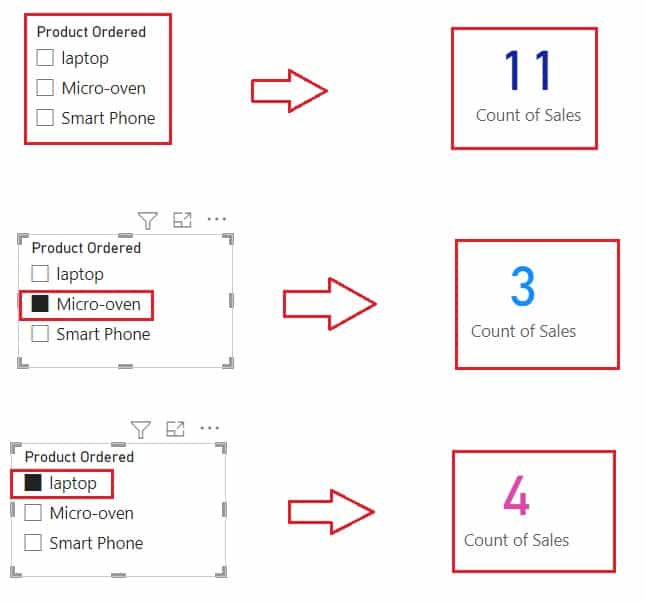
This is how to apply conditional formatting to the Power BI card’s visual based on a text value in power Bi.
Power BI conditional formatting based on text icon
Here we will see how we can add conditional formatting based on text icons in Power BI,
In this example, we will add icons to the text column presented in the table visual in Power BI, Directly it is not possible to achieve this, so we use the power query editor.
Follow the below steps, to add an icon to the text column in Power BI:
Step:1
Load data into the Power Bi desktop and under the Home button select transform data, it will automatically redirect to the power query editor.

Step:2
In the Power Query editor, select Add column -> Conditional column as highlighted below:

Step:3
- In the Conditional column pop-up, enter the column name and add a condition based on the Product status, and use Add clause to add more conditions and click on the Ok button.
- Here I have added if the Product status equals Delivered then the output is 1. In the same way, I have added the remaining Product status values for Cancelled, Shipped, and Pending as highlighted below:
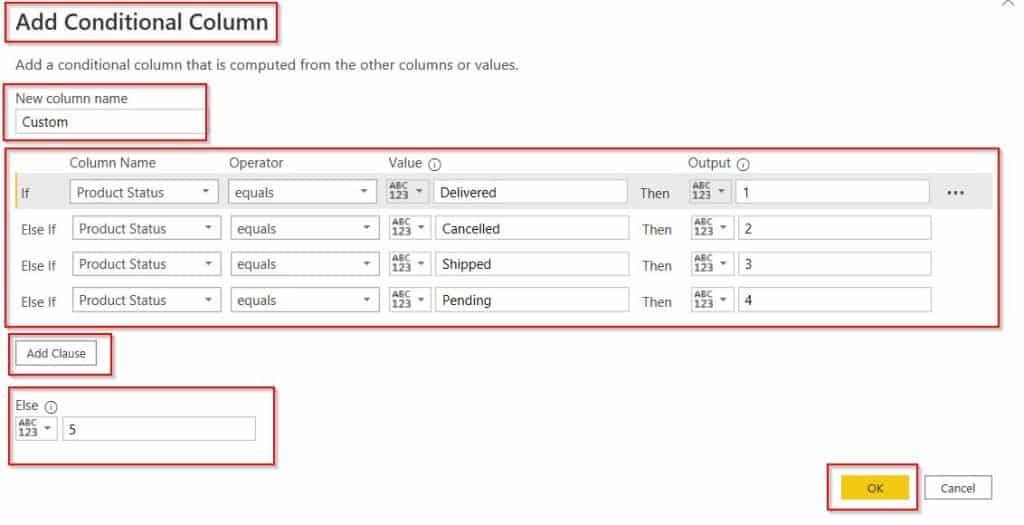
Click the close & apply option under the home tab to save the changes.
= Table.AddColumn(#"Changed Type", "Custom", each if [Product Status] = "Delivered" then 1 else if [Product Status] = "Cancelled" then 2 else if [Product Status] = "Shipped" then 3 else if [Product Status] = "Pending" then 4 else 5)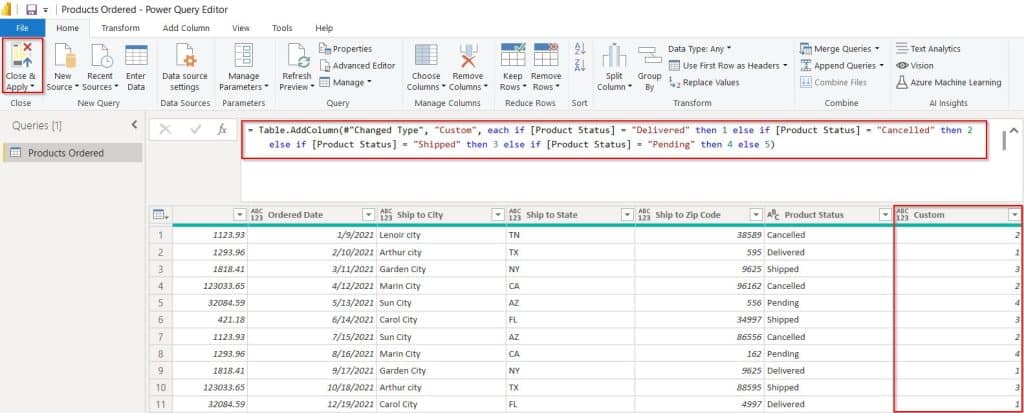
Step:4
In the Power Bi desktop, create a new measure and use the below formula,
Sales Icon = SUM('Products Ordered'[Custom])Where,
- Sales icon = Measure name
- Products Ordered = Table Name
- Custom = Newly added column
In the same way, create another measure to add icons for the text field in the power bi table visual.
Status Icon =
 SWITCH(
     TRUE(),
     [Sales Icon]=1,"CircleHigh",
     [Sales Icon]=2,"CircleLow",
     [Sales Icon]=3,"CircleMedium",
    [Sales Icon]=4,"4CircleMedium2","TriangleMedium"
 )
Where,
- Status icon = Measure name
- SWITCH = Function Name
- Sales Icon = Existing Measure Name
Step 4:
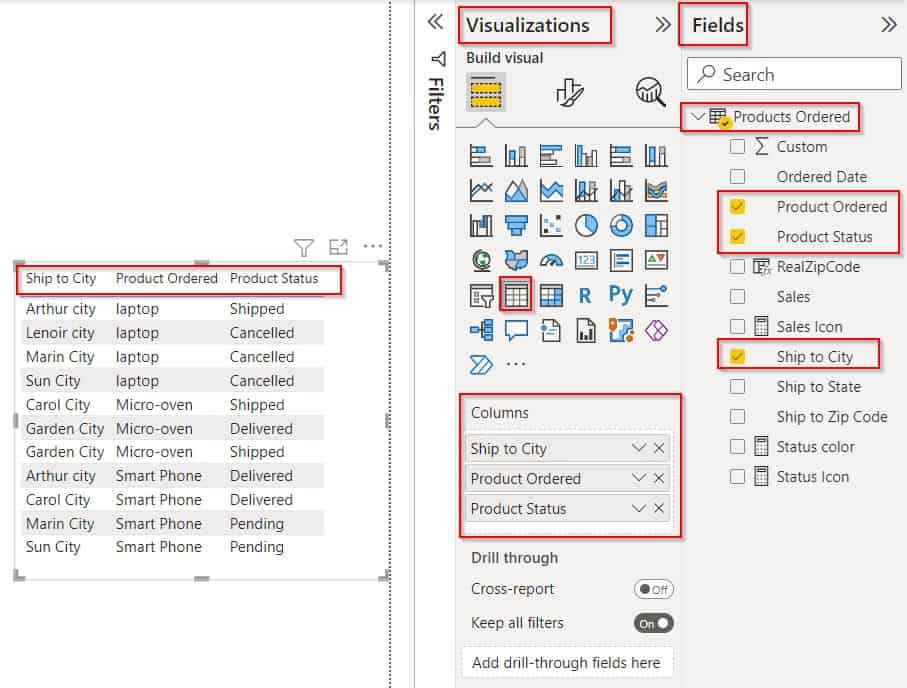
- Select the Table visual, In the column field drag and drop the Products ordered, Ship to city, and Product Status fields as below:
Step:5
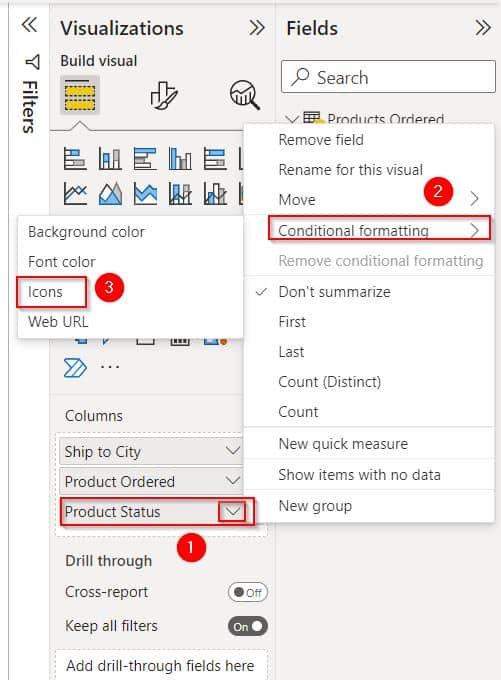
Expand Product status -> Conditional formatting -> Icons as highlighted below:
Step:6
In the Icons popup window, select the format style as Field value, choose the created measure field called Status icon, and click on the Ok button.
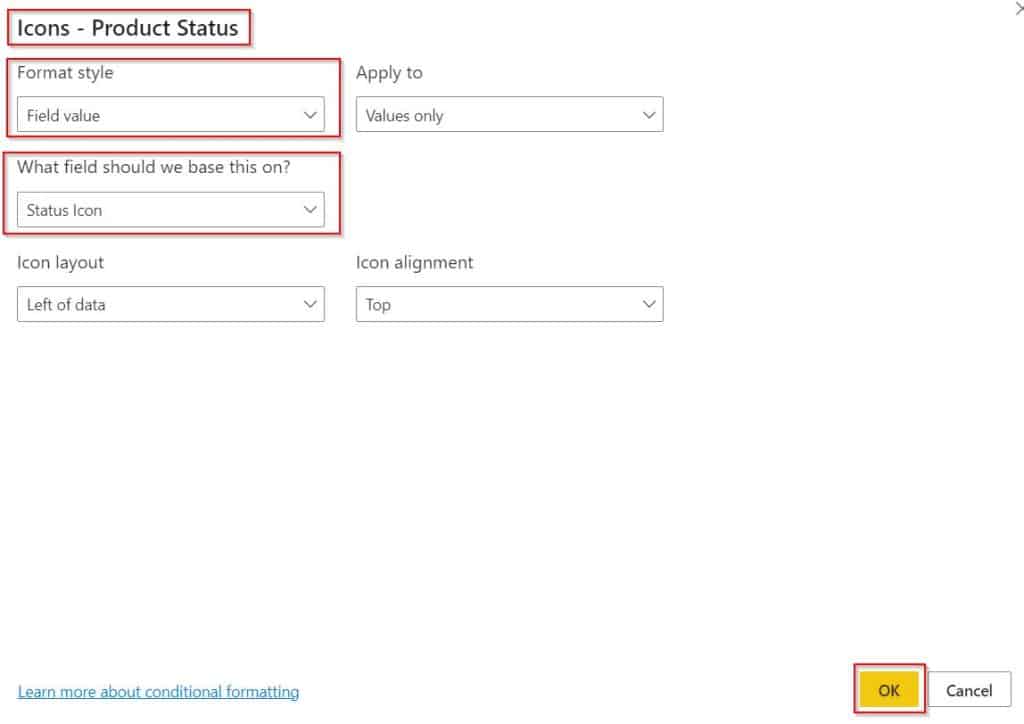
In the below screenshot, you can see that the icons are added to the conditional formatting based on text icons in Power BI.
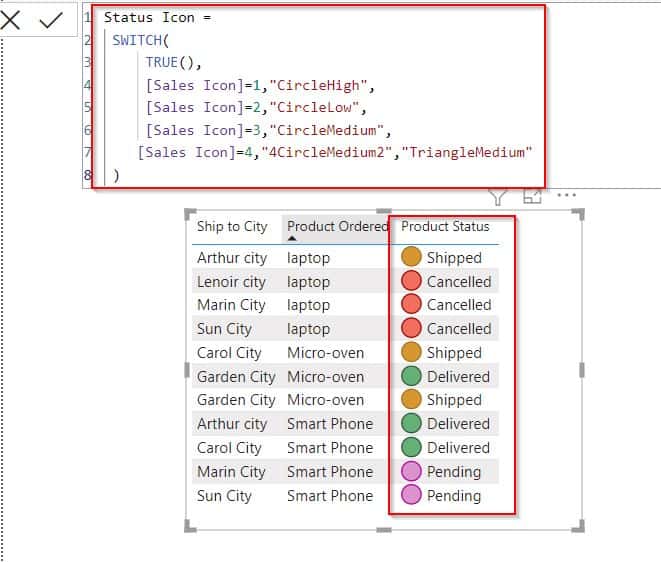
This is how to add conditional formatting based on text icons in Power BI.
Power BI conditional formatting background based on text
Let us see how we can apply conditional formatting background based on text in Power Bi,
In this example, we will add conditional formatting background based on text using the power query editor.
- Load data into the Power Bi desktop and under the Home button select transform data, it will automatically redirect to the power query editor.
- In the Power Query editor, select Add column -> Conditional column, In the Conditional column pop-up, enter the column name and add a condition based on the Product status, and use Add a clause to add more conditions and click on the Ok button as below:

Select the Table visual, In the column field drag and drop the Products ordered, Ship to city, and Product Status fields as below:

- Select the Format Visual under the Visualisation pane, and Expand Cell Elements under the Visual tab (highlighted in Red):
- Enable the background color and click on the Fx icon as shown below:
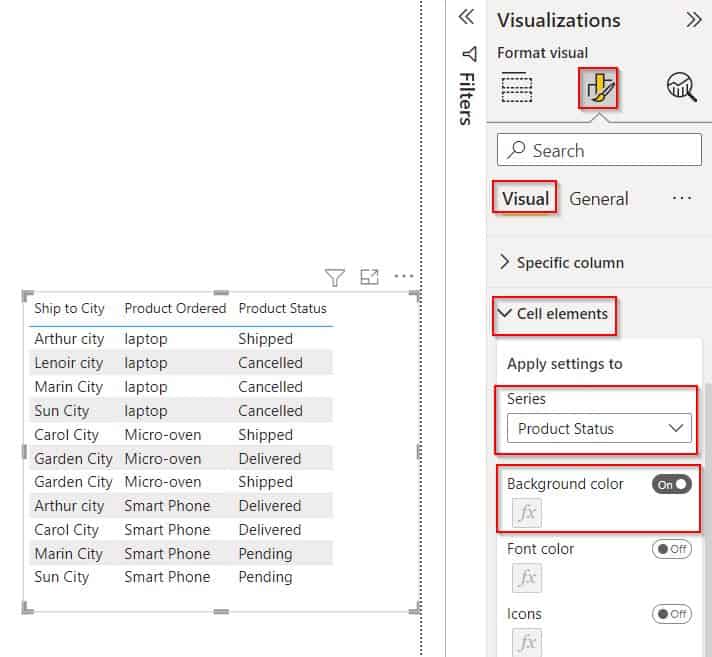
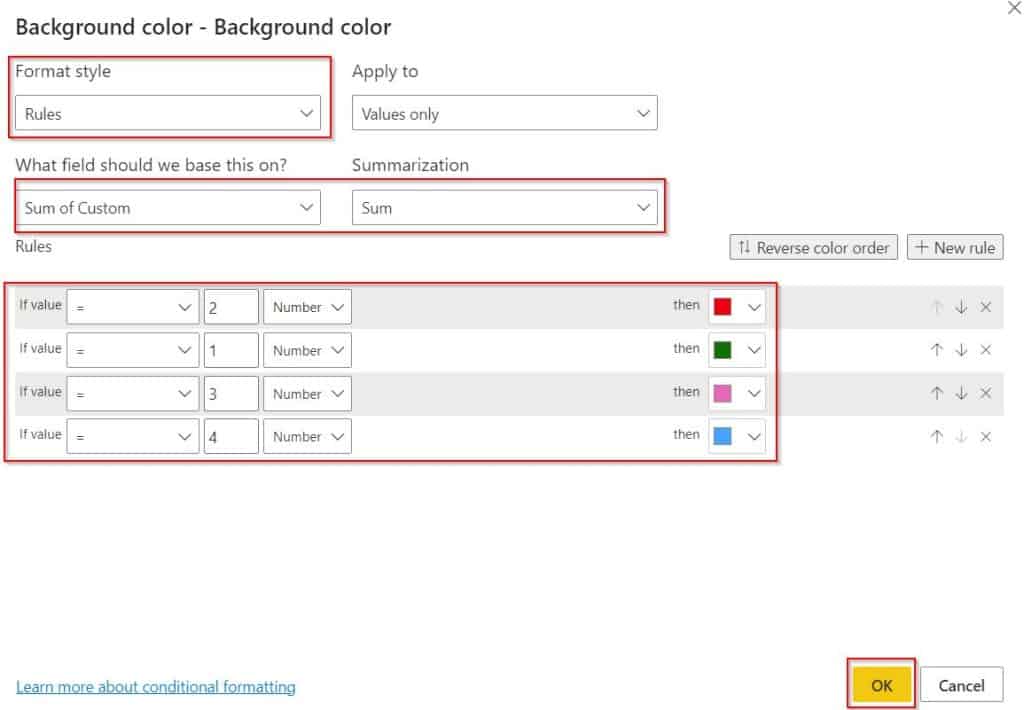
Now in the conditional formatting for background color, select the Format by as Rules , select the Apply to as Value only, and select the measure we have created. Click on OK.
In the below screenshot, you can see that the conditional formatting has been applied background based on the text.
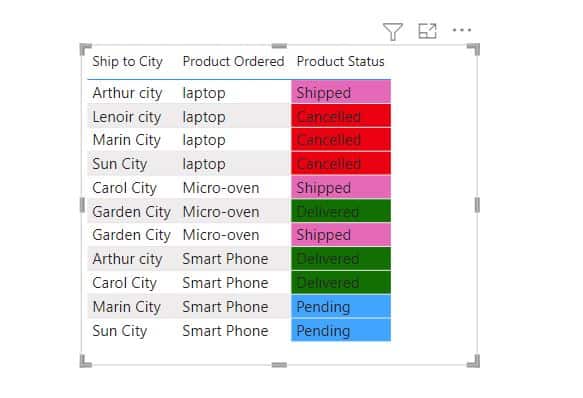
This is how to apply conditional formatting background based on text in Power Bi.
Power BI conditional formatting based on text does not count
Let us see how we can apply conditional formatting based on text not count in Power BI.
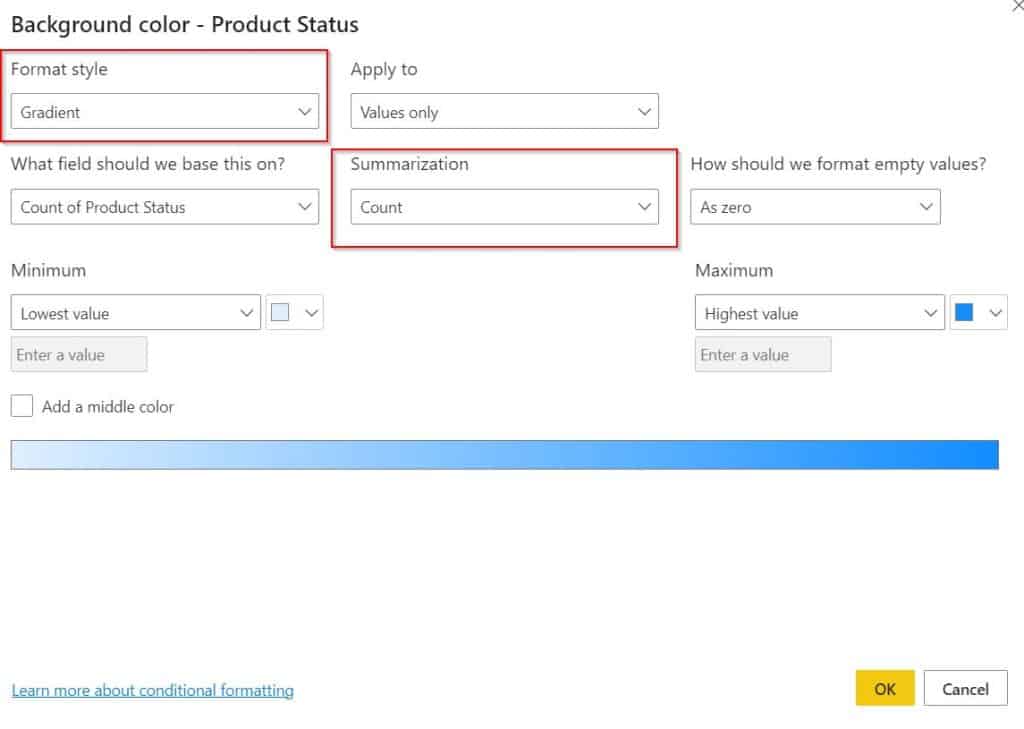
In this example, apply conditional formatting based on text not count and we can also see by default when we select any field to apply condition formatting it displays the count summarization as highlighted below:
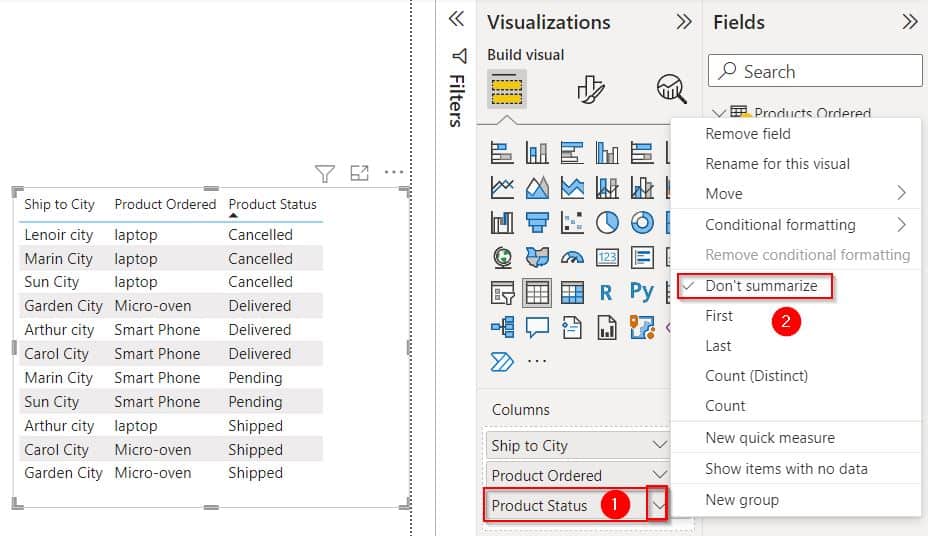
Expand the Product status column and select don’t summarize as below:
Create a new measure under the modeling tab and use the below-mentioned formula
Product Status color =
SWITCH(
TRUE(),
SELECTEDVALUE('Products Ordered'[Product Status])="Cancelled", "#FF0000",
SELECTEDVALUE('Products Ordered'[Product Status])="Delivered","#008000",
SELECTEDVALUE('Products Ordered'[Product Status])="Shipped","#FF00FF",
SELECTEDVALUE('Products Ordered'[Product Status])="Pending","#FFFF00","#A52A2A")
Where,
- Product Status color = Measure Name
- SELECTEDVALUE,SWITCH = Function Names
- Products Ordered = Table Name
- Product Status = Column Name
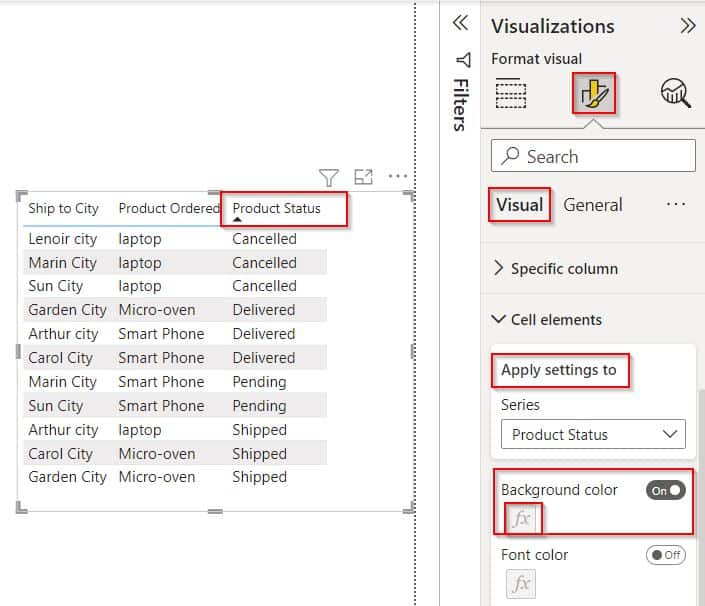
- And then Choose the Format Visual under the Visualisation pane, Expand Cell Elements under the Visual tab (highlighted in Red) Enable the background color and click on the Fx icon as shown below:
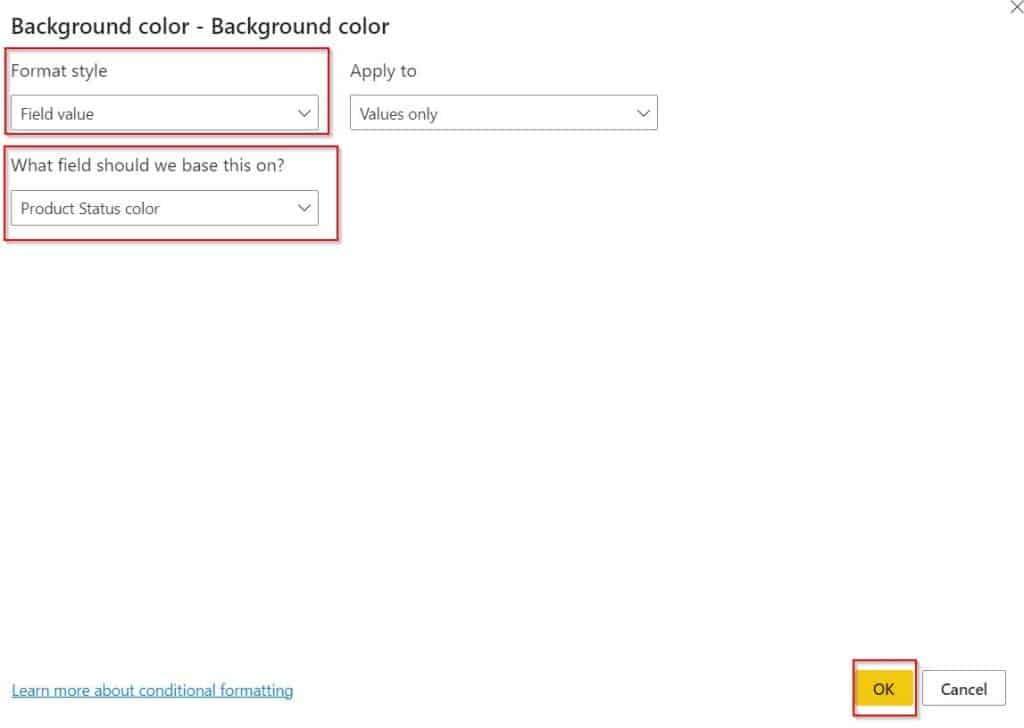
Now in the conditional formatting for background color, select the Format by as Field value, so that we cannot see the count option. select the Apply to as Value only, and select the measure we have created. Click on OK.
In the below screenshot, you can see that the product status column displays the value by applying conditional formatting.
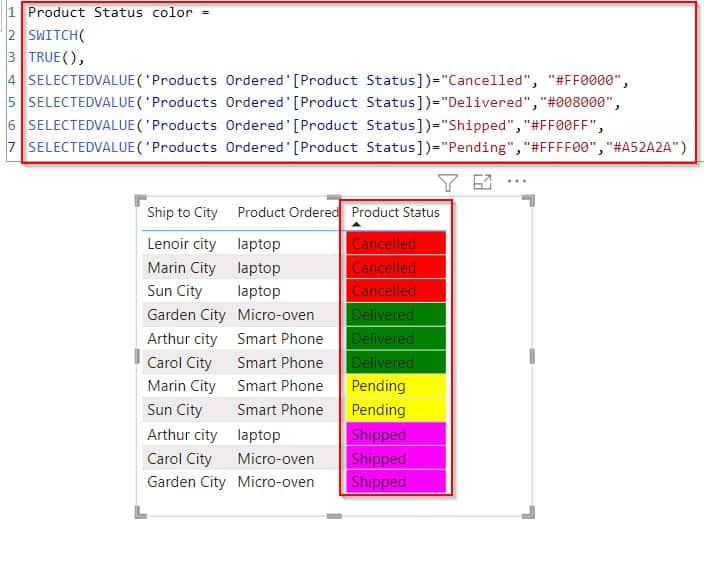
This is how to apply conditional formatting based on text not count in Power BI.
In this Power BI tutorial, we have learned how to apply conditional formatting based on a text value in Power BI with different examples. In addition, we also covered the below-mentioned topics:
- Power BI conditional formatting based on text measure
- Power BI conditional formatting based on a text card
- Power BI conditional formatting based on text icon
- Power BI conditional formatting background based on text
- Power BI conditional formatting based on text does not count
You may like the following Power BI tutorials:
- Power BI Switch Multiple Conditions
- Power BI Month over Month Change
- Calculate Percentage of Rows in Power BI
- Power BI Zip Code Starting With 0
- Concatenate Text and Number in Power BI
- Power BI Table Conditional Formatting
I am Bijay a Microsoft MVP (10 times – My MVP Profile) in SharePoint and have more than 17 years of expertise in SharePoint Online Office 365, SharePoint subscription edition, and SharePoint 2019/2016/2013. Currently working in my own venture TSInfo Technologies a SharePoint development, consulting, and training company. I also run the popular SharePoint website EnjoySharePoint.com