In this Power Bi tutorial, we will learn how to calculate month over month change in Power BI using the Power BI DAX expression. In addition, we will also cover the below topics:
- Power BI Month-over-Month Change Quick Measure
- Power BI Month over Month Change card
- Power BI Month over Month Percentage Change
What is a month-over-month calculation in Power BI?
In Power Bi, Month over a month means comparing the current month’s value with the Previous or Prior month’s value.
For example, In the below screenshot, you can see that the Power Bi report displays the Total Sales value for the current Month and the Previous Month’s Value in Power BI.
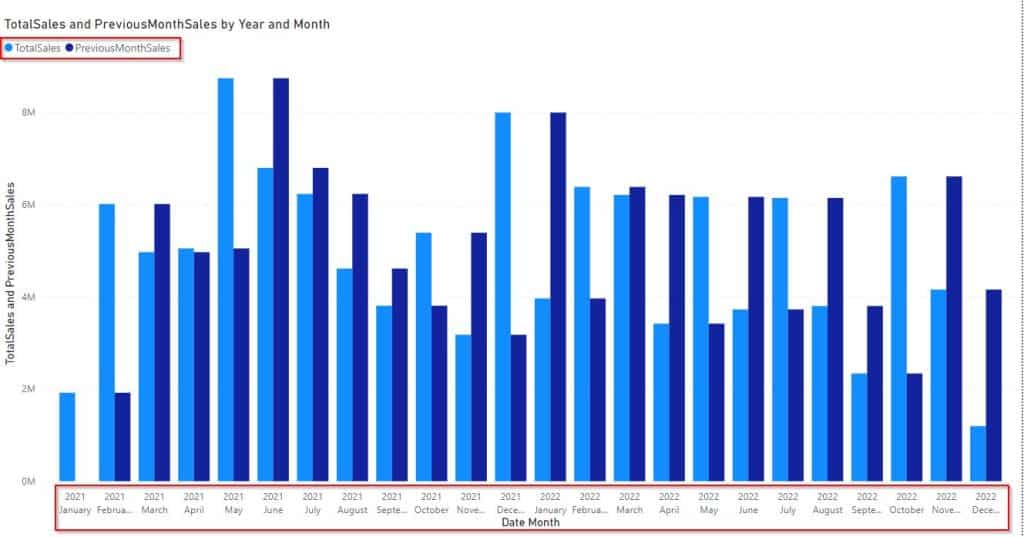
In the following, we will see how to calculate Month over Month using the DAX expression in Power BI.
Power BI Month-over-Month Change
Let us see how we can calculate Month over Month change using the Power Bi DAX function in Power BI.
In the following, we will see how to calculate the Month Over Month value by using the financials excel sheet as source data.
To achieve this follow the below steps:
Step :1
- Log in to the Power Bi desktop and use the get data option to load data. We will use the Power Bi ParallelPeriod function in DAX to calculate the Month over Month change in Power BI.
- We will create two measure values to calculate the total sales value and the Previous Month’s sales value.
- Click on the New measure under the modeling tab and use the below-mentioned formula to calculate the total sale value.
TotalSales = SUM(financials[ Sales])Where,
- TotalSales = New Measure name
- financials = Table Name
- Sales = Column Name
Step:2
In the same way, add another measure and apply the below formula in it to find the previous month’s value.
PreviousMonthSales = CALCULATE([TotalSales],PARALLELPERIOD(financials[Date].[Date],-1,MONTH))Where,
- PreviousMonthSales = New Measure name
- TotalSales = Existing Measure Name
- financials = Table Name
- Date= Column Name
- PARALLELPERIOD = Function Name
Step:3
Select the Cluster column chart visual from the visualizations, In the x-axis field, drag-drop Year and Month, and In Y-axis drag-drop the Created measure values are in it as highlighted below:
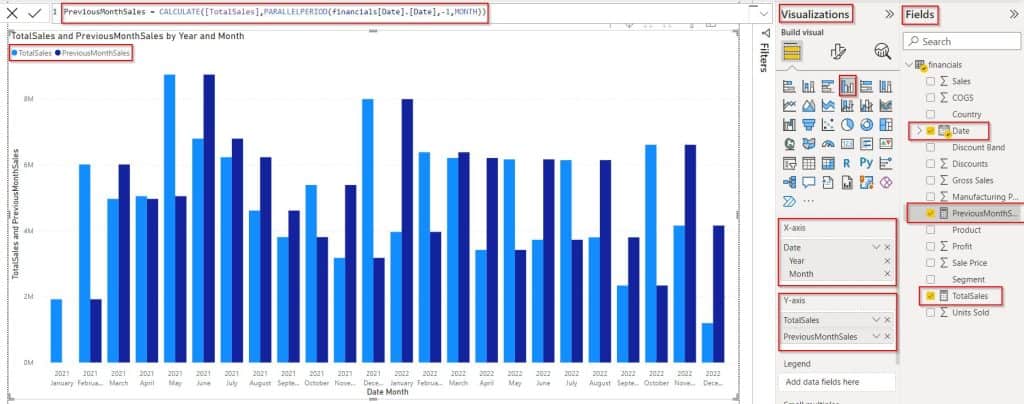
Step:4
For a clear view, we can select a table visually and drag and drop the fields and created measure fields in it as below:
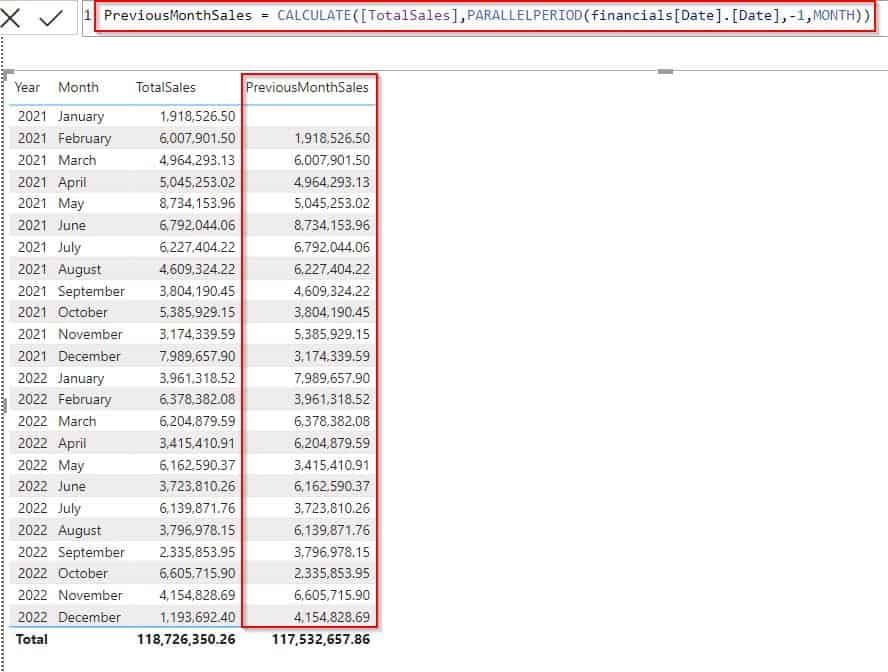
This is how to calculate Month over Month change using the Power Bi DAX function in Power BI.
Read Power BI Percentage of Total by Month
Power BI Month over Month Percentage Change
Let us see how we can calculate the percentage change month over month in Power BI,
In this example, first, we will find the difference value of month-over-month change and we will use the Power Bi Divide function to find the percentage value.
Open the Power Bi desktop and load data into it, Click on the New measure under the modeling tab and use the below-mentioned formula to calculate the total sale value.
TotalSales = SUM(financials[ Sales])Where,
- TotalSales = New Measure name
- financials = Table Name
- Sales = Column Name
In the same way, add another measure and apply the below formula in it to find the previous month’s value.
PreviousMonthSales = CALCULATE([TotalSales],PARALLELPERIOD(financials[Date].[Date],-1,MONTH))Where,
- PreviousMonthSales = New Measure name
- TotalSales = Existing Measure Name
- financials = Table Name
- Date= Column Name
- PARALLELPERIOD = Function Name
To find the variance difference, create a new measure and apply the below formula in it to find the variance value.
variance = [TotalSales]-[PreviousMonthSales]- variance= Measure Name
- TotalSales, PreviousMonthSales = Existing Measure Names
- Select a table visually and drag and drop the fields and created variance measure fields in it as below:
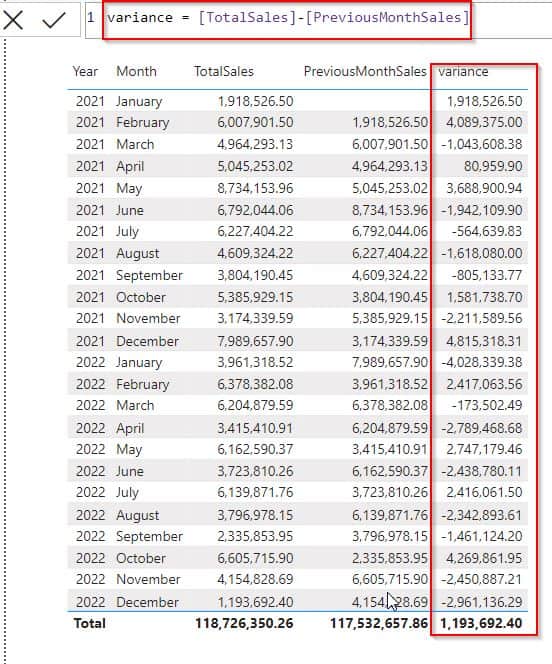
Select another measure and apply the below formula in it to find the Percentage value.
Percentage = DIVIDE([variance],[PreviousMonthSales],0)Where,
- Percentage = Measure Name
- variance, PreviousMonthSales = Existing Measure Names
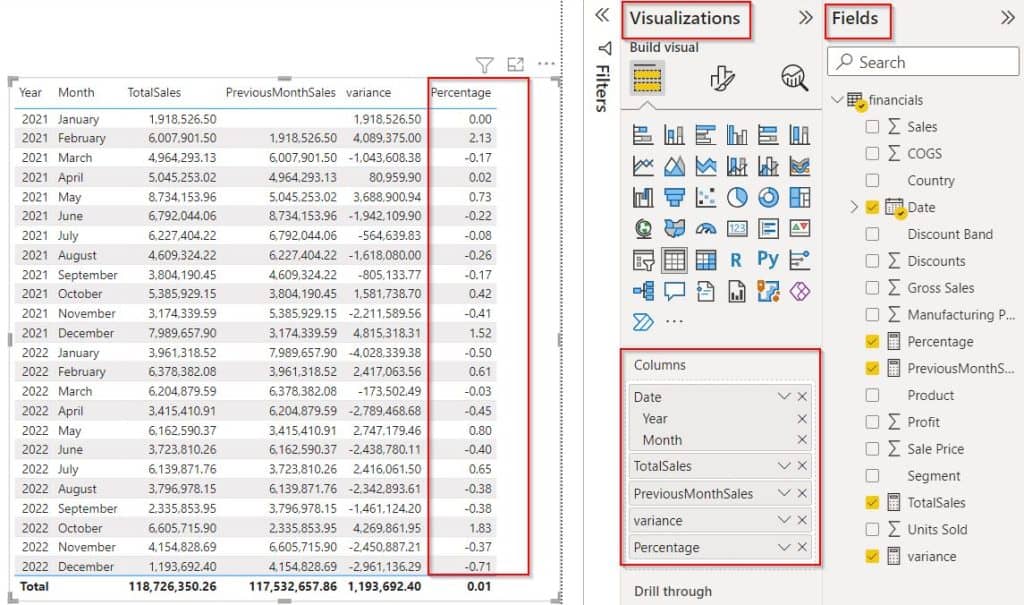
- Select the table visual from the visualization, drag-drop the date fields, and percentage measure value fields into the column section as highlighted below:
- Select the measure and choose Measure tools -> Percentage as highlighted below to change the measure format to percentage.
- In the below screenshot, you can see the table visually displays the Calculate Percentage difference between Two Columns Power BI report.
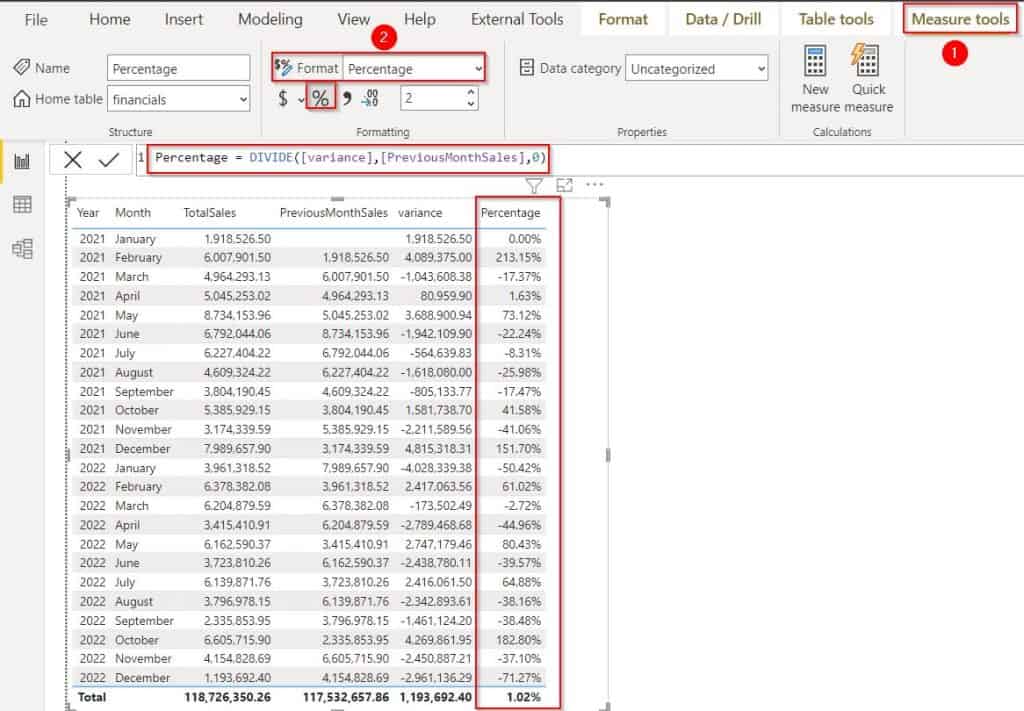
This is how to calculate the percentage change month over month in Power BI
Read Power BI Add Leading Zero to Month
Power BI Month-over-Month Change quick measure
Here we will see how we can calculate the Month Over Month change using Quick Measure in Power BI.
Load data into it Power Bi Desktop, Click on the Quick measure under the modeling tab as highlighted below:

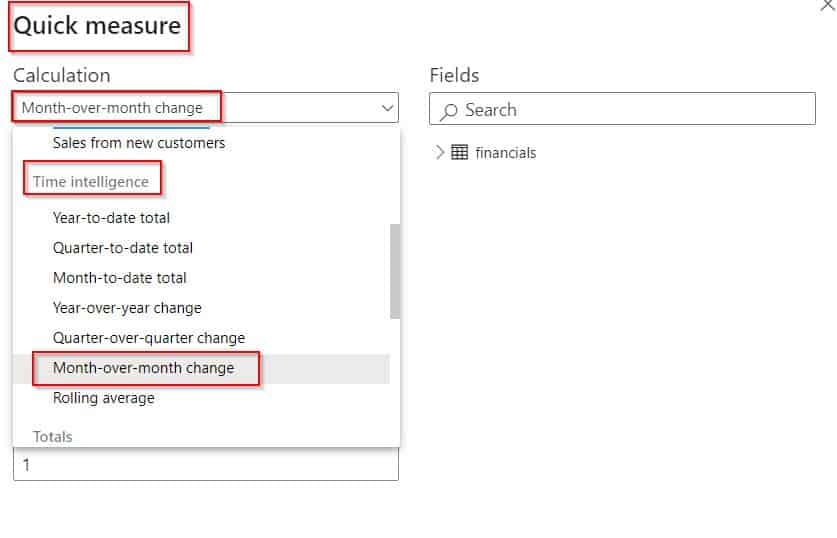
In the Quick Measure pop-up, Select the Month over Month change under the Time intelligence as displayed below:
In the same way, drag and drop the base value and date field from the field section and click on the OK button.
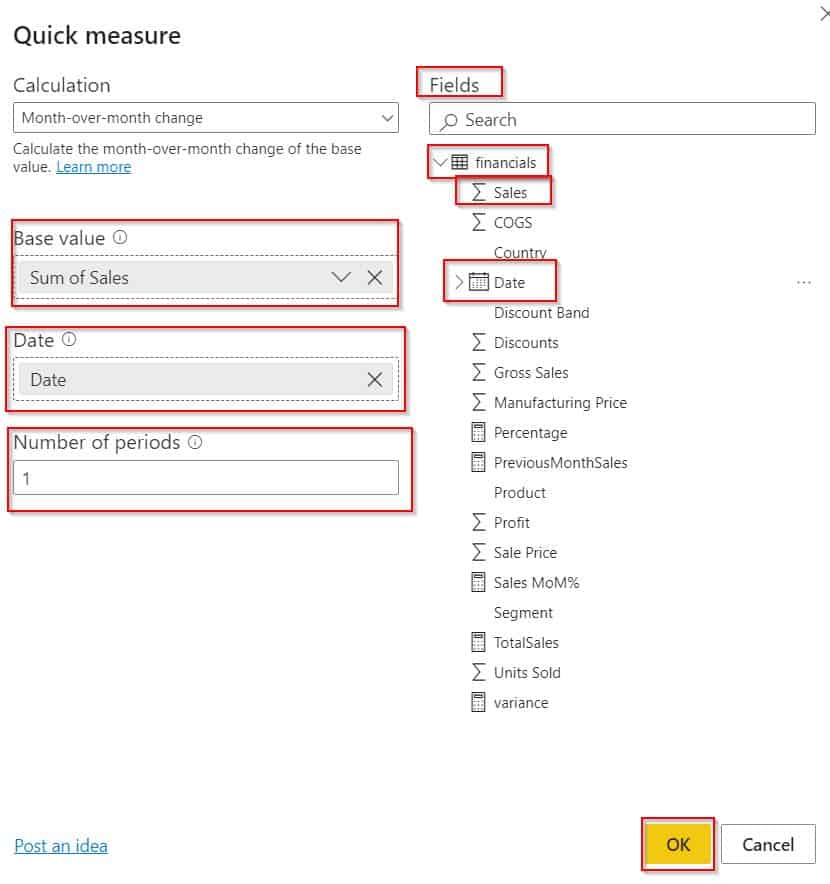
In the below screenshot, you can see that the quick measure automatically creates the DAX formula.
Sales MoM% =
IF(
	ISFILTERED('financials'[Date]),
	ERROR("Time intelligence quick measures can only be grouped or filtered by the Power BI-provided date hierarchy or primary date column."),
	DIVIDE(
		SUM('financials'[ Sales]) - CALCULATE(
			SUM('financials'[ Sales]),
			DATEADD('financials'[Date].[Date], -1, MONTH)
		),
		CALCULATE(
			SUM('financials'[ Sales]),
			DATEADD('financials'[Date].[Date], -1, MONTH)
		)
	)
)- Select the Matrix visual from the visualization, drag and drop the Product field in the row section, and the date field into the Columns section.
- In the Values section, drag and drop the created Quick measure value.
- The screenshot below displays the calculated Month Over Month change in the matrix visual using Quick Measure in Power BI.
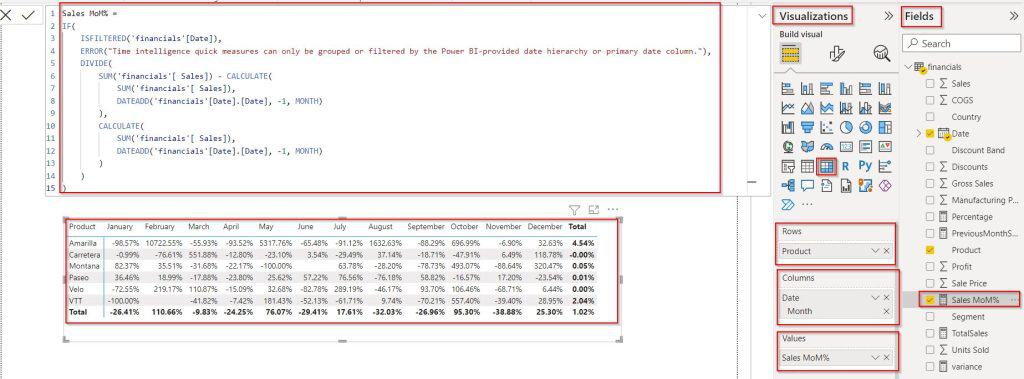
This is how to calculate the Month Over Month change using Quick Measure in Power BI.
Power BI Month over Month Change card
Here we will see how to calculate the Month over Month Change value in the Power BI card visual.
In this example, we will use the two card visuals for total sales and the Previous month’s sale value and we will also use the slicer visual to display year and month value. So based on the slicer selection the card visually displays the data value accordingly.
To achieve this follow the below steps:
- Open and load the data into the Power Bi Desktop, and calculate the total sales value and the previous month’s sales values.
- You can follow n the Previous heading to calculate the values, that I have calculated for the total sale value and the previous month’s value using the DAX expression.
- Select two card visuals from the visualization and drag-drop the Total sales value in one visual and the Previous month’s calculated measure value in another card visual as below:
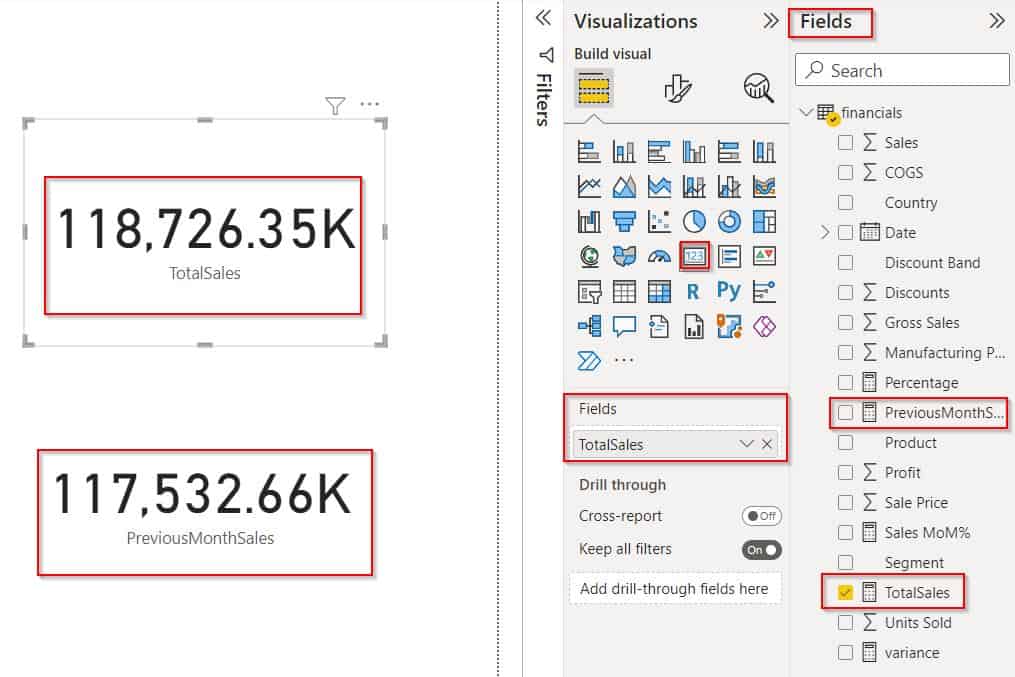
- Now select the slicer visual, to filter the total sale value and the previous month’s value based on the slicer selection of the Year and Month.
- Simply drag and drop the date field from the fields pane to the slicer visual, and from the date hierarchy select the Year and Month fields as below:
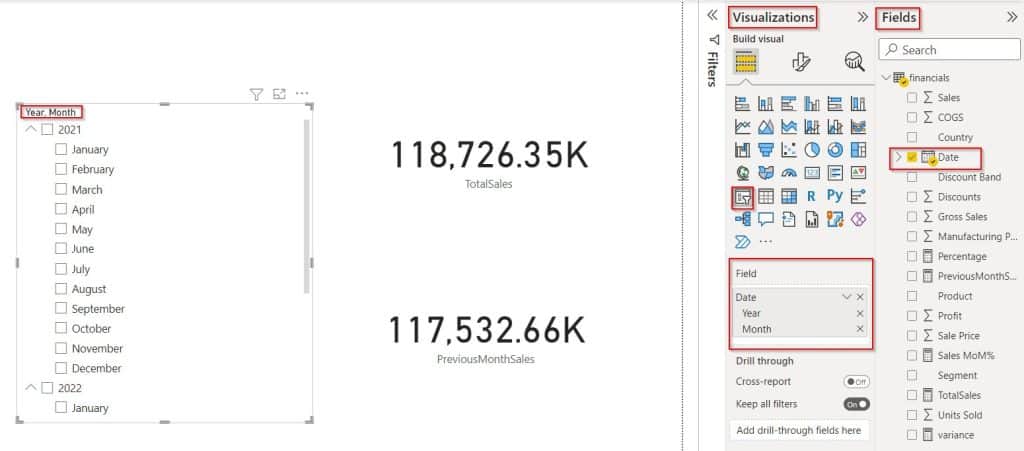
- Select the any of month values from the slicer visual, it filters and displays the data in the card visual based on the slicer selection.
- In the below screenshot, you can see that it displays the sales value and the previous month’s sales value based on the slicer selection. For example, let’s say the Total sale car visual displays the value for April month and the Previous month’s card visual displays the value for March month.
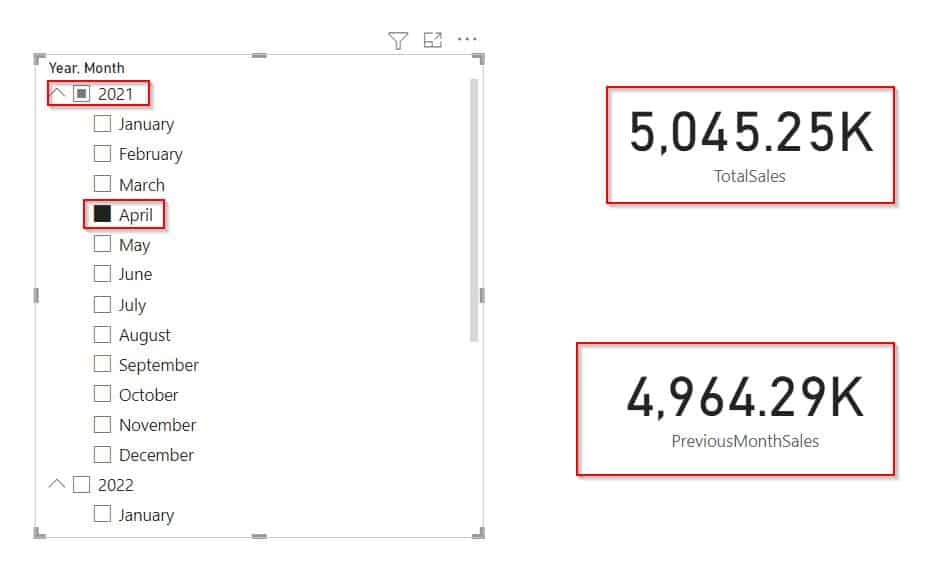
In the same way, if we select the month of October from the slicer visual, then the total sales card visual displays the October sales value, and the Previous month’s card visual displays the value for September month as below:
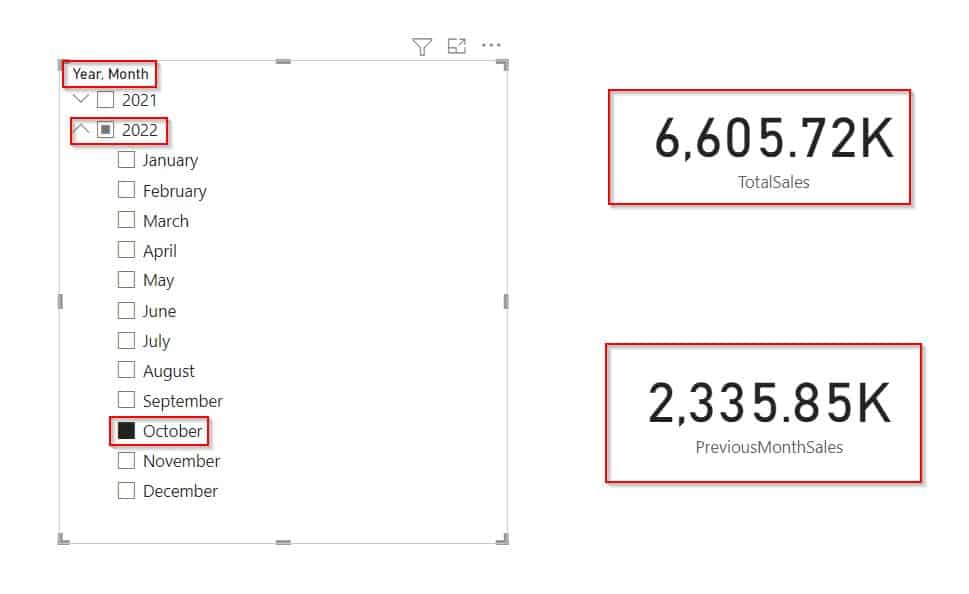
This is how to calculate the Month over Month Change value in the Power BI card visual.
In this Power Bi tutorial, we have learned how to calculate Month over Month changes in Power BI using the Power BI DAX expression. In addition, we also covered the below topics:
- Power BI Month-over-Month Change Quick Measure
- Power BI Month over Month Change card
- Power BI Month over Month Percentage Change
You may also like the following power bi tutorials:
- Power BI Date Slicer By Month
- Get Month Name from Month Number in Power BI
- Get Current Month Sales Report using Power BI Measure
I am Bijay a Microsoft MVP (10 times – My MVP Profile) in SharePoint and have more than 17 years of expertise in SharePoint Online Office 365, SharePoint subscription edition, and SharePoint 2019/2016/2013. Currently working in my own venture TSInfo Technologies a SharePoint development, consulting, and training company. I also run the popular SharePoint website EnjoySharePoint.com