In this Power BI tutorial, We will discuss how to use the Power BI Date slicer by month and how to work with the Power BI Date slicer by month and year.
Additionally, We will cover the topics below:
- Power BI Date slicer date hierarchy month
- Power BI Date slicer last 12 months
- Power BI Date slicer default to the current month
Power BI date slicer by month
Let us see how we can filter the value presented in the power bi report based on the date slicer by month in Power Bi.
In this example, we are going to use the sales table data, to filter data based on the date slicer visual by month in Power Bi.
- Open the Power Bi desktop and load data using the get data option.
- Once the data has been loaded, Select the slicer icon presented in the visualization pane, and in the slicer visual, drag and drop the Order Date field and choose the month option.
- In the same way, select the stacked column chart and drag and drop the sales and Product name fields from the field pane as below:
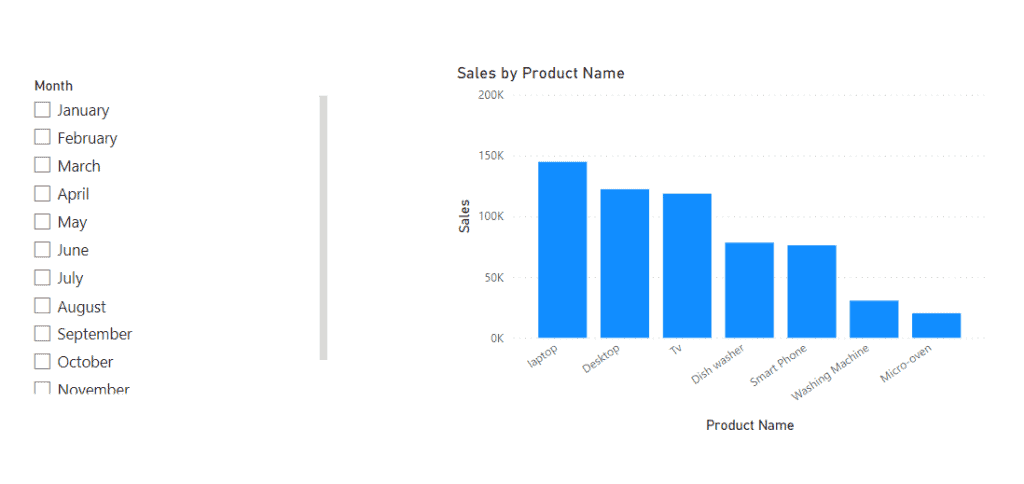
Now select any of the months from the date slicer by month. Based on the filtered month it displays the Products in the stacked bar chart.
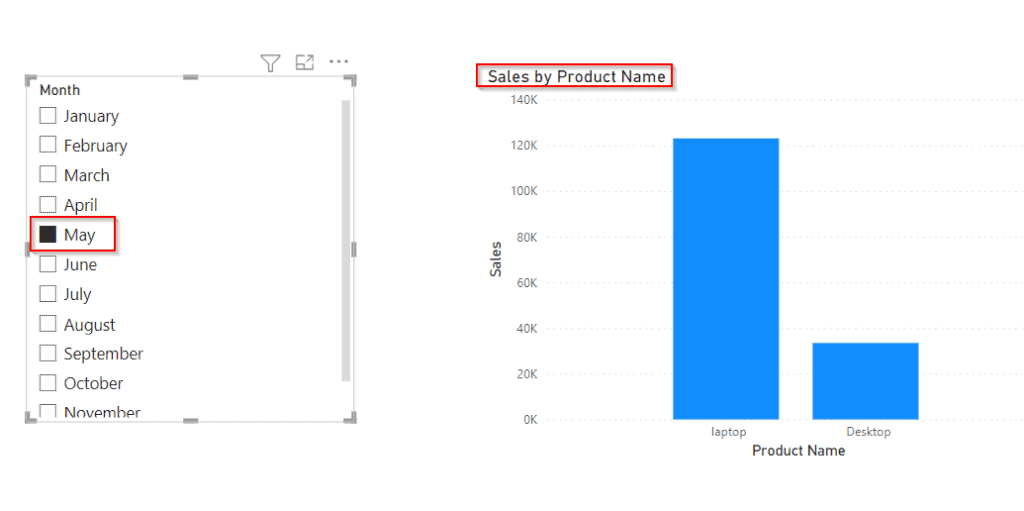
In the same way, if we select any other month it displays the sales value along with the product name for the selected month.
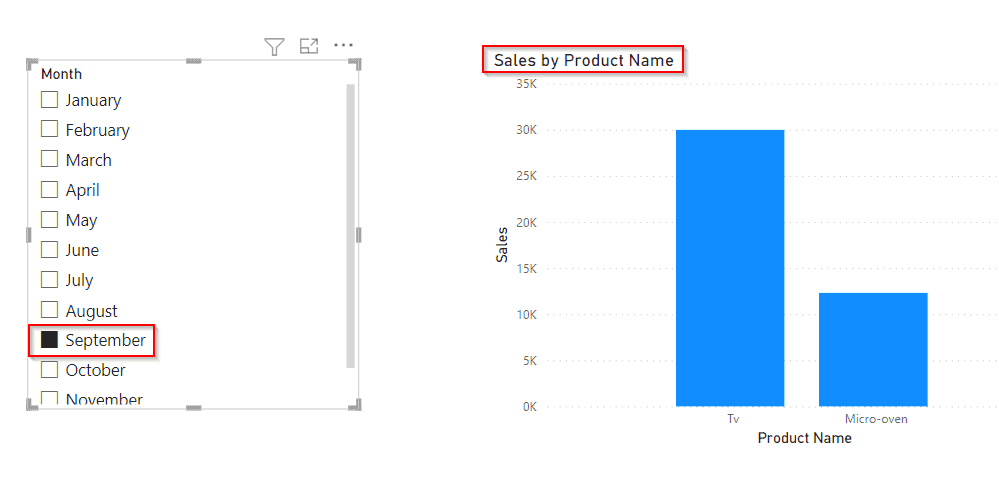
This is how to filter the value presented in the power bi report based on the date slicer by month in Power Bi.
Power BI date slicer by month year
Here we will see how we can filter the value presented in the power bi report based on the date slicer by month and year in Power Bi.
- Open the Power Bi desktop and load data using the get data option.
- Once the data has been loaded, Select the slicer icon presented in the visualization pane, and in the slicer visual, drag and drop the Order Date field and choose the month and year options.
- In the same way, select the stacked column chart and drag and drop the sales and Product name fields from the field pane as below:
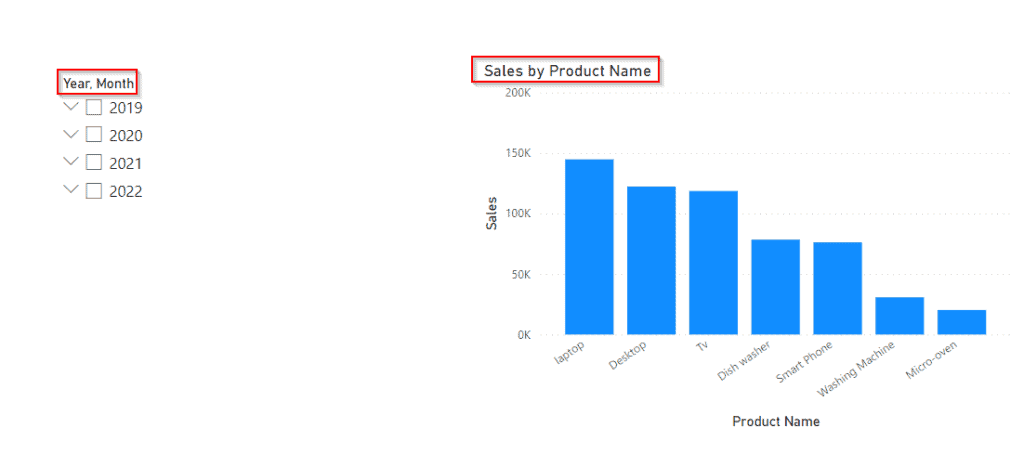
Now choose any of the Years and Months from the date slicer by month and year. Based on the filtered month and year it displays the Products and sales value in the stacked bar chart.
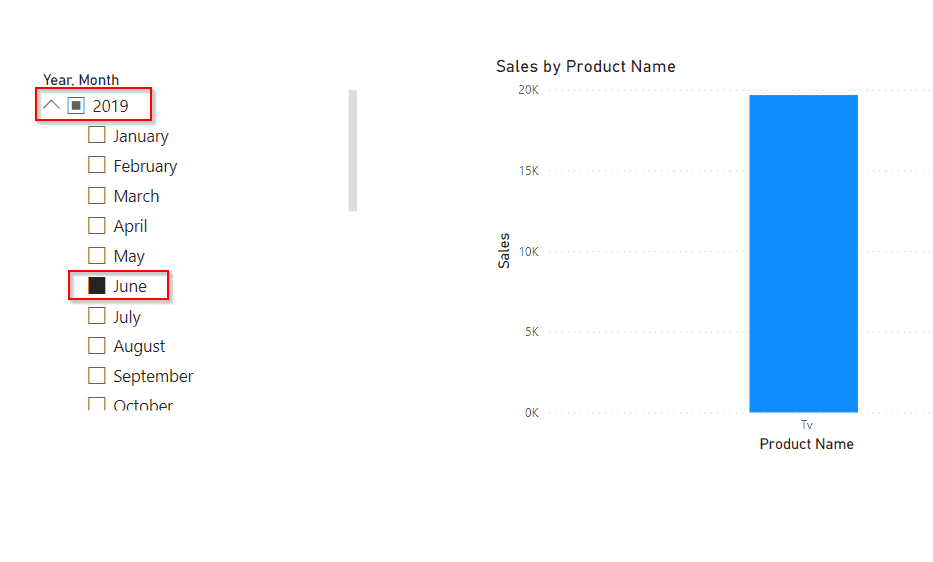
In the same way, if we select any other month and year it displays the sales value along with the product name for the selected year and month.
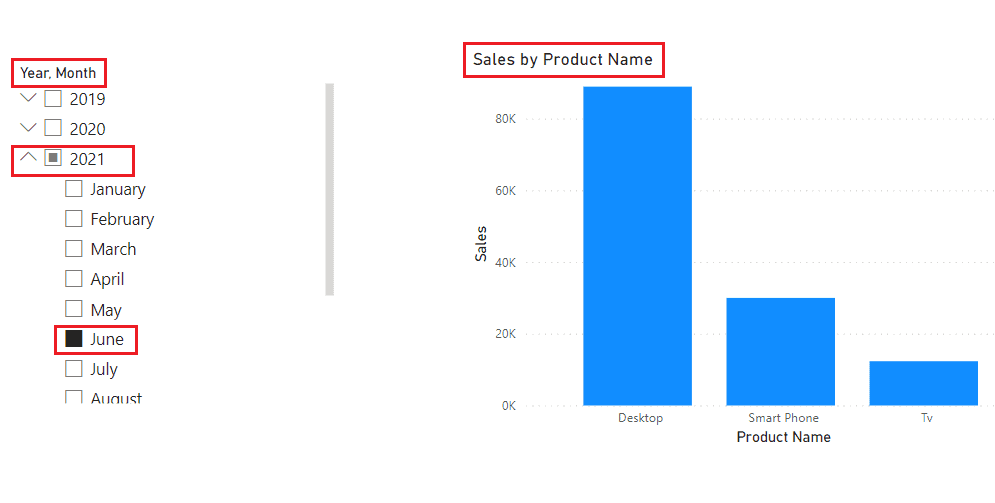
This is how to filter the value presented in the power bi report based on the date slicer by month and year in Power Bi.
Check Out: How to Add a Slicer in Power BI
Power BI date slicer date hierarchy month
Let us see how we can add a date slicer with a date hierarchy month in Power Bi,
Date Slicer hierarchy displays the order date field in the Year, Quarter, Month, and Day. From the date slicer, we can select the date slicer date hierarchy month.
- Open the Power Bi desktop and load data using the get data option. Once the data has been loaded, Select the slicer icon presented in the visualization pane, and in the slicer visual, drag and drop the Order Date field.
- In the same way, select the clustered column chart and drag and drop the sales and Product name fields from the field pane as below:
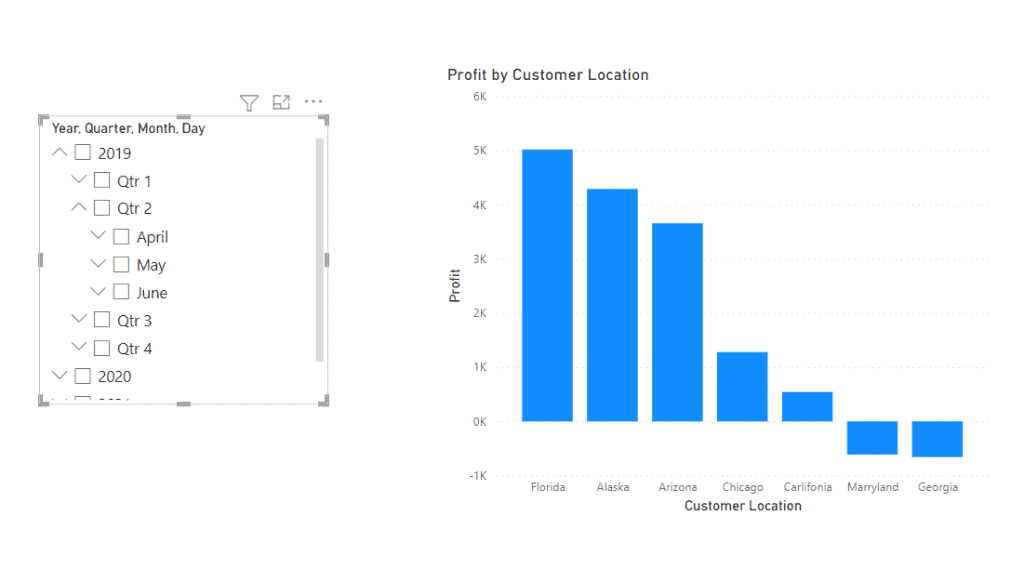
Now select any month from the date hierarchy month slicer and it filters to display the data in the clustered column chart.
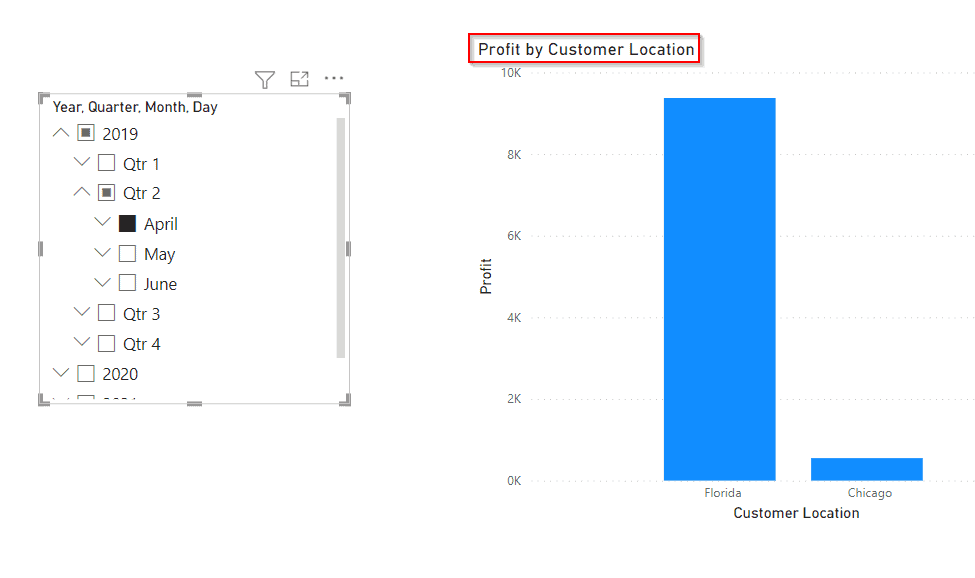
This is how to add a date slicer with a date hierarchy month in the Power Bi report.
Read: How to Add a Dropdown Slicer in Power BI
Power BI date slicer last 12 months
Here we will see how we can display the last 12 months of data in the Power Bi report using the date slicer in Power Bi,
Using the Date slicer it is not possible to display the value for the selected months, but using the Power Bi Dax measure we can filter the value for the last 12 months.
- Open the Power Bi desktop and load data using the get data option. Once the data has been loaded.
- Select the New measure option under the home tab and apply the below-mentioned formula:
Last 12 months = MAX ( Sales_Table[Order Date] ) -12Where,
- Last 12 months = Measure Name
- MAX = Function Name
- Sales_Table = Table Name
- Order Date = Column Name
- Now from the visualization, select the clustered column chart and drag and drop the sales and product names field values from the field pane.
- And also drag and drop the created measure value so that it will display the data for the last 12 months in the clustered column chart.
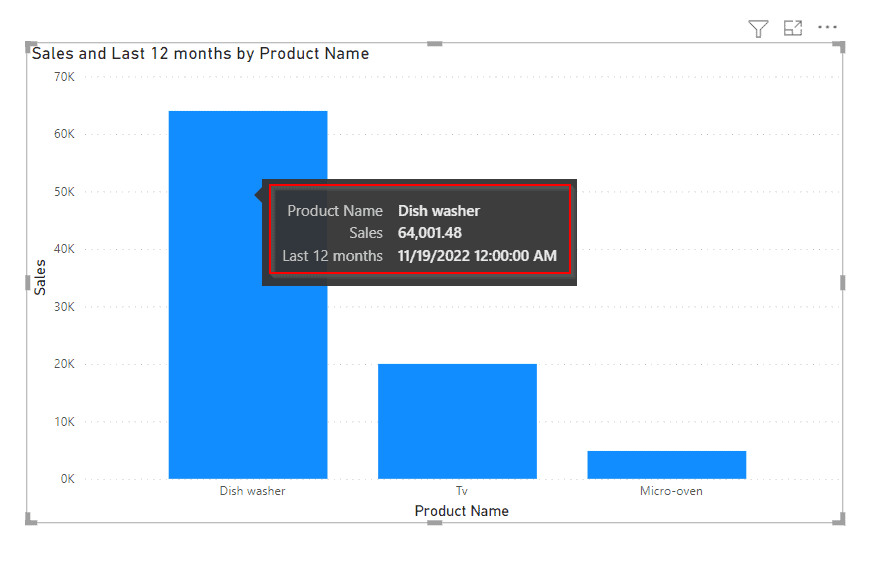
This is how to display the last 12 months of data in the Power Bi report using the date slicer in Power Bi.
Check also: Set the default value in Power Bi Slicer
Power BI date slicer default to the current month
Let us see how we can set the date slicer default to the current month using the power bi date slicer in Power Bi.
- On the Power Bi report page, go to the Home tab > Transform Data. Then it will redirect to the Power query editor page, under the Add column > Custom column.
- A custom column page will appear, here we have to put the formula like this:
= Date.MonthName( DateTime.LocalNow() )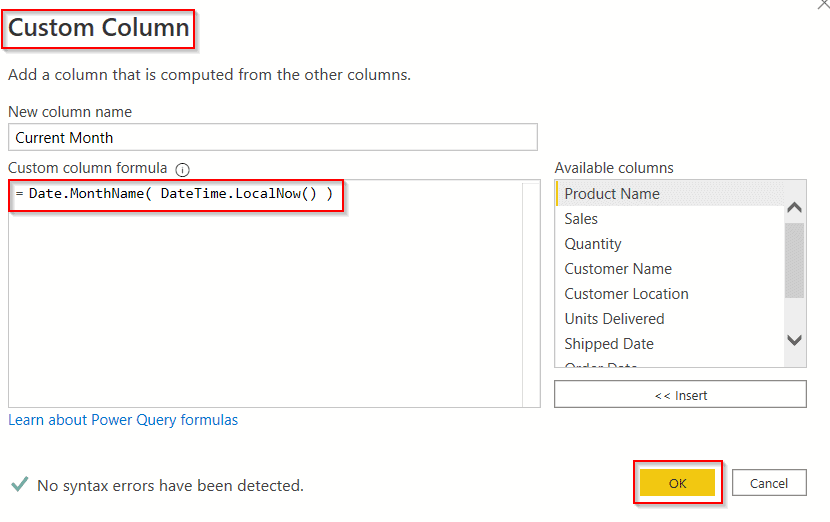
- Click on the Home tab > select Close & Apply. It will return to the Power Bi Report page with updated data.
- Now in the report section, select the slicer and drag and drop the date field and the created custom column field (ie: Current Month is February)from the field pane as below:

- Select any of the date under the current month to filter the value presented in the Power Bi report.
- In the below screenshot, you can see that based on the selection in the date slicer displays the sales data value.
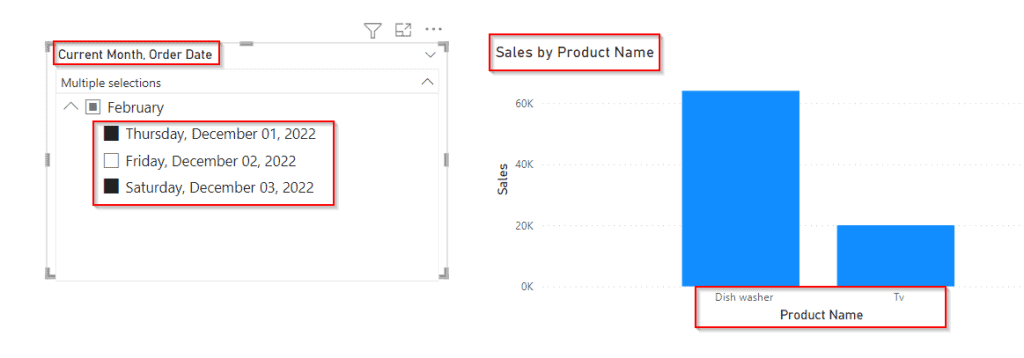
This is how to set the date slicer default to the current month using the power bi date slicer in Power Bi.
This Power Bi tutorial explained how to use the Power Bi date slicer by month and also we understood the date slicer by month and year in Power Bi. We also discussed the date slicer with the date hierarchy month in Power Bi. Also covered below are headings:
- Power BI date slicer last 12 months
- Power BI date slicer default to the current month
Additionally, you may like:
- How to Add a Date Slicer in Power BI
- Power BI DAX Count [15 real examples]
- Power BI Dax Min Filter [With 13 Examples]
- Power BI DAX Min Date from Text
I am Bijay a Microsoft MVP (10 times – My MVP Profile) in SharePoint and have more than 17 years of expertise in SharePoint Online Office 365, SharePoint subscription edition, and SharePoint 2019/2016/2013. Currently working in my own venture TSInfo Technologies a SharePoint development, consulting, and training company. I also run the popular SharePoint website EnjoySharePoint.com