This Microsoft Power BI tutorial explains how to filter the minimum value using the Power Bi Filter function with various examples.
There was a Power BI requirement where I needed to filter the minimum value from a data table. And to achieve it, I have used the Power BI Min Function and also covered the below-mentioned headings.
- Power BI Dax Min filter
- Power BI Dax Min filters multiple columns
- Power BI Dax Min filter empty
- Power BI Dax Min filter condition
- Power BI Dax Min filter is not blank
- Power BI Dax Min filter by value
- Power BI Dax Min filter equal
- Power BI Dax Min filter blank
- Power BI Dax Min filter percentage
- Power BI Dax Min filter based on another table
- Power BI Dax Min filter first value
- Power BI DAX average with filter
- Power bi Dax Min filter if
Power bi Dax min with filter
Here we will see how we can filter the minimum value using the Power bi Dax Min function in Power BI
In this example, we are going to use Team Appearances table data and we will filter the minimum value, and display the minimum value in the card visual else it displays the blank value.
- Open the Power Bi desktop, and load the data into the desktop. Once the data has been loaded, select the new measure option from the ribbon under the Home tab and apply the below mentioned formula.
Filter MIN = CALCULATE (
     MIN('Team Apperances'[Losing Time Count]),
     FILTER( 'Team Apperances','Team Apperances'[Teams]="Volleyball Team")
)
Where,
- Filter MIN = New Measure name
- Team Appearances = Table Name
- Losing Time Count = Existing column name
- Now from the visualization, select the Table visual and card visual in the report section.
- In the table visual and then drag and drop the Teams, Winning Time Count, and Losing Time Count field values from the field pane.
- In the card visual drag and drop the created measure value to display the Minimum value based on the selected Team it displays the value in the Power BI report.
- The screenshot below displays the minimum Losing Time Count value of the mentioned Team by default in the card visual in the Power Bi report.
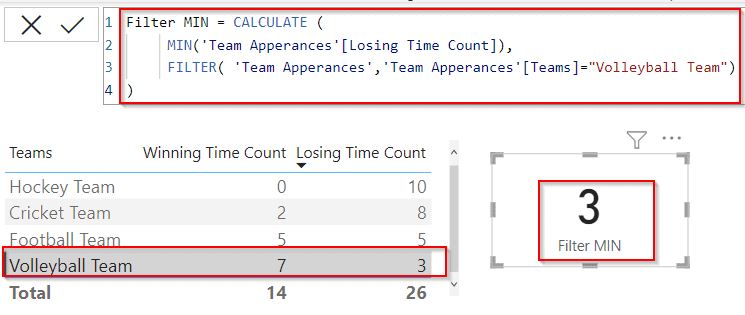
- In the same way, if we select any other Team from the table visual it displays the blank value because the selected Team value will not match the mentioned Team.
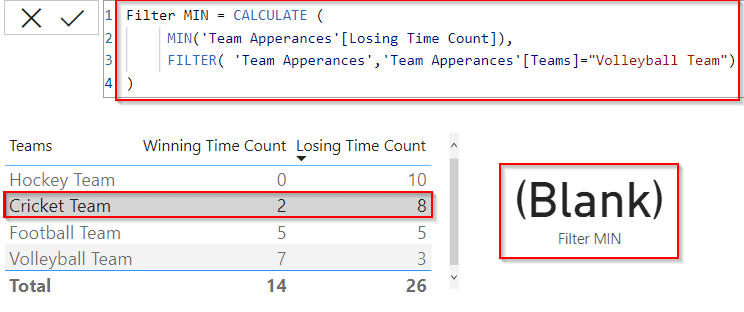
This is how to filter the minimum value using the Power bi Dax Min function in Power Bi.
Check Out: Power BI Dax Min filter by date
Power BI Dax Min filters multiple columns
Let us see how we can find the minimum value using the Power Bi calculate function in Power Bi.
In this example, we will filter the minimum value for multiple columns and display the minimum value in the card visual.
- Open the Power Bi desktop, and load the data into the desktop. Once the data has been loaded, select the new measure option from the ribbon under the Home tab and apply the below mentioned formula.
Multiple Values =
var min1 = CALCULATE(MIN('Team Apperances'[Winning Time Count]),ALLEXCEPT('Team Apperances','Team Apperances'[Teams]))
return min1
Where,
- Multiple Values = New Measure name
- min1 = Variable Name
- Team Appearances = Table Name
- Winning Time Count, Teams = Existing column names
- Now from the visualization, select the Table visual and card visual in the report section.
- In the table visual and then drag and drop the Teams, Winning Time Count, and Losing Time Count field values from the field pane.
- In the card visual drag and drop the created measure value to display the Minimum value based on the condition it displays the value in the Power BI report.
- The screenshot below displays the minimum Winning Time Count value of the Team in the card visual in the Power Bi report.

This is how to find the minimum value using the Power Bi calculate function in Power Bi.
Power BI Dax Min filter empty
Let us see how we can filter and count the empty values using the Power Bi Dax min function in Power BI.
In this example, we will calculate and filter the empty value of the discount based on the condition using the Filter function in Power Bi.
- Open the Power Bi desktop, and load the data into the desktop. Select the new measure from the ribbon under the Home tab and apply the below-mentioned formula.
Empty Values = COUNTROWS( FILTER(
        'Team Appearances',
        'Team Appearances'[Losing Time Count] = BLANK()
    )
)
Where,
- Empty Values = New measure name
- Team Appearances = Table Name
- Losing Time Count = Existing column name
- Now from the visualization, select the Table visual and card visual in the report section.
- In the table visual and then drag and drop the Teams, Winning Time Count, and Losing Time Count field values from the field pane.
- In the card visual drag and drop the created measure value to display the empty values count in the Power BI report.
- The screenshot below displays the empty values count of the Team in the card visual in the Power Bi report.
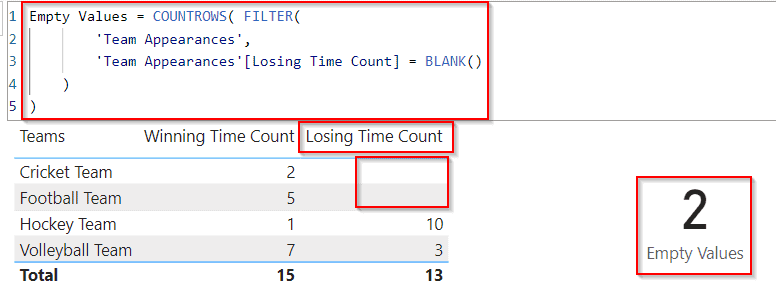
This is how to filter and count the empty values using the Power Bi Dax min function in Power BI.
Read Power BI DAX Min Date from Text
Power BI Dax Min filter condition
Let us see how we can filter the minimum value using the Power Bi filter function in Power Bi,
In this example, we will filter the minimum value, and display the minimum value in the card visual.
- Open the Power Bi desktop, and load the data into the desktop. Once the data has been loaded, select the new measure option from the ribbon under the Home tab and apply the below mentioned formula.
MIN_VALUE =
  VAR losingcount = MIN('Team Apperances'[Losing Time Count])
RETURN
  CALCULATE ( MIN('Team Apperances'[Losing Time Count]),
     FILTER('Team Apperances','Team Apperances'[Losing Time Count]=losingcount )
  )
Where,
- MIN_VALUE = New measure name
- losing count= Variable Name
- Team Appearances = Table Name
- Losing Time Count = Existing column name
- Now from the visualization, select the Table visual and card visual in the report section.
- In the table visual and then drag and drop the Teams, Winning Time Count, and Losing Time Count field values from the field pane.
- In the card visual drag and drop the created measure value to display the Minimum value based on the condition it displays the value in the Power BI report.
- The screenshot below displays the minimum Losing Time Count value of the Team in the card visual in the Power Bi report.
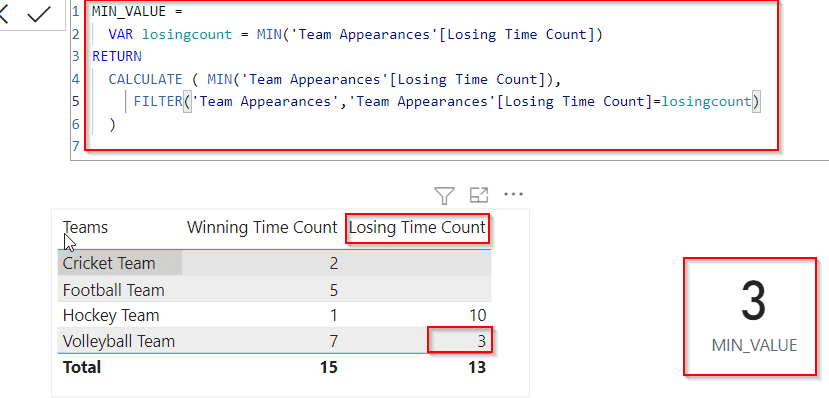
This is how to filter the minimum value using the Power Bi filter function in Power Bi.
Power BI Dax Min filter is not blank
Let us see how we can filter non-blank values using the Power Bi Dax blank function in Power BI.
In this example, we will calculate and filter the non-blank values and display them in the new column of the data table.
- Open the Power Bi desktop, and load the data into the desktop. Select the new column option from the ribbon under the Home tab and apply the below-mentioned formula.
Non Blank Values = IF('Team Apperances'[Losing Time Count]=BLANK(),BLANK(),'Team Apperances'[Losing Time Count])Where,
- Non-Blank Values = New column name
- Team Appearances = Table Name
- Losing Time Count = Existing column name
In the below screenshot, We can see that the new column, displays non-blank values as it is, and also it takes the zero value as the blank value.

This is how to filter non-blank values using the Power Bi Dax blank function in Power BI.
Read Power bi Dax Min Date Add
Power BI Dax Min filter by value
Let us see how we can filter the min value using the Power Bi Dax Min function in Power BI.
In this example, we will calculate the minimum team members’ value for the Team appearances presented in the table.
- Open the Power Bi desktop, and load the data into the desktop. Select the new measure option from the ribbon under the Home tab and apply the below-mentioned formula.
Min sequence = CALCULATE(MIN('Team Appearances'[Team Members Count]),VALUES('Team Appearances'[Teams]))Where,
- Min sequence = New Measure name
- Team Appearances = Table Name
- Team Members Count, Teams = Existing column name
- Now in the report section, select the table visual and card visual. In the table visually drag and drop the Teams and Team Members Count from the field pane.
- And in the card visual drag and drop the created Min Sequence measure value to display the minimum value for the Team Members’ count.
- In the below screenshot, you can see that the card visually displays the minimum value of team members.

This is how to filter the min value of all teams using the Power Bi Dax Min function in Power BI.
Check Out: Power BI Dax Min filter and sum
Power BI Dax Min filter equal
Here we will see how to filter the values using the Power Bi Dax min formula in Power Bi.
In this example, we will calculate the minimum team member value if the team member’s value is equal to the mentioned value then it will display the value as True else False.
- Open the Power Bi desktop, and load the data into the desktop. Select the new measure option from the ribbon under the Home tab and apply the below-mentioned formula.
Filter Condition = var result = MIN('Team Appearances'[Team Members Count])
RETURN IF(result=6,TRUE(),FALSE())
Where,
- Filter Condition = New measure name
- Team Appearances = Table Name
- Team Members Count = Existing column name
- Now in the report section, select the table visually. In the table visually drag and drop the Teams and Teams members count and also the created filter condition measure fields from the field pane.
- In the below screenshot, you can see that the table visually displays the value as true or false based on the condition applied.

This is how to filter the values using the Power Bi Dax min formula in Power Bi.
Power BI Dax Min filter blank
Let us see how we can filter the blank value using the Power bi Blank function in Power Bi.
- Open the Power Bi desktop and load the table data into it, click on the new measure option from the ribbon and apply the below formula:
Filter Blank = var result = VALUES('Team Appearances'[Losing Time Count])
RETURN IF(result=BLANK(),TRUE(),FALSE())
Where,
- Filter Blank = Measure name
- result = variable name
- Team Appearances = Table name
- Losing Time Count = Column name
- Now in the report section, select the table visual from the visualizations.
- In the table visual, drag and drop the Teams, losing time count and Teams members count, and also the created filter blank value measure field from the field pane.
- In the below screenshot, you can see that the table visually displays the value as true or false based on the condition applied.

This is how to filter the blank value using the Power bi Blank function in Power Bi.
Power BI Dax Min filter percentage
Here we will calculate and filter the percentage value using the Power Bi Divide function in Power BI.
In this example, we will filter the min percentage value of the winning time count using the divide function in Power Bi.
- Open the Power Bi desktop, and load the data into the desktop. Select the new measure option from the ribbon under the Home tab and apply the below-mentioned formula.
Percent Min =
DIVIDE (
    SUM ('Team Appearances'[Winning Time Count] ),
    CALCULATE ( MIN( 'Team Appearances'[Winning Time Count]),ALLSELECTED('Team Appearances'[Teams] )
))
Where,
- Percent Min = New Measure name
- Team Appearances = Table Name
- Winning Time Count = Existing column names
- Now in the report section, select the table visually. In the table visually drag and drop the Teams, losing time count and Teams members count, and also the created filter blank value measure field from the field pane.
- Once the value has been calculated under measure tools, change the format value from general to percentage format.
- In the below screenshot, you can see that the table visually displays the percentage min value for all the teams.
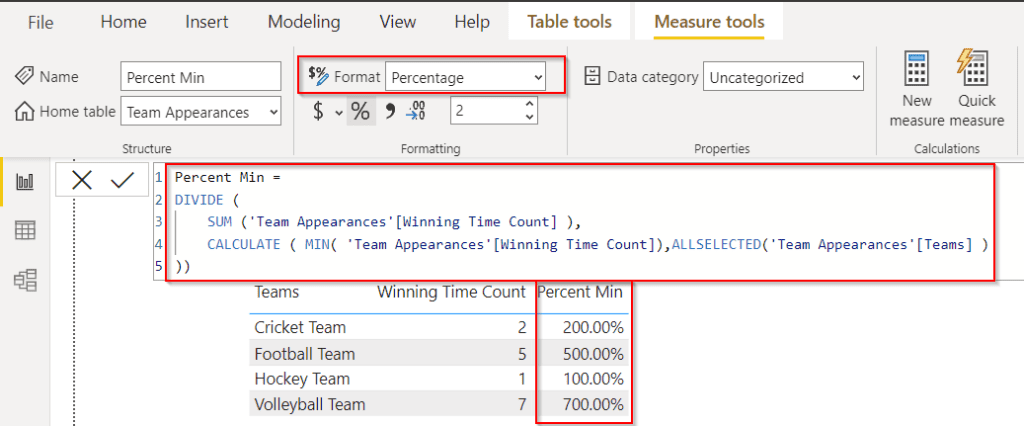
This is how to calculate and filter the percentage value using the Power Bi Divide function in Power BI.
Power BI Dax Min filter based on another table
Let us see how we can filter the value based on another table using the Power Bi filter function in Power Bi
In this example, I have used two tables, one Team 1 and one Team 2 if the Team 1 table winning time count column is less than or equal to the Team 2 table winning time count column displays the minimum count of the team name in a card visual in Power Bi.
Table 1 ( Team 1)

Table 1 ( Team 2)

- Open the Power Bi desktop, and load the data into the desktop. Select the new measure option from the ribbon under the Home tab and apply the below-mentioned formula.
Multiple Tables = CALCULATE( MIN('Team 1'[Teams] ) , FILTER( 'Team 1' ,'Team 1'[Winning Time Count] <= MIN('Team 2'[Winning Time Count]) ))Where,
- Multiple Tables = New Measure name
- Team 1, Team 2 = Table Names
- Winning Time Count, Teams = Existing column names
- Now in the report section, select the two table visuals and one card visual. In the first table visually drag and drop the Table Team 1 Team ID, Teams, and Winning time count fields from the field pane.
- In the second table visually drag and drop the Table Team 2 Team ID, Teams, and Winning time count fields from the field pane.
- And in the card visual drag and drop the created measure value to display the team name based on the condition applied.
- The screenshot below displays the team name in the card visual for the minimum winning time count value from two tables.
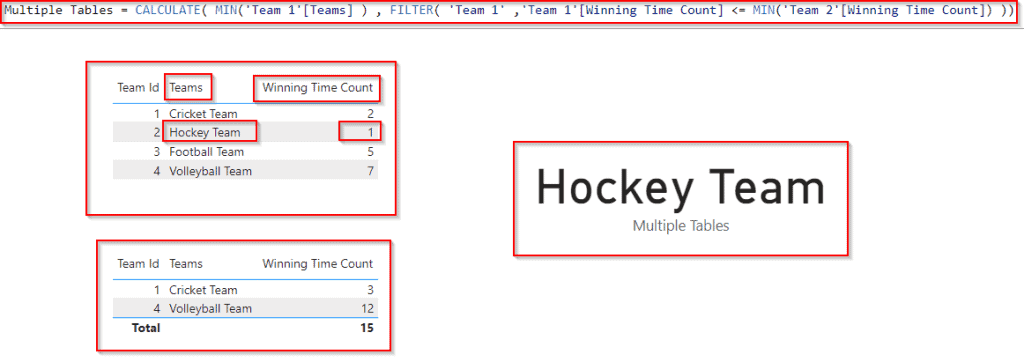
This is how to filter the value from other tables using the Power Bi filter function in Power Bi.
Power BI Dax Min filter first value
Let us see how we can filter the first min value using the Power Bi DAX min function in Power BI.
In this example, we will calculate the first-most Min value and display the result in the card visual.
- Open the Power Bi desktop, and load the data into the desktop. Select the new measure option from the ribbon under the Home tab and apply the below-mentioned formula.
First MIN Value =
CALCULATE(
    [Min sequence],
    TOPN(
        4,
        FILTER('Team Appearances','Team Appearances'[Winning Time Count] = [Min sequence]),
        'Team Appearances'[Min sequence])
        )
Where,
- First MIN Value = New Measure name
- Team Appearances = Table Name
- Winning Time Count = Existing column name
- Now in the report section, select the table visual and card visual. In the table visually drag and drop the Teams and Winning time count fields from the field pane.
- And in the card visual drag and drop the created First Min Value measure value.
- In the below screenshot, you can see the card visually displays the first minimum winning count value from the table data.
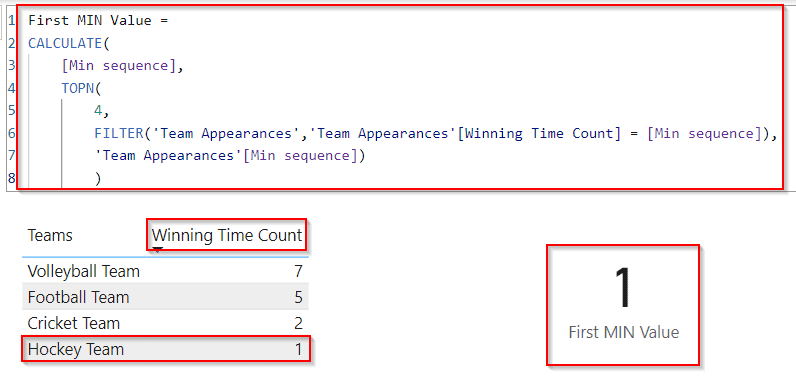
This is how to filter the first min value using the Power Bi DAX min function in Power BI.
Power BI DAX average with filter
Here we will calculate and filter the average value using the Power Bi Average function in Power BI.
In this example, we will calculate and filter the average value of the team winning count based on the Team using the Average function in Power Bi.
- Open the Power Bi desktop, and load the data into the desktop. Select the new measure option from the ribbon under the Home tab and apply the below-mentioned formula.
AVG_Value =
CALCULATE ( AVERAGE ('Team Appearances'[Winning Time Count] ), 'Team Appearances'[Teams]="Cricket Team" )
Where,
- AVG_Value = New Measure name
- Team Appearances = Table Name
- Winning Time Count = Existing column names
- Now in the report section, select the table visual and card visual. In the table visually drag and drop the Team ID, Teams, and winning count values from the field pane.
- And in the card visual drag and drop the created Average value to display the minimum value of the mentioned team.
- In the below screenshot, you can see that the card visually displays the average value for the mentioned team.

This is how to calculate and filter the average value using the Power Bi Average function in Power BI.
Power bi Dax min filter if
Let us see how we can filter the min value using the Power Bi Min function in Power bi.
In this example, we will calculate the min values if the winning time count value is equal to the minimum value then it will display the value as 1 else 0.
- Open the Power Bi desktop, and load the data into the desktop. Select the new column option from the ribbon under the Home tab and apply the below-mentioned formula
MIN If =
VAR MINVALUE =
    CALCULATE ( MIN('Team Appearances'[Winning Time Count] ), ALL ( 'Team Appearances'[Teams] ) )
RETURN
IF ( MIN ('Team Appearances'[Winning Time Count]) = MINVALUE, 1,0)- Min If = New Measure name
- Team Appearances = Table Name
- Winning Time Count = Existing column name
- MINVALUE = Variable name
In the below screenshot, you can see that the new column displays the value as 1,0 (as highlighted below)based on the condition.
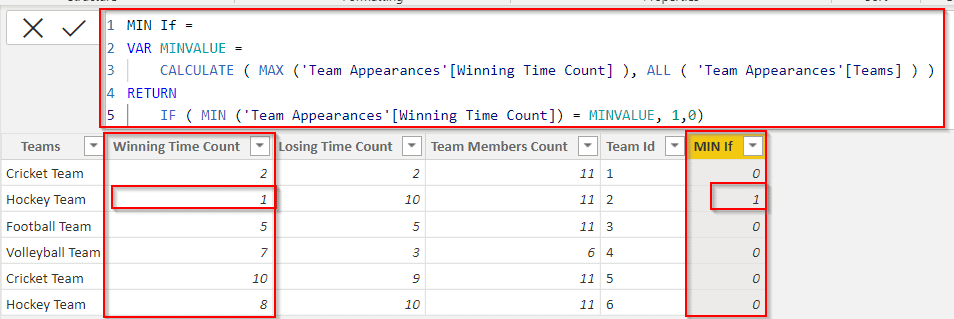
This is how to filter the min value using the Power Bi Min function in Power bi.
This Power BI tutorial explains how to filter the minimum value using the Power Bi Filter function with different examples. Also covered the below headings:
- Power BI Dax Min filter
- Power BI Dax Min filters multiple columns
- Power BI Dax Min filter empty
- Power BI Dax Min filter condition
- Power BI Dax Min filter is not blank
- Power BI Dax Min filter by value
- Power BI Dax Min filter equal
- Power BI Dax Min filter blank
- Power BI Dax Min filter percentage
- Power BI Dax Min filter based on another table
- Power BI Dax Min filter first value
- Power BI DAX average with filter
- Power bi Dax Min filter if
Related Power BI tutorials:
- How to Add a Dropdown Slicer in Power BI
- Power BI DAX Min Date Sum
- Power BI DAX Min Date Minus
- Power BI DAX Min Date Validation
- How to Check IF Text is NULL in Power BI
I am Bijay a Microsoft MVP (10 times – My MVP Profile) in SharePoint and have more than 17 years of expertise in SharePoint Online Office 365, SharePoint subscription edition, and SharePoint 2019/2016/2013. Currently working in my own venture TSInfo Technologies a SharePoint development, consulting, and training company. I also run the popular SharePoint website EnjoySharePoint.com