In the Power Bi tutorial, we will learn how to use Power BI Dax Min Function to find the minimum date and calculate the sum value in Power BI.
In a recent Power Bi project, I had to calculate the values using the Power BI Min date sum value using the Power Bi Min function. So in this Power BI tutorial, I have explained to you how to calculate the minimum date sum value for the Power Bi report. Also covered below topics:
- Power BI DAX min date Sum
- Power BI DAX min date Sum with filter
- Power BI DAX min date Sum by date
- Power BI DAX min date Sum by month
- Power BI DAX min date Sum of column
- Power BI DAX min date Sum days
- Power BI DAX min date Sum based on the date
Power BI DAX min date Sum
Let us see how we can find the sum value of the minimum date using the Power Bi Min function in Power BI.
In this example, we are going to use the vehicle table data we will find the sum value of the car price for the minimum date value in the car data table.
- Open the Power Bi desktop, and load the data into the desktop.
- Once the data has been loaded, Select the new measure option and apply the below-mentioned formula.
Minimum Sum Value =
VAR MinDateFromCarTable = MIN(Cars[Released Date])
RETURN
CALCULATE(SUM(Cars[Price]), FILTER('Cars', Cars[Released Date] = MinDateFromCarTable))
Where,
- Minimum Sum Value = New measure name
- Cars = Table Name
- Released Date, Price = Existing column names
- MinDateFromCarTable = Variable Name
- Now in the report section, select the table visual and card visual. In the table visually drag and drop the car name, car model, car price, and released date value from the field pane.
- And in the card visual drag and drop the Created measure value to display the sum value of the car price for the minimum date based on the condition applied.
- The screenshot below displays the car price value for the minimum date value in the card visual for the release date column.
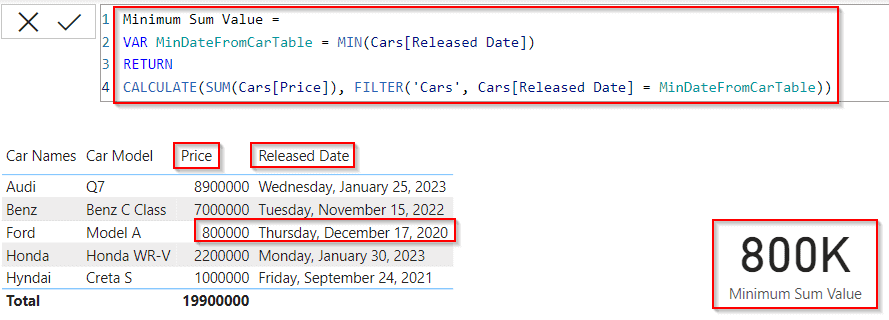
This is how to find the sum value of the minimum date using the Power Bi Min function in Power Bi.
Power BI DAX min date Sum with filter
Here we will see how we can find the minimum date sum value by using the Power Bi filter function in Power Bi,
In this example, we will filter the minimum date value for the bike released to date and calculate the sum price value for the minimum date.
- Open the Power Bi desktop, and load the data into the desktop. Once the data has been loaded, Select the new measure option and apply the below-mentioned formula.
Sum with filter =
VAR MinDateFromSelectedInterval = MIN(Bikes[Released Date]) return
CALCULATE(SUM(Bikes[Price]), FILTER('Bikes', Bikes[Released Date] = MinDateFromSelectedInterval))
Where,
- Sum with filter = New Measure name
- MinDateFromSelectedInterval = Variable Name
- Bikes = Table Name
- Price, Released Date = Existing Column names
- Now in the report section, select the table visual and card visual. In the table visually drag and drop the bike name, bike model, bike price, and released date value from the field pane.
- And in the card visual drag and drop the Created measure value to display the sum value of the bike price for the minimum date based on the condition applied.
- The screenshot below displays the bike price value for the minimum date value in the card visual for the release date column.

This is how to find the minimum date sum value by using the Power Bi filter function in Power Bi.
Power BI DAX min date Sum by date
Here we will see how we can display the sum value based on the minimum date using the Power Bi Summarize function in Power Bi.
In this example, we will sum the bike price value by the minimum date value for the bike released date column.
- Open the Power Bi desktop, and load the data into the desktop. Once the data has been loaded, Select the new measure option and apply the below-mentioned formula.
Sum Value by date =
SUMX(
    SUMMARIZE( 'Bikes', Bikes[Released Date]),
    VAR __minDate =
        CALCULATE(
            MIN( Bikes[Released Date] ),
            ALL( Bikes[Released Date])
        )
    RETURN
        IF(
            __minDate = Bikes[Released Date],
            CALCULATE(
                SUM( Bikes[Price] ),
               Bikes[Released Date] = __minDate
            )
        )
)
Where,
- Sum Value by date = New Measure name
- __minDate = Variable Name
- Bikes = Table Name
- Price, Released Date = Existing Column names
- Now in the report section, select the table visual and card visual. In the table visually drag and drop the bike name, bike model, bike price, and released date value from the field pane.
- And in the card visual drag and drop the Created measure value to display the sum value of the bike price for the minimum date based on the condition applied.
- The below screenshot displays the bike price value for the minimum date value in the card visual for the release date column.
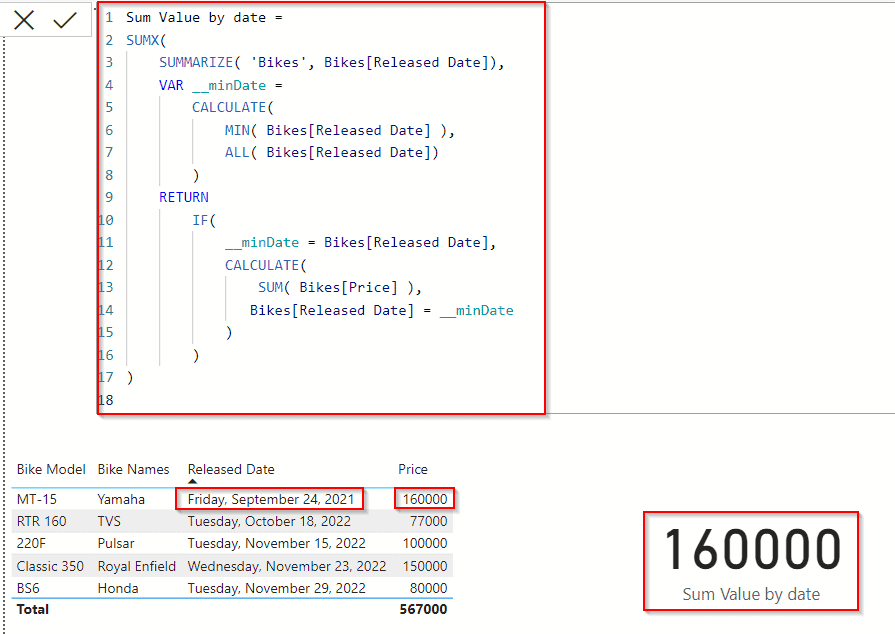
In the same way, if we select any other date value from the table visual, it displays the bike price value in the card visual based on the selected date as below:
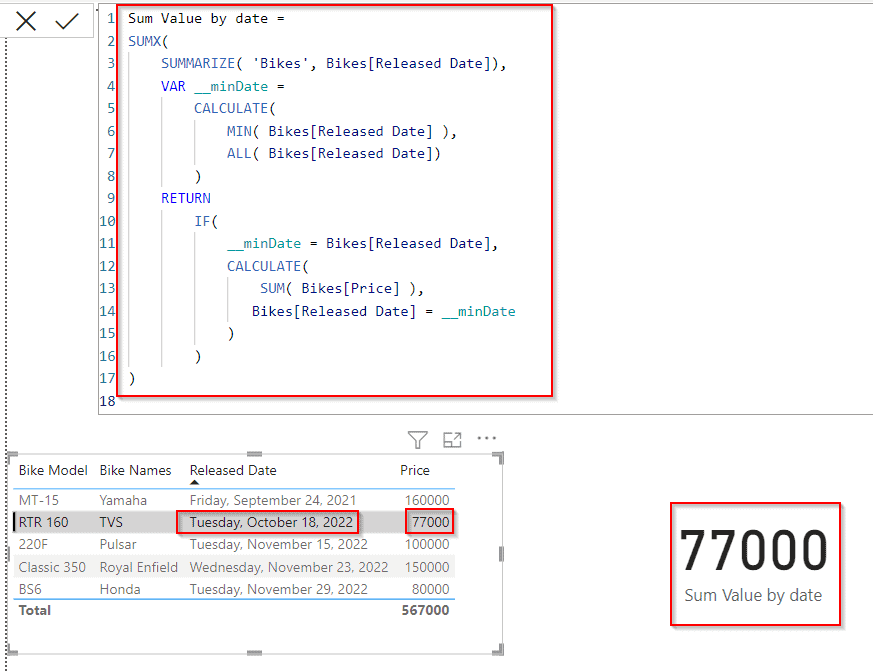
This is how to display the sum value based on the minimum date using the Power Bi Summarize function in Power Bi.
Read Power BI DAX Min Date Minus
Power BI DAX min date Sum by month
Here we will see how we can display the sum value based on the minimum date and by month using the Power Bi Date function in Power Bi.
In this example, By default only the minimum date value for the bike released date column displays the bike price value else, it displays the blank value.
- Open the Power Bi desktop, and load the data into the desktop. Once the data has been loaded, Select the new measure option and apply the below-mentioned formula.
By Month =
VAR __minDate = CALCULATE ( FIRSTDATE ( Bikes[Released Date] ) )
RETURN
CALCULATE ( SUM ( Bikes[Price] ), Bikes[Released Date] = __minDate )
Where,
- By Month = New Measure name
- __minDate = Variable Name
- Bikes = Table Name
- Price, Released Date = Existing Column names
- FIRST DATE = Function Name
- Now in the report section, select the table visual and card visual. In the table visually drag and drop the bike name, bike model, bike price, and released date value from the field pane.
- And in the card visual drag and drop the Created measure value to display the sum value of the bike price for the minimum date based on the condition applied.
- The below screenshot displays the bike price value for the minimum date value in the card visual for the release date column.

In the same way, if we select any other month value or the date value it displays the blank value as below only for the minimum date value it displays the bike price value.
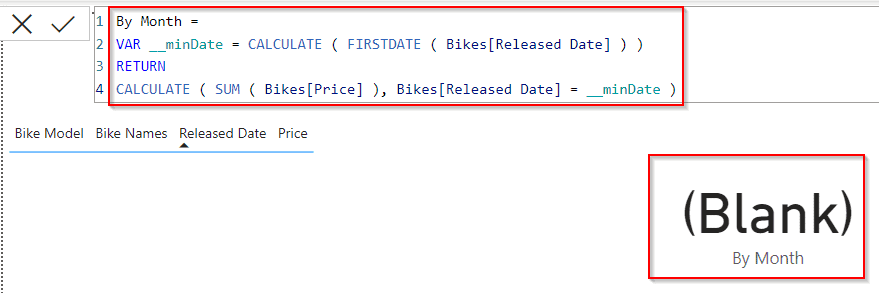
This is how to display the sum value based on the minimum date and by month using the Power Bi Date function in Power Bi.
Read Power BI DAX Min Date Validation
Power BI DAX min date Sum of column
Let us see how we can find the minimum date value and display the sum value in a new column in Power BI,
In this example, we will calculate the min date value for the existing bike table and display the sum value of the bike price in a new column in power bi.
- Open the Power Bi desktop, and load the data into the desktop. Select the new Column option from the ribbon under the Home tab and apply the below-mentioned formula.
Minimum Sum Column Value =
VAR MinDate = MIN(Bikes[Released Date])
RETURN
CALCULATE(SUM(Bikes[Price]), FILTER('Bikes', Bikes[Released Date] = MinDate))
Where,
- Minimum Sum Column Value = New Column name
- MinDate = Variable Name
- Bikes = Table Name
- Price, Released Date = Existing Column names
- In the below screenshot, you can see that the new column displays the bike price value for the minimum date value.
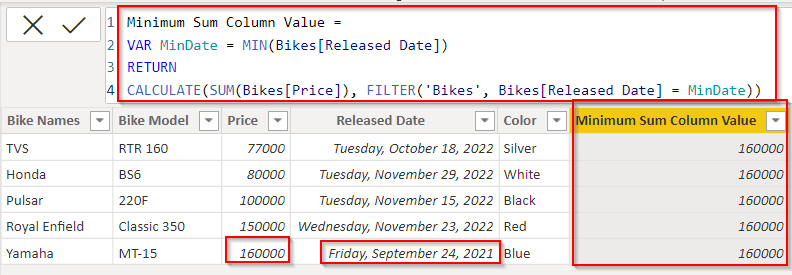
This is how to find the minimum date value and display the sum value in a new column in Power BI.
Power BI DAX min date Sum days
Let us see how we can sum the value for the selected days or date ranges using the Power Bi Sum function in Power bi.
In this example, we will sum the bike price value based on the selected days in Power Bi.
- Open the Power Bi desktop, and load the data into the desktop. Select the new measure option from the ribbon under the Home tab and apply the below-mentioned formula.
Sum by days =
VAR MinDateFromSelectedInterval = MIN(Bikes[Released Date])
VAR MinAvailableDateWithValues = CALCULATE(MIN(Bikes[Released Date]), Bikes[Released Date] <= MinDateFromSelectedInterval)
RETURN SUM(Bikes[Price])
Where,
- Sum by days = New Measure name
- MinDateFromSelectedInterval , MinAvailableDateWithValues = Variable Names
- Bikes = Table Name
- Price, Released Date = Existing Column names
- Now in the Power Bi report section, select the table visual and card visual, and date slicer. In the table visually drag and drop the bike name, bike model, bike price, and released date value from the field pane.
- And in the card visual drag and drop the Created measure value to display the sum value of the bike price based on the condition applied.
- In the Slicer visual, drag and drop the released date field, based on the selected days it sums the bike price value and displays the value in the card visual.
- The below screenshot displays the minimum date value of the bike price sum value.
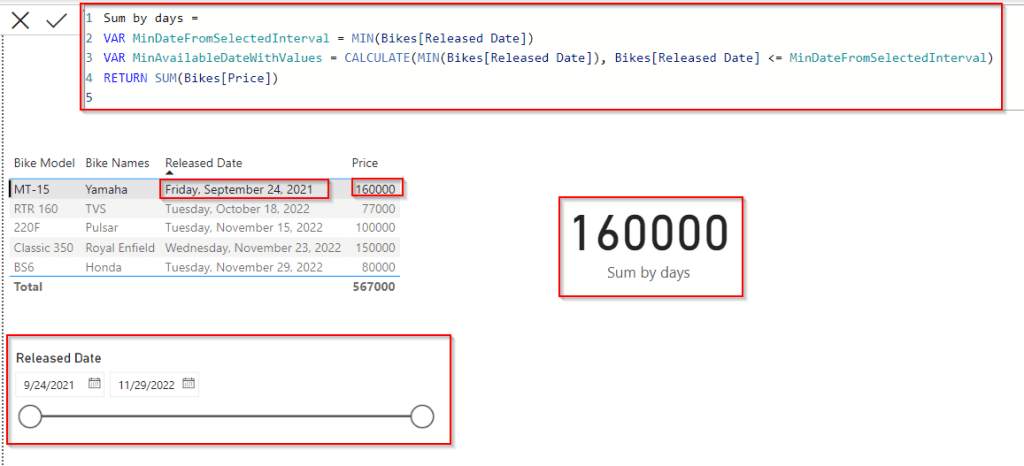
In the same way, if we select days or some date range from the slicer visual it will display the sum price value of the bike in the card visual as below:
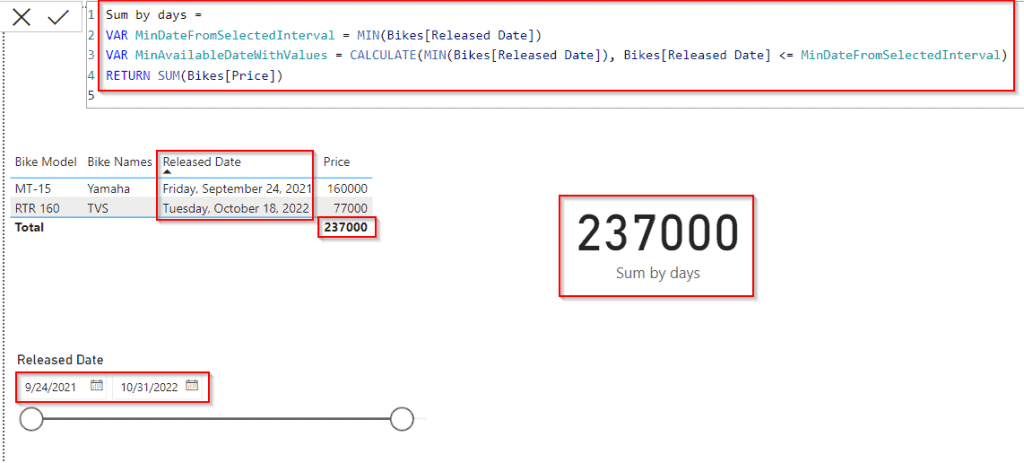
This is how to sum the value for the selected days or date range using the Power Bi Sum function in Power bi.
Power BI DAX min date Sum based on the date
Here we will see how we can display the sum value based on the minimum date using the Power Bi min function in Power Bi.
In this example, we will sum the bike price value by the minimum date value for the bike released date column.
- Open the Power Bi desktop, and load the data into the desktop. Once the data has been loaded, Select the new measure option and apply the below-mentioned formula.
Based on date = CALCULATE( SUM(Bikes[Price]),DATESINPERIOD(Bikes[Released Date],MIN(Bikes[Released Date]),-1,MONTH))Where,
- Based on date = New Measure name
- Bikes = Table Name
- Price, Released Date = Existing Column names
- Now in the report section, select the table visual and card visual. In the table visually drag and drop the bike name, bike model, bike price, and released date value from the field pane.
- And in the card visual drag and drop the Created measure value to display the sum value of the bike price for the minimum date based on the condition applied.
- The below screenshot displays the bike price value for the minimum date value in the card visual for the release date column.

This is how to display the sum value based on the minimum date using the Power Bi min function in Power Bi.
This Power BI tutorial explained how to easily calculate the Minimum date sum values from the table data. Also, we covered these topics below:
- Power BI DAX min date Sum
- Power BI DAX min date Sum with filter
- Power BI DAX min date Sum by date
- Power BI DAX min date Sum by month
- Power BI DAX min date Sum of column
- Power BI DAX min date Sum days
- Power BI DAX min date Sum based on the date
You may like the following Power Bi tutorials:
- Power bi Dax Today() Function
- How To Remove Filter From Power BI DAX
- How to Filter Blank Value in Power BI
- Power BI DAX Filter If
- How to add an empty column in Power BI
I am Bijay a Microsoft MVP (10 times – My MVP Profile) in SharePoint and have more than 17 years of expertise in SharePoint Online Office 365, SharePoint subscription edition, and SharePoint 2019/2016/2013. Currently working in my own venture TSInfo Technologies a SharePoint development, consulting, and training company. I also run the popular SharePoint website EnjoySharePoint.com