In the Power Bi tutorial, we will learn how to use Power BI Dax Min Aggregation Function in Power BI.
In a recent Power Bi project, I had to calculate the values using the Power BI Min aggregation function. So in this Power BI tutorial, I have explained to you how to calculate the minimum value for the Power Bi report. Also covered below topics:
- Power BI DAX function min
- What is the Power BI DAX function minx?
- Difference between Power bi Dax Min vs Minx
- How to use min if condition in Power BI Dax.
- Power bi Dax min value group by
- Power BI DAX min of two columns
- Power BI DAX min of measure
- Power BI DAX min value
- Power BI Dax Min value per category
- Power BI DAX min selected value
- How to calculate Power BI DAX min month
- Find min year in Power BI DAX
- How to get the min value from another table in Power BI DAX
- Power BI DAX min all
- Power BI DAX min Qatar month
Power BI DAX function min
Let us see how we can find the minimum value using the Power bi DAX Min function in Power Bi.
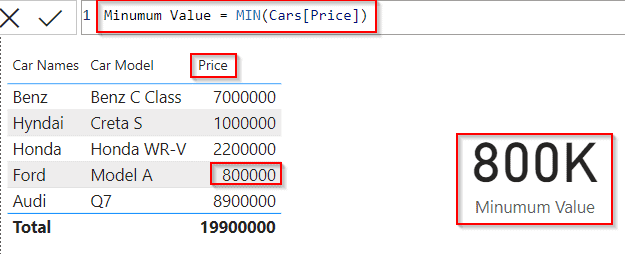
In this example, we will use vehicle data to find the minimum price value of the car presented in the car’s table data.
The Power BI MIN function takes a column or two expressions as an argument and returns the smallest value.
Power Bi Syntax for Minimum function :
MIN(<column>)- Open the Power Bi desktop, and load the data into the desktop. Once the data has been loaded, select the new measure option from the ribbon under the Home tab and apply the below-mentioned formula.
Minimum Value = MIN(Cars[Price])Where,
- Minimum Value = New Measure name
- Cars = Table Name
- Price = Existing column name
- Now from the visualization, select the Table visual and card visual in the report section.
- In the table visual and then drag and drop car names, car models, and price field values
- In the card visual drag and drop the created measure value to display the minimum price value in the Power BI report.
- The screenshot below displays the minimum price value in the card visual in the Power Bi report.
This is how to find the minimum value using the Power bi DAX Min function in Power Bi.
Power bi Dax minx
Here we will see how we can use the Power BI DAX Minx function and calculate the minimum value in Power Bi
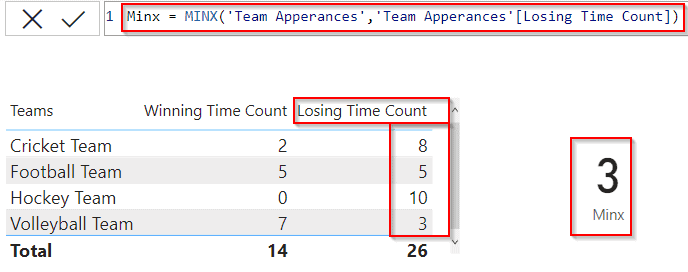
In this example, I have used the Team Appearances table mentioned below to calculate the team which has a minimum losing time count in matches.

- Initially, load the data into the Power Bi desktop, and from the ribbon select the new measure option and apply the below-mentioned formula.
Minx = MINX('Team Apperances','Team Apperances'[Losing Time Count])Where,
- Minx = New Measure name
- Team Appearances = Table Name
- Losing Time Count = Existing column name
- Select the Table visual and card visual in the report section from the visualizations.
- In the table visual and then drag and drop the Teams, Winning Time Count, and Losing Time Count field values
- In the card visual drag and drop the created measure value to display the minimum losing time count value in the Power BI report.
- The screenshot below, display the minimum value of the losing time count using the Power BI Dax Minx function.
This is how to use the Power BI DAX Minx function and calculate the minimum value in Power Bi.
Power bi Dax Min vs Minx
| Power Bi Dax Min | Power Bi Dax Minx |
| Power Bi Dax Min function returns the smallest value in a column or the smallest value between two scalar expressions. | Power Bi Dax Minx function returns the smallest value for an expression evaluated for each row in a table |
| Syntax: MIN(<Column>) , MIN(<expression1>, <expression2>) | Syntax : MINX(<table>,<expression>) |
Power bi Dax min if
Let us see how we can use the Power BI DAX Min function and calculate the minimum value in Power Bi
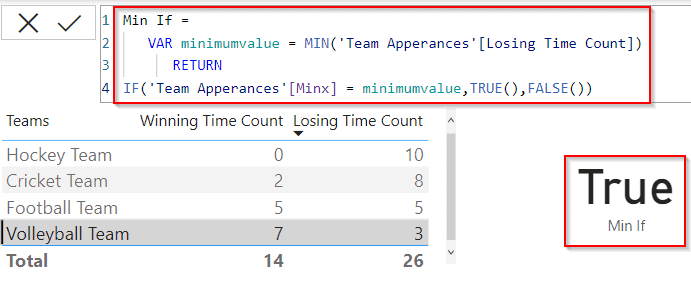
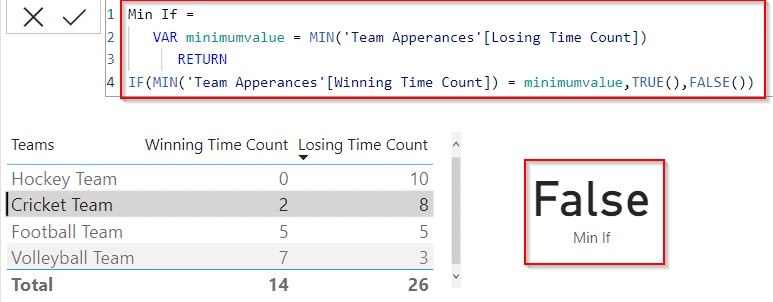
In this example, I have used the Team Appearances table to calculate the team minimum value using the if condition, if the value matches with the min value it displays the true value in the card visual else it displays the false value.
- Open the Power BI desktop and load the data into it, select the new measure option from the ribbon and apply the below-mentioned formula.
Min If =
   VAR minimumvalue = MIN('Team Apperances'[Losing Time Count])
      RETURN
IF('Team Apperances'[Minx] = minimumvalue,TRUE(),FALSE())
Where,
- Min If = New Measure name
- minimum value = Variable name
- Team Appearances = Table Name
- Losing Time Count = Existing column name
- Select the Table visual and card visual in the report section from the visualizations.
- In the table visual and then drag and drop the Teams, Winning Time Count, and Losing Time Count field values
- In the card visual drag and drop the created measure value to display a true or false value based on the minimum value.
- The screenshot below, display the minimum value of the losing time count using the Power BI Dax Min function.
- If the applied condition didn’t match the minimum count then it displays the false value as below:
This is how to use the Power BI DAX Min function and calculate the minimum value in Power Bi.
Power bi Dax min by group
Let us see how we can find the minimum value based on the group in Power BI,
In this example, we will calculate the minimum value for the group and display the minimum value for the Winning Time count column, minimum value will be displayed as 1 and the remaining value as 0.
- Open the Power Bi desktop, and load the data into the desktop. Select the new Column option from the ribbon under the Home tab and apply the below-mentioned formula.
Min in group = IF(CALCULATE(MIN('Team Apperances'[Winning Time Count]),ALLEXCEPT('Team Apperances','Team Apperances'[Teams]))=MIN('Team Apperances'[Winning Time Count]),1,0)Where,
- Min in group = New Column name
- Team Apperances= Table Name
- Winning Time Count = Existing column name
- In the new column, you can see the minimum value is represented as 1 and the remaining values as 0 as shown below:

This is how to find the minimum value based on the group in Power BI.
Power BI DAX min of two columns
Let us see how we can display the minimum value of two columns using the Power Bi min function in Power Bi
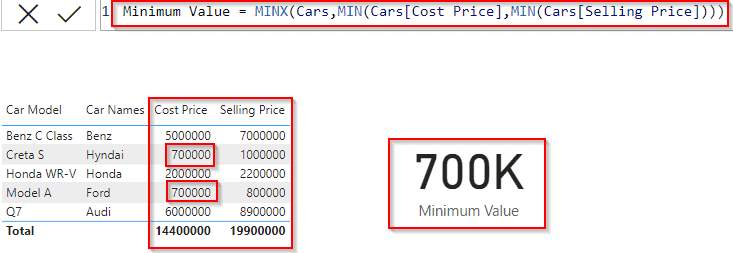
In the example, we will find the minimum price value of two or more columns called cost price and selling price and display the minimum value.

- Open the Power Bi desktop, and load the data into the desktop. Select the new measure option from the ribbon under the Home tab and apply the below-mentioned formula.
Minimum Value = MINX(Cars,MIN(Cars[Cost Price],MIN(Cars[Selling Price])))Where,
- Minimum Value = New measure name
- Cars = Table Name
- Cost Price, Selling Price = Existing column names
- In the report section, select the table visual and card visual from the visualizations.
- In the table visual, drag and drop the car name, cost price, and selling price from the fields pane, and in the card visual, drag and drop the created measure value.
- In the below screenshot, you can see that the card visually displays the minimum value of two different columns in Power Bi.
This is how to display the minimum value of two columns using the Power Bi min function in Power Bi.
Read Power bi Dax Today() Function
Power BI DAX min of measure
Let us see how we can calculate the minimum value using the Power Bi Dax min function in Power Bi
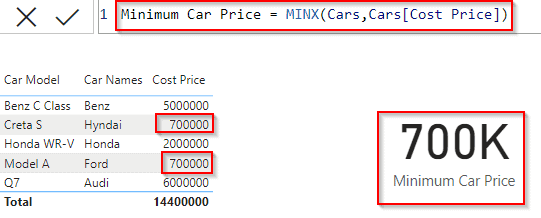
In this example, we will calculate the minimum car price value and display the result value in the card visual.
- Open the Power Bi desktop, and load the data into the desktop. Select the new measure option from the ribbon under the Home tab and apply the below-mentioned formula.
Minimum Car Price = MINX(Cars,Cars[Cost Price])Where,
- Minimum Car Price = New Measure name
- Cars = Table Name
- Cost Price = Existing column name
- Now in the report section, select the table visual and card visual. In the table visually drag and drop the car name, car price, and cost price fields from the field pane.
- And in the card visual drag and drop the created measure value to display the minimum price value based on the condition applied.
- The screenshot below displays the minimum car price value in the card visual.
This is how to calculate the minimum value using the Power Bi Dax min function in Power Bi.
Power BI DAX min value
Let us see how we can calculate the minimum value using the Power Bi Dax min function in Power Bi
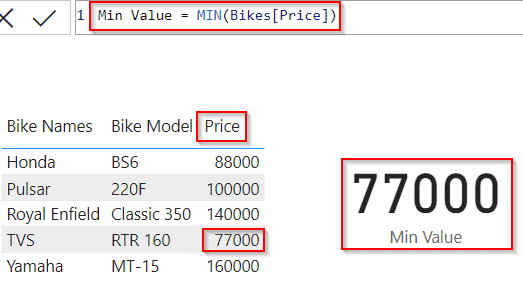
In this example, we will calculate the minimum car price value and display the result value in the card visual.
- Open the Power Bi desktop, and load the data into the desktop. Select the new measure option from the ribbon under the Home tab and apply the below-mentioned formula.
Min Value = MIN(Bikes[Price])Where,
- Min Value = New Measure name
- Bikes = Table Name
- Price = Existing column name
- Now in the report section, select the table visual and card visual. In the table visually drag and drop the bike name, bike price, and bike model fields from the field pane.
- And in the card visual drag and drop the created measure value to display the minimum price value based on the condition applied.
- The screenshot below displays the minimum car price value in the card visual.
This is how to calculate the minimum value using the Power Bi Dax min function in Power Bi.
Read Power BI DAX Calendar Function
Power BI Dax Min value per category
Let us see how we can display the minimum value based on the category in Power Bi,
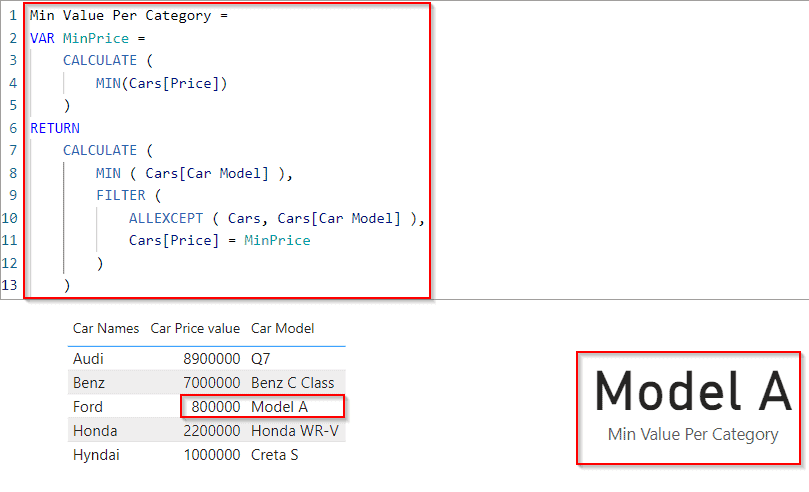
Here we will find the minimum car price value from the table visual and display the respective category car model in the card visual.
- Open the Power Bi desktop, and load the data into the desktop. Select the new measure option from the ribbon under the Home tab and apply the below-mentioned formula.
Min Value Per Category =
VAR MinPrice =
    CALCULATE (
        MIN(Cars[Price])
    )
RETURN
    CALCULATE (
        MIN ( Cars[Car Model] ),
        FILTER (
            ALLEXCEPT ( Cars, Cars[Car Model] ),
            Cars[Price] = MinPrice
        )
    )
Where,
- Min Value Per Category = New Measure name
- Cars = Table Name
- Price, Car Model = Existing column name
- Now from the visualization, select the Table visual and card visual in the report section.
- In the table visual and then drag and drop car names, car models, and price field values.
- In the card visual drag and drop the created measure value displays the minimum price value’s car model based on the condition applied.
- The screenshot below displays the car model in the card visual for the minimum car price value.
This is how to display the minimum value based on the category in Power Bi.
Power BI DAX Min selected value
Here we will see how we can display the minimum value based on the selected value in Power BI,
In this example, we will use the Power Bi Min function to calculate the minimum value and the slicer visual for the selection process.
- Open the Power Bi desktop, and load the data into the desktop. Select the new measure option from the ribbon and apply the below formula to calculate the minimum value.
Min value = Min(Cars[Cost Price]) - Now in the report section, select the slicer visual and card visual. In the slicer visual drag and drop the car name field from the field pane.
- And in the card visual drag and drop the created measure value to display the minimum value based on the condition applied.
- In the below screenshot you can see that the card visually displays the minimum value based on the selected value from the slicer visual:
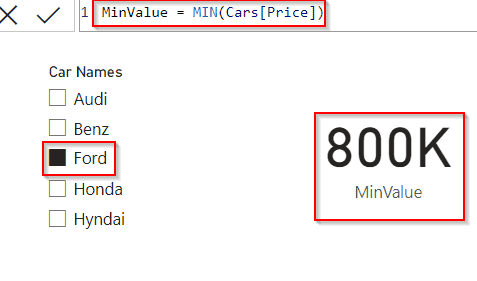
In the same way, if we choose a different car name from the slicer visual it displays the minimum value accordingly.
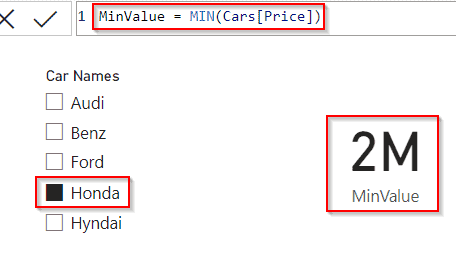
This is how to display the minimum value based on the selected value in Power BI.
Read Power BI DAX Filter Table
Power BI DAX Min month
Let us see how we can find the Min Month value using the Power Bi Dax Min function in Power BI,
Here in this example, if the Min month presented in the table matches with the current month then it will display true in the card visual else it displays false.
- Open the Power Bi desktop, and load the data into the desktop. Select the new measure option from the ribbon under the Home tab and apply the below-mentioned formula.
MinMonth =
Var MinimumMonth = MONTH((TODAY()))
RETURN
if(MONTH(MIN(Cars[Released Date].[MonthNo]))= MinimumMonth,TRUE(),FALSE())
Where,
- MinMonth = New Measure name
- Cars = Table Name
- Released Date = Existing column name
- MinimumMonth= Variable name
- Now in the report section, select the table visual and card visual. In the table visually drag and drop the car name, car price, and released date value from the field pane.
- And in the card visual drag and drop the created measure value to display the minimum value based on the condition applied.
- The screenshot below displays the value as True in the card visual, because the Car table Released date month falls under the current month’s value (ie. December).
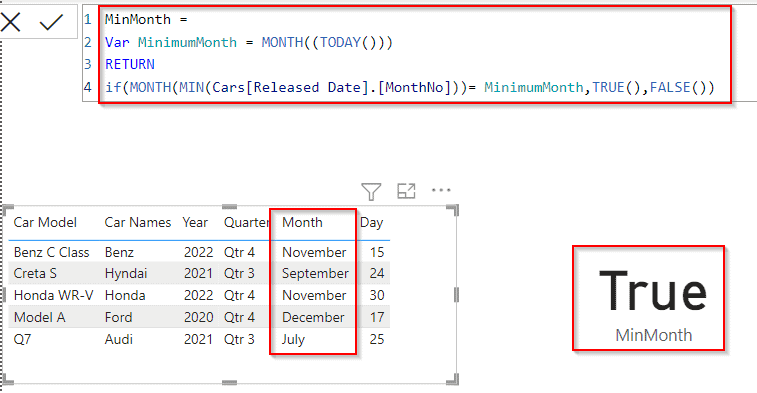
This is how to find the Min Month value using the Power Bi Dax Min function in Power BI.
Power BI DAX Min year
Let us see how we can calculate the min year value using the Min function in Power BI
- Initially, open the Power Bi desktop, and load the data into the desktop. Select the new measure option from the ribbon and apply the below formula to calculate the minimum year value in Power Bi.
MIN Year = MIN(Cars[Released Date].[Year])Where,
- Min Year= New measure name,
- Cars = Table Name
- Released Date = existing Column name
- Now in the report section, select table visuals and card visuals. In the table visually drag and drop the car name and Released date field from the field pane.
- And in the card visual drag and drop the created measure value to display the minimum year value based on the condition applied.
- In the below screenshot, you can see that the card visually displays the minimum year value presented in the table.
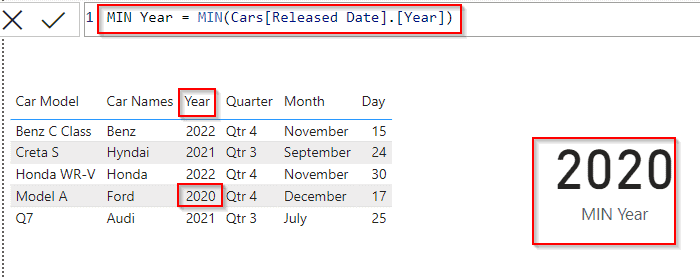
This is how to calculate the min year value using the Min function in Power BI.
Read How To Remove Filter From Power BI DAX
Power BI DAX gets the min value from another table
Let us see how we can find the minimum value from another table using power Bi DAX in Power BI.
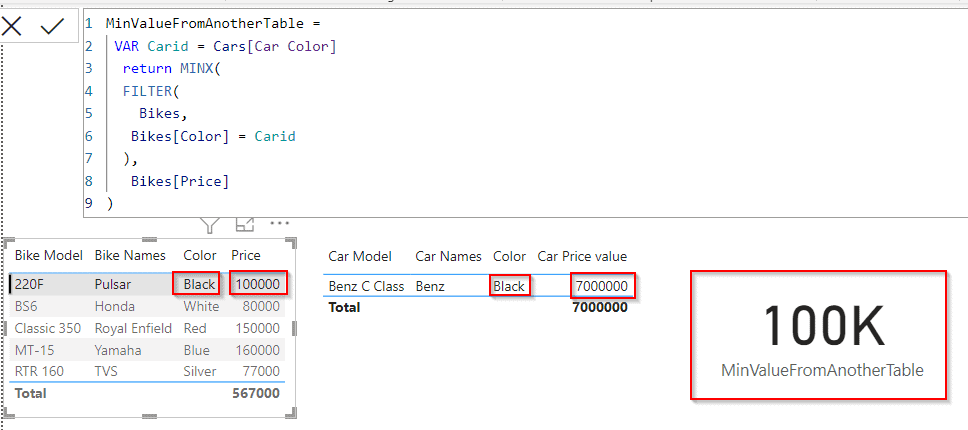
In this example, we are going to use two tables called (Bikes and Cars) to calculate the minimum value and display the result in the card visual.
- Open the Power Bi desktop, and load the data into the desktop. Select the new measure option from the ribbon and apply the below formula to calculate the minimum value.
MinValueFromAnotherTable =
 VAR Carid = Cars[Car Color]
  return MINX(
  FILTER(
    Bikes,
   Bikes[Color] = Carid
  ),
   Bikes[Price]
)
Where,
- MinValueFromAnotherTable = New Measure name
- Cars, Bikes = Table Name
- Bike Colors, Car Colors, Price = Column name
- Carid = Variable id
- Now in the report section, select two table visuals and one card visual. In the table visually drag and drop the car name and car color field from the field pane, and in another table visually drag and drop the bike name, bike price, and bike color fields from the field pane.
- And in the card visual drag and drop the created measure value to display the minimum value based on the condition applied.
- In the below screenshot, you can see that the card visually displays the minimum value based on the color value selected from the bike table visual to display the minimum price value.
This is how to find the minimum value from another table using power Bi DAX in Power BI.
Power BI DAX Min all
Here we will see how to find the minimum value using the Power BI DAX min-all function in Power BI,
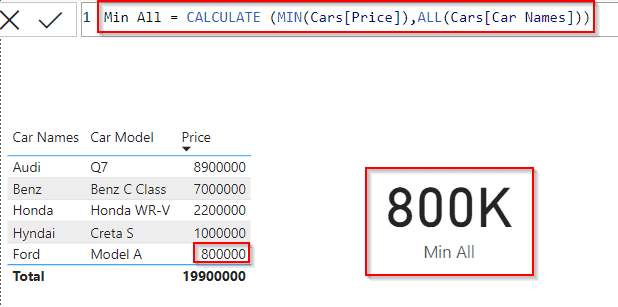
We will find the minimum price value of the car presented in the car’s table data.
- Open the Power Bi desktop, and load the data into the desktop. Select the new measure option from the ribbon and apply the below formula to calculate the minimum value.
Min All = CALCULATE (MIN(Cars[Price]),ALL(Cars[Car Names]))Where,
- Min All = New Measure name
- Cars = Table Name
- Price, Car Names = Column name
- Now in the report section, select the table visual and card visual. In the table visually drag and drop the car name, price, and car color fields from the field pane.
- And in the card visual drag and drop the created measure value to display the minimum value based on the condition applied.
- In the below screenshot, you can see that the card visually displays the minimum value based on the condition applied.
This is how to find the minimum value using the Power BI DAX min-all function in Power BI.
Power BI DAX min Qatar month
Let us see how we can display the minimum Qatar month value using a min function in Power Bi.
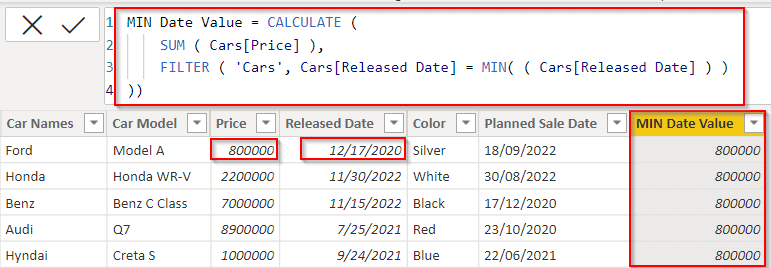
- Open the Power Bi desktop, and load the data into the desktop. Select the new column option from the ribbon and apply the below formula.
MIN Date Value = CALCULATE (
    SUM ( Cars[Price] ),
    FILTER ( 'Cars', Cars[Released Date] = MIN( ( Cars[Released Date] ) )
))
Where
- MIN Date Value = New column name,
- Cars = Table Name
- Car Names, Released Date = existing Column name
In the below screenshot, you can see that the new column displays the min price value of the car for the Qatar month value. (ie where the current month value is 12).
This is how to display the minimum Qatar month value using a min function in Power Bi.
This Power BI tutorial explained how to easily calculate the Minimum values from the table data. Also, we covered these topics below:
- Power BI DAX function min
- Power bi Dax minx
- Power bi Dax min if
- Power bi Dax min by group
- Power bi Dax min with filter
- Power BI DAX min of two columns
- Power BI DAX min date
- Power BI DAX min of measure
- Power BI Dax Min value per category
- Power BI DAX min selected value
- How to calculate Power BI DAX min month
- Find min year in Power BI DAX
- How to get the min value from another table in Power BI DAX
- How to use the min all power BI DAX
- Calculate min Qatar month in Power BI DAX
You may like the following Power BI tutorials:
- How to Filter Power BI Dax Based On Condition
- How to Filter Date using Power BI DAX
- Power BI Switch
- Difference between USERNAME() and USERPRINCIPALNAME() in Power BI Dax
- Subtraction in Power bi using DAX
I am Bijay a Microsoft MVP (10 times – My MVP Profile) in SharePoint and have more than 17 years of expertise in SharePoint Online Office 365, SharePoint subscription edition, and SharePoint 2019/2016/2013. Currently working in my own venture TSInfo Technologies a SharePoint development, consulting, and training company. I also run the popular SharePoint website EnjoySharePoint.com