While working together, one of my Power BI clients wanted to filter the data between two dates or based on the date selection. I’ve found that using the Power BI DAX function is extremely easy.
In this Power BI tutorial, I will explain how to filter date using Power BI DAX, Power BI DAX filter max date, Power BI DAX filter date range, and many more:
- Filter Between Two Dates using Power BI DAX
- Filter Date Greater Than Today Using Power BI DAX
- Filter Date Less Than using Power BI DAX
- Filter Max Date in Power BI using DAX
- Filter Date Range using Power BI DAX
- Filter Specific Date Power BI DAX
Filter Date Using Power BI DAX
Here, I will show you how to filter by month using Power BI DAX. Suppose you have a dataset where you store daily sales data and want to see the sales for the current month using Power BI.
For this example, I have a small dataset that includes the Date and Sale Amount.
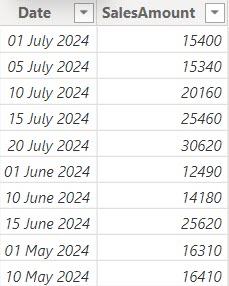
Now follow the below steps:
1. Open Power BI Desktop and load the dataset. Then, you will see the dataset in the Data pane.
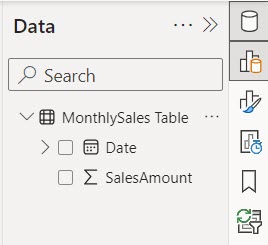
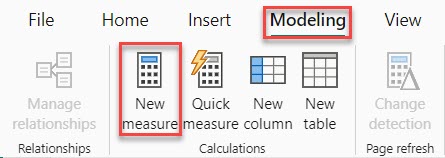
2. Then click New measure under the Modeling tab.
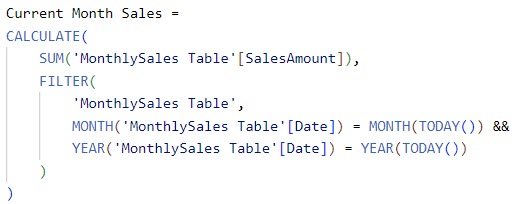
3. In the formula bar, put the DAX expression below.
Current Month Sales =
CALCULATE(
    SUM('MonthlySales Table'[SalesAmount]),
    FILTER(
        'MonthlySales Table',
        MONTH('MonthlySales Table'[Date]) = MONTH(TODAY()) &&
        YEAR('MonthlySales Table'[Date]) = YEAR(TODAY())
    )
)
Where:
- Current Month Sales = This names the new measure.
- CALENDAR() = This function calculates the sum of SalesAmount for the filtered rows
- SUM(MonthlySales Table[SalesAmount]) = This part sums up the SalesAmount column.
- FILTER(‘MonthlySales Table’, …) = This function filters the MonthlySales Table.
- MONTH(‘MonthlySales Table'[Date]) = MONTH(TODAY()) = This part ensures that only rows where the month of the Date column matches the current month are considered.
- YEAR(‘MonthlySales Table'[Date]) = YEAR(TODAY()) = This part ensures that only rows where the year of the Date column matches the current year are considered.
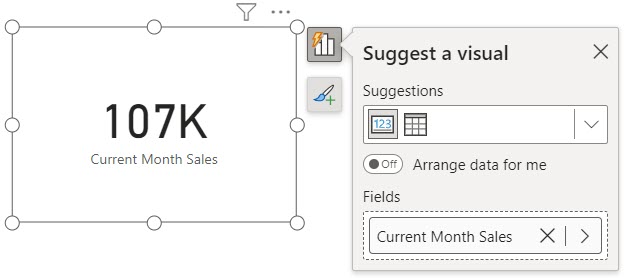
4. To see the sales for the current month, add a Power BI Card visual and then add the “Current Month Sales” to it.
Filter Between Two Dates using Power BI DAX
Suppose you have a table with TransactionDate from April 25th, 2024, to June 5th, 2024, and a SalesAmount column.
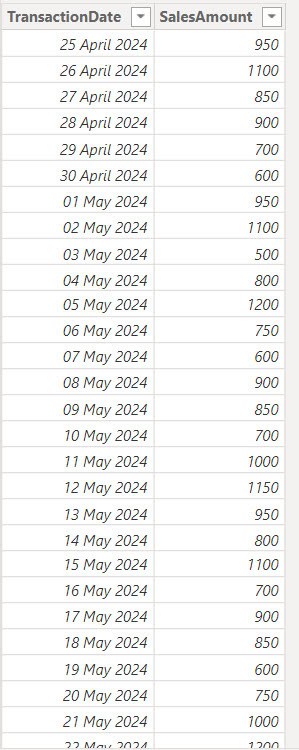
We want the total sales between May 1st and May 31st.
To do this, follow the below steps:
1. I hope you loaded the above data set into the Power BI. Then, go to the “Modeling” tab in Power BI Desktop, click “New Measure“, and enter the following DAX expression.
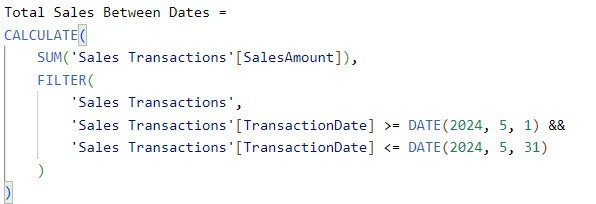
Total Sales Between Dates =
CALCULATE(
    SUM('Sales Transactions'[SalesAmount]),
    FILTER(
        'Sales Transactions',
        'Sales Transactions'[TransactionDate] >= DATE(2024, 5, 1) &&
        'Sales Transactions'[TransactionDate] <= DATE(2024, 5, 31)
    )
)
Where:
- Total Sales Between Dates = This name is for the measure we’re creating, which will calculate the total sales amount between specific dates.
- CALCULATE() = This function modifies the context in which the data is evaluated, allowing us to apply filters and perform calculations.
- SUM(‘Sales Transactions'[SalesAmount]) = This part of the formula calculates the sum of the ‘SalesAmount’ column from the ‘Sales Transactions’ table.
- FILTER() = This function returns a table that includes only the rows that meet the specified condition.
- ‘Sales Transactions’ = This specifies the table we’re filtering, which contains the sales transaction data.
- ‘Sales Transactions'[TransactionDate] >= DATE(2024, 5, 1) = This condition filters the rows to include only those where the ‘TransactionDate’ is on or after May 1, 2024.
- ‘Sales Transactions'[TransactionDate] <= DATE(2024, 5, 31) = This condition filters the rows to include only those where the ‘TransactionDate’ is on or before May 31, 2024.
2. You can create a card visual to see total sales between May 1st and May 31st.
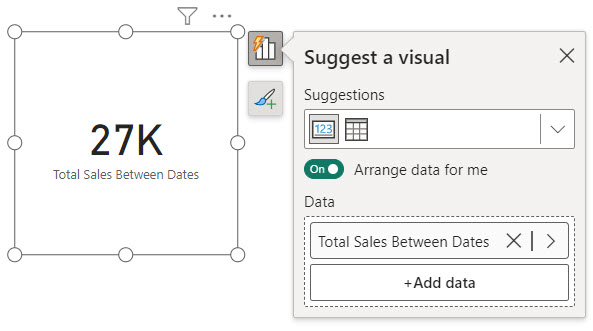
This way, you can filter between two dates DAX in Power BI.
Filter Date Greater Than Today Using Power BI DAX
While working on Power BI, I was required to track the progress of various IT products. The company needed a way to monitor task deadlines to ensure product development remained on schedule.
The dataset was stored in the Power BI named ProductTimeline, which included TaskName, DueDate, Status, and AssignedTo columns.
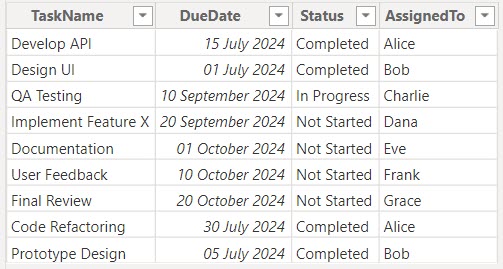
Now follow the below steps to count the tasks left before the due date.
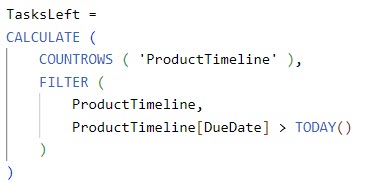
Go to Power BI Desktop and click New measure under the Modeling tab. Then, in the formula bar, put the below DAX expression.
TasksLeft =
CALCULATE (
    COUNTROWS ( 'ProductTimeline' ),
    FILTER (
        ProductTimeline,
        ProductTimeline[DueDate] > TODAY()
    )
)
Where:
- TasksLeft = This is the name of the new measure.
- CALCULATE = This function modifies the context in which the data is evaluated, allowing you to perform calculations under specific conditions.
- COUNTROWS (‘ProductTimeline’) = This counts the number of rows in the ProductTimeline table.
- FILTER(ProductTimeline, ProductTimeline[DueDate] > TODAY()) = This part filters the ProductTimeline table to include only rows where the DueDate is greater than today’s date.
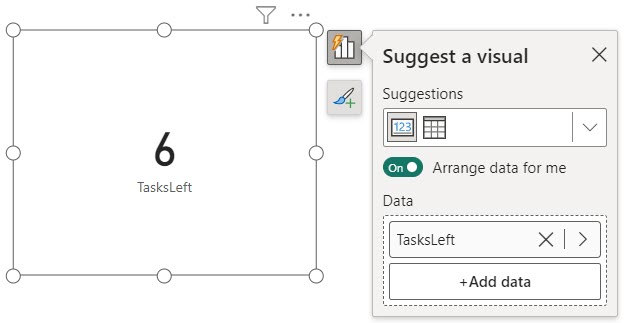
Now add a Power BI Card visual to see how many TasksLeft.
Filter Date Less Than using Power BI DAX
While working on Power BI, I was required to create a report displaying all sales transactions before a specific cutoff date. This was to help the sales team analyze past performance and trends leading up to that date.
According to the requirement, I have a data set that contains the Sale Date, Sales Amount, and Sales Req column.
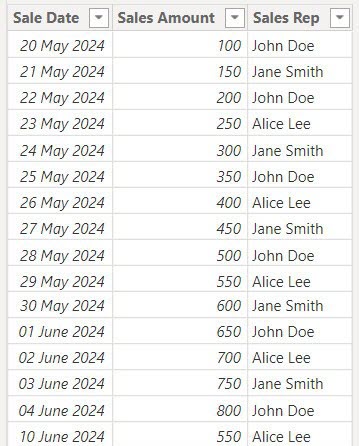
Now, follow the below steps:
Make sure you’ve imported the data set into Power BI. Then, go to the ‘Modeling’ tab, click on ‘New Column’, and input the provided DAX formula.
FilteredSales =
CALCULATE(
    SUM('Transaction Records'[sales Amount]),
    FILTER(
        'Transaction Records',
        'Transaction Records'[Sale Date] < DATE(2024, 06, 02)
    )
)
Where:
- FilteredSales = This is the name of the measure.
- CALCULATE = This function changes the context for the calculation based on the given conditions.
- SUM(‘Transaction Records'[Sales Amount]) = This sums up the values in the sales Amount column from the Transaction Records table.
- FILTER(‘Transaction Records’, ‘Transaction Records'[Sale Date] < DATE(2024, 06, 02)) = This filters the Transaction Records table to include only those rows where the Sale Date is before June 2, 2024.
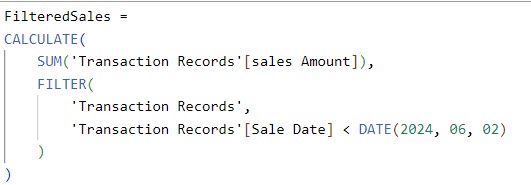
You can create a Power BI card visual to show FilteredSales.
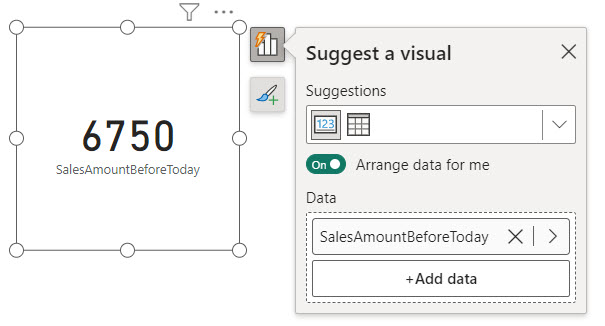
Now, you can filter dates less than a specific date using Power BI DAX.
Filter Max Date in Power BI using DAX
While working on a sales performance report in Power BI, the management team needs to analyze sales data up to the most recent date available in the dataset. The report should automatically filter to show only the records from the latest date for each product category.
So, I thought I would show you how to filter for the maximum date in Power BI using DAX.
For this example, I have a data set that contains SaleDate, ProductCategory, SalesAmount, and QuantitySold columns.
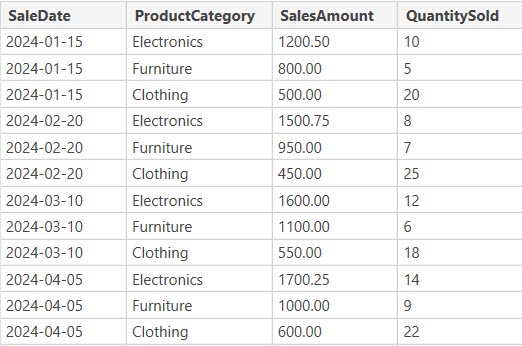
Click the New measure in Power BI Desktop to get the latest date. Then, put the DAX expression below in the formula bar.
MaxDate = MAX(SalesRecords[SaleDate])Where:
- MaxDate = This is the name of the measure.
- MAX(SalesRecords[SaleDate]) = This function finds the maximum value in the SaleDate column of the SalesRecords table.

Now, add a Power BI Table visual, and then add MaxDate, ProductCategory, SalesAmount, and QuantitySold columns.
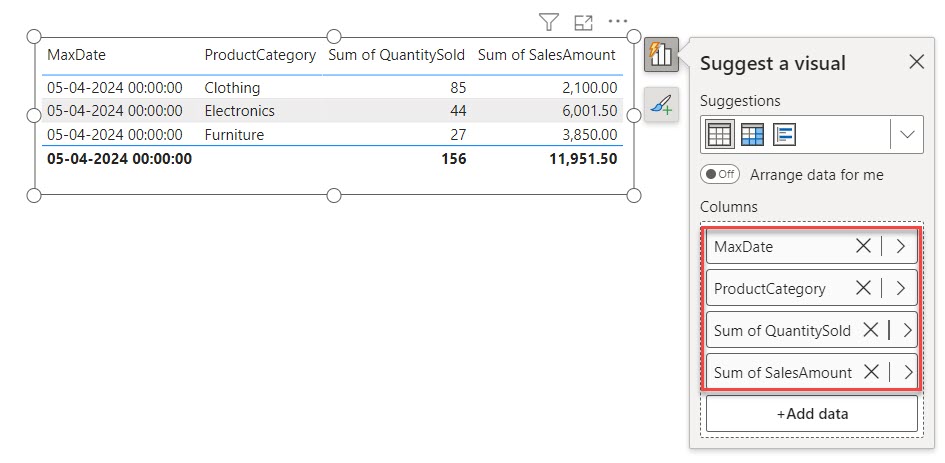
The table visual shows only the latest date value. Using Power BI DAX, you can apply a filter based on the maximum date value.
Filter Date Range using Power BI DAX
While working on Power BI, I was required to create a report that filters employee records based on their date of joining. The goal was to display only those employees whose joining dates fall within a specific range from February 27, 2023, to February 20, 2024.
So, I created a Power BI table containing EmployeeID, EmployeeName, and Date of joining.
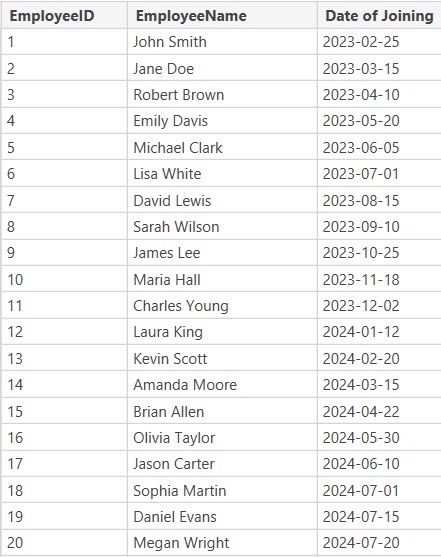
Now, Go to the Modeling tab on the top ribbon and click “New table” to create a new table using DAX. Then, in the formula bar, put the below DAX expression.
Range =
VAR DateStart = DATE ( 2023, 2, 27 )
VAR DateEnd = DATE ( 2024, 2, 20 )
RETURN
    CALCULATETABLE (
        Employees,
        FILTER ( Employees, Employees[Date of Joining] <= DateEnd && Employees[Date of Joining] >= DateStart )
    )
Where,
- Range: This is the name of the new.
- VAR DateStart = DATE(2023, 2, 27): This defines a variable DateStart with the value February 27, 2023.
- VAR DateEnd = DATE(2024, 2, 20): This defines a variable DateEnd with the value February 20, 2024.
- RETURN: This specifies what the formula should return after the variables are defined.
- CALCULATETABLE: This function creates a table by evaluating a table expression (in this case, Employees) under a modified filter context.
- FILTER(Employees, Employees[Date of Joining] <= DateEnd && Employees[Date of Joining] >= DateStart): This filters the Employees table to include only those rows where the Date of Joining is between DateStart and DateEnd.

Then, a new table will be created in the Data pane under “Range.” Check the screenshot below.
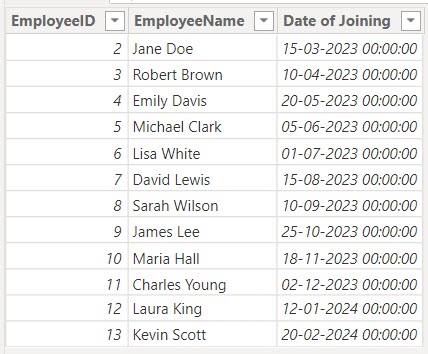
This is how to apply the filter between the date ranges using Power BI DAX in Power BI.
Filter Specific Date Power BI DAX
While working on Power BI, I received a requirement to show data for a specific date range in my visual. Usually, I would use a slicer to filter the dates, but using a slicer can take up valuable space on the report canvas. So, I used a DAX formula to filter and show the specific data in the visual.
I will use the above data set containing EmployeeID, EmployeeName, and Date of joining columns.
Now, in the Power BI Desktop, using the below DAX expression, create a table:
Filtered Specific Date =
CALCULATETABLE(
    Employees,
    Employees[Date of Joining] = DATE(2024,2,20)
)
Where:
- Filtered Specific Date: This is the name of the new table.
- CALCULATETABLE: This function creates a table by evaluating a table expression (in this case, Employees) under a modified filter context.
- Employees: This is the table you are filtering.
- Employees[Date of Joining] = DATE(2024, 2, 20): This condition filters the Employees table to include only those rows where the Date of Joining is exactly February 20, 2024.
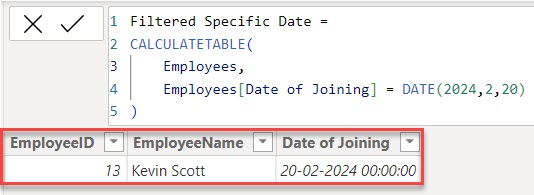
This is how to apply the filter of the data tables only for the specific dates or the selected dates using the Power BI Dax.
This Power BI Tutorial explained how to filter the data by date using the Power BI DAX formula.
Also, you may like the below Power BI Tutorials:
- Filter Current Year Data Using Power BI DAX
- Power BI Dax Min Filter
- DATEDIFF() in Power BI DAX
- Filter Distinct Date Using Power BI DAX
- Power BI DAX Min Date Sum
- Power BI DAX Date Filter Not Working
I am Bijay a Microsoft MVP (10 times – My MVP Profile) in SharePoint and have more than 17 years of expertise in SharePoint Online Office 365, SharePoint subscription edition, and SharePoint 2019/2016/2013. Currently working in my own venture TSInfo Technologies a SharePoint development, consulting, and training company. I also run the popular SharePoint website EnjoySharePoint.com