A Power BI Date Slicer is like a magic wand for your data. It lets you easily filter and visualize your data based on dates.
Think of it as a virtual tool that helps you slice and dice your data by time periods such as days, weeks, months, or even years.
In this tutorial, we will learn about date slicer in Power BI and how we can add a single date slicer in Power BI. Also, we will cover the topics below:
- Power BI calendar slicer
- Single date slicer Power BI
- Power BI date slicer default to last 30 days
- Power BI slicer month and year
- Power BI date slicer last 12 months
- Power BI slicer date range slider
- Create a relative date slicer and filter in Power BI
- How to use the power BI date slicer
Power BI Date Slicer
The date slicer Power BI helps you filter data in visualizations using dates. Normally, it works like a slicer that filters numeric ranges. But, if you need to filter by a particular day, month, or year, you can use it as a category slicer.
The Power BI Date Slicer is handy for exploring connections between various date levels in your dataset. You can filter data using a hierarchy of information like year, quarter, month, and day, depending on what you need.
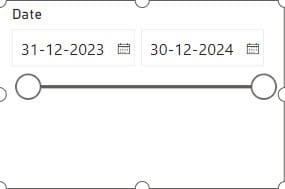
Create a Date Slicer in Power BI
To create a date slicer in Power BI, refer to the example below:
Here, we have a SharePoint list (Sales Data) that contains below columns with various data types:
| Columns | Data Types |
|---|---|
| Date | Date and time |
| Sales Amount | Currency |
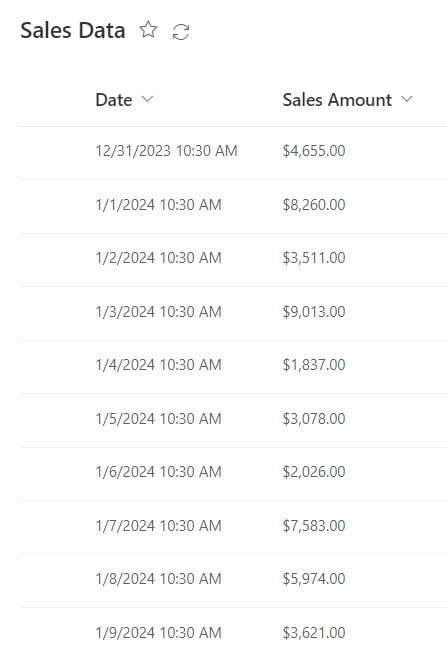
Follow the below steps:
1. Open Power BI Desktop and load the data set. Then, in the Data pane, you can see your data set.
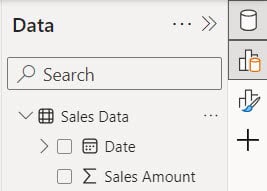
2. Under the Home tab, expand Visual gallery -> Click the Slicer visual.
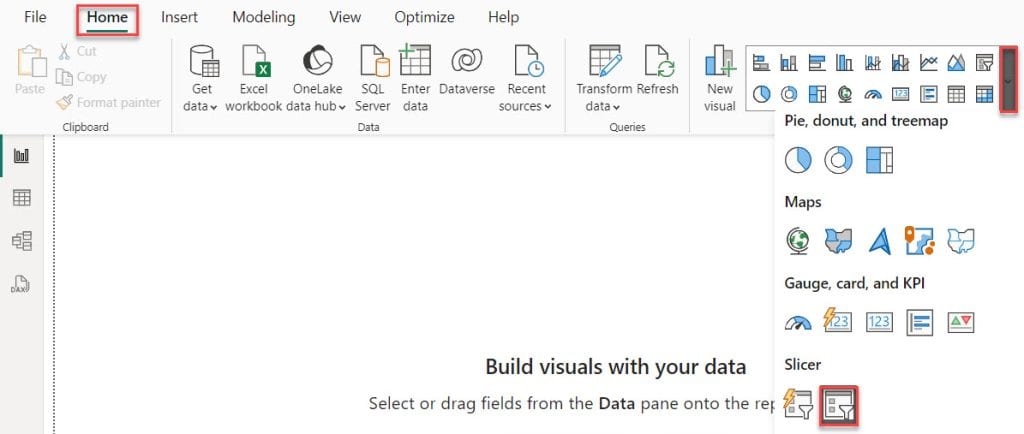
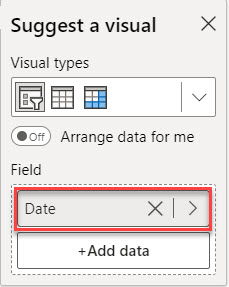
3. Then, using the +Add data option, add Date into the Field.
4. Now you see our date slicer successfully created.
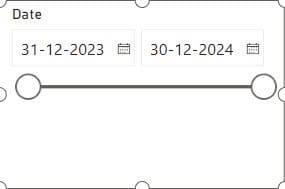
This way, you can create a Power BI date slicer.
Power BI Slicer Date Range Slider
The Power BI Date Range Slider is a user-friendly tool for filtering data within a specified time frame.
To create this, follow the below steps:
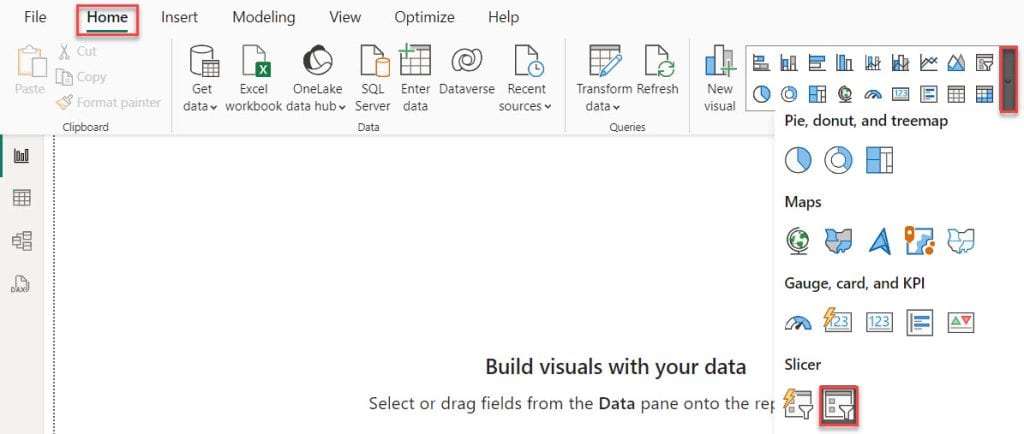
1. Under the Home tab, expand Visual gallery -> Click the Slicer visual.
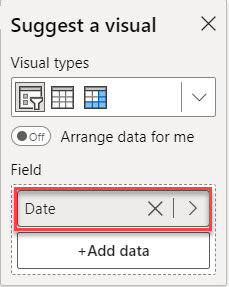
2. Then, using the +Add data option, add Date into the Field.
3. Now you see our date slicer successfully created.
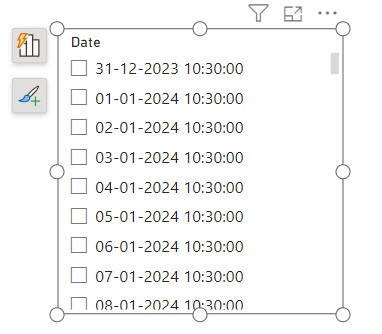
4. Select the visual -> expand Format pane -> expand Slicer settings -> expand Options -> expand Style -> click Between.
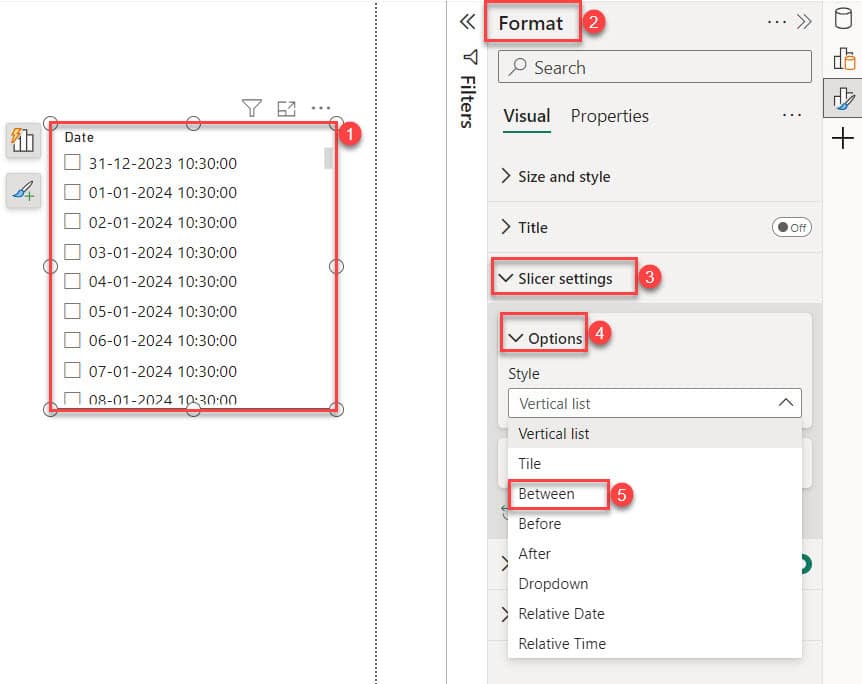
5. This way, you can create a Power BI slicer date range slider.
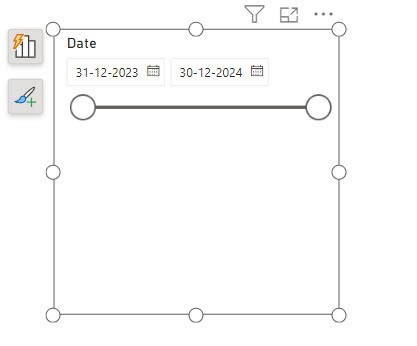
How to use Power BI Date Slicer?
In this example, we see how to use the power BI date slicer.
I hope you create the above Power BI Slicer.
1. Under the Home tab, expand Visual gallery -> Click the Stacked Column chart.

2. Then, using the +Add data option, add Month into the X-axis and add Sales Amount into the Y-axis.
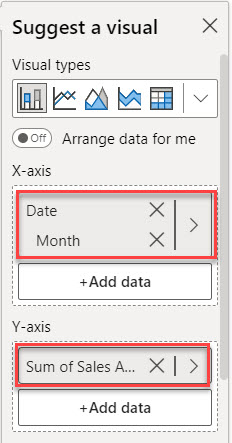
3. Now you can see our visual successfully created.

4. Then, when you adjust the date slider, you’ll see the changes reflected in the visual.
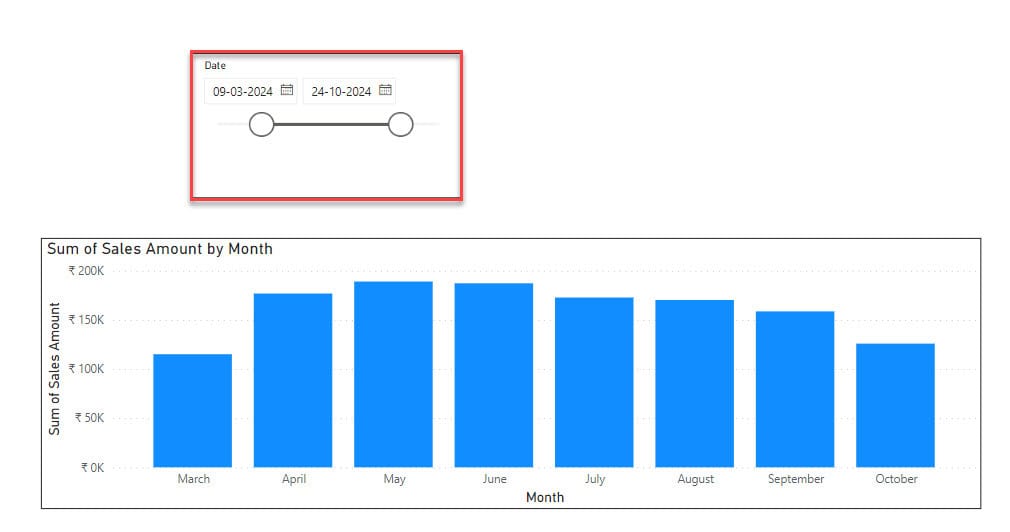
This way, you can use a date slicer in Power BI.
Power BI Calendar Slicer
In Power BI, there isn’t a built-in calendar slicer, but we can make it appear like one by adjusting slicer settings.
Let’s see how we can do this in this tutorial. I hope you loaded the data set in Power BI Desktop.
1. Under the Home tab, expand Visual gallery -> Click the Slicer visual.
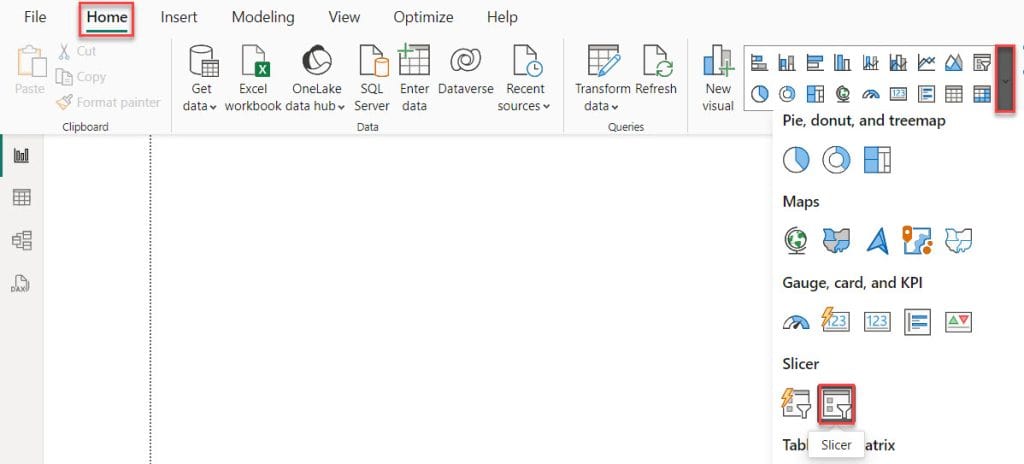
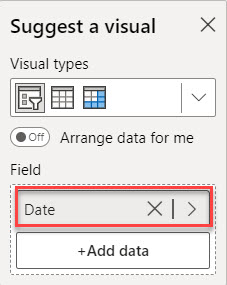
2. Then, using the +Add data option, add Date into the Field.
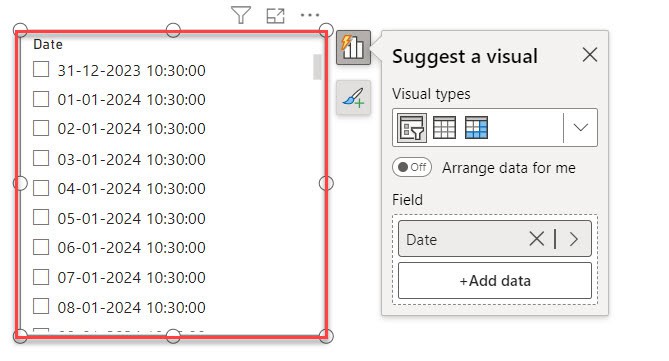
3. Now you can see in the Report view slicer created.
4. Select the visual -> expand Format pane -> expand Slicer settings -> expand Options -> expand Style -> click Between.
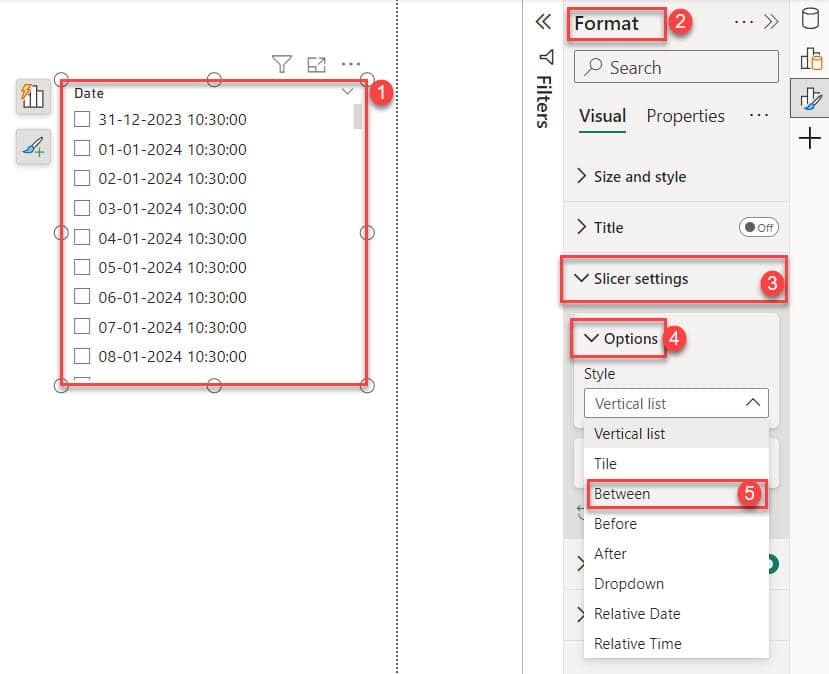
5. Then, the slicer visually changes to the slider.
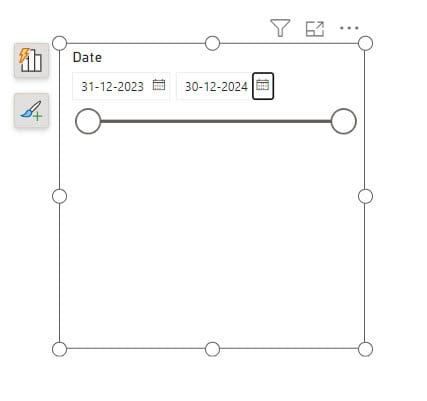
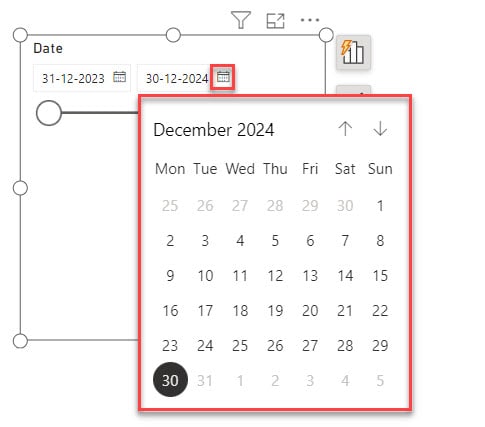
6. When you click on the calendar icon, a calendar will appear.
Single Date Slicer Power BI
Let’s learn how to create a Power BI slicer for single dates.
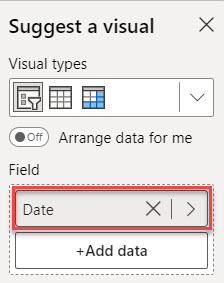
1. Under the Home tab, expand Visual gallery -> Click the Slicer visual.
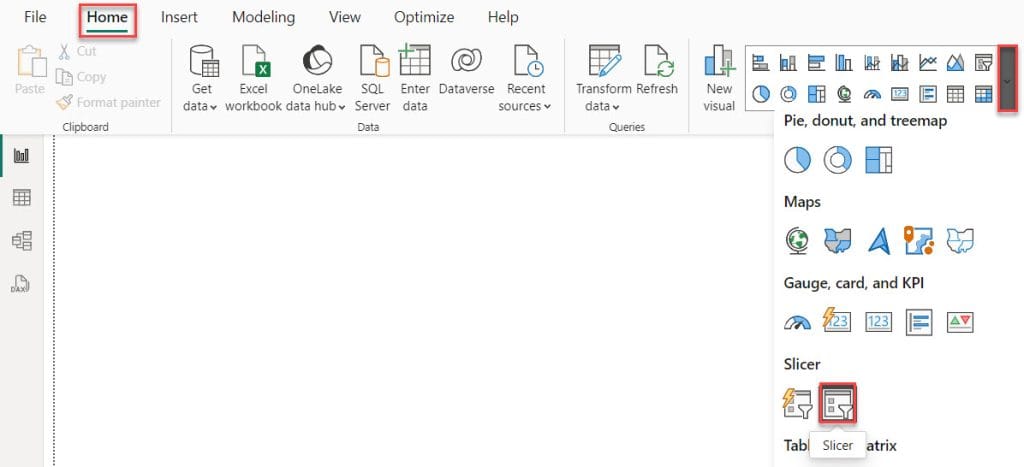
2. Then, using the +Add data option, add Date into the Field.
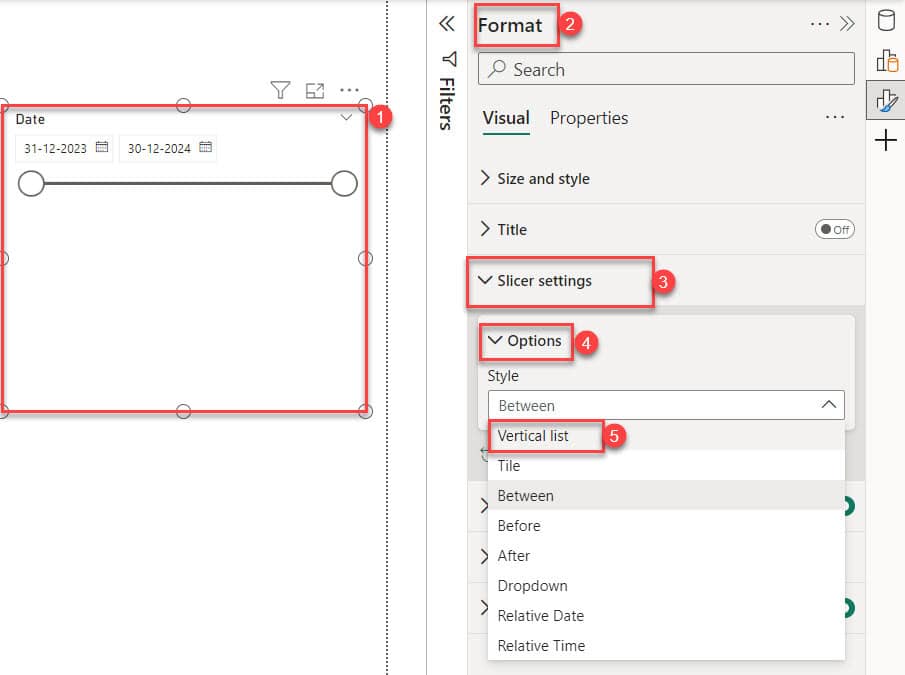
3. Select the visual -> expand Format pane -> expand Slicer settings -> expand Options -> expand Style -> click Vertical list.
4. Now, you can see a single date Slicer in Power BI.
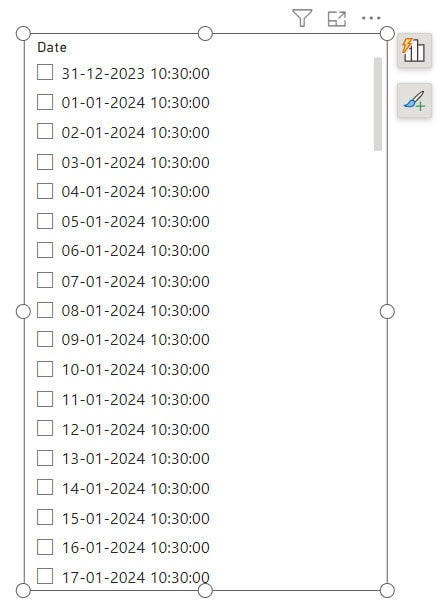
This way, you can create a Power BI Single Date Slicer.
Create a Relative Date Slicer and Filter in Power BI
We can use the relative date slicer or filter to apply time-based filters to any date column in your data model.
Create the relative date range Power BI slicer
To use the relative date slicer, follow the below steps:
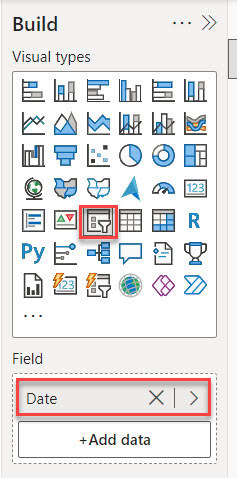
1. Under the Home tab, expand Visual gallery -> Click the Slicer visual. Then, using the +Add data option, add Date into the Field.
2. Select the visual -> expand Format pane -> expand Slicer settings -> expand Options -> expand Style -> click Relative Date.
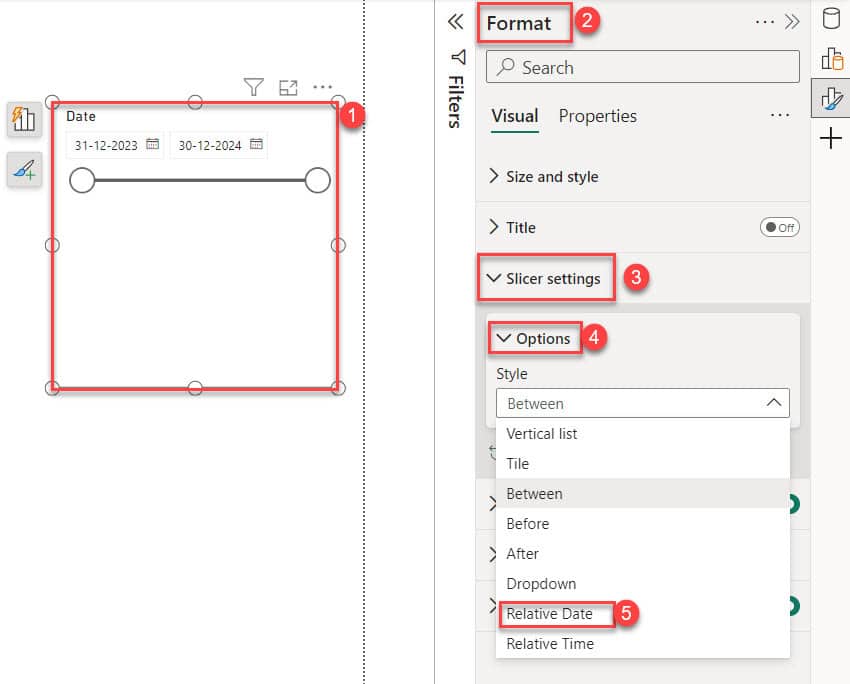
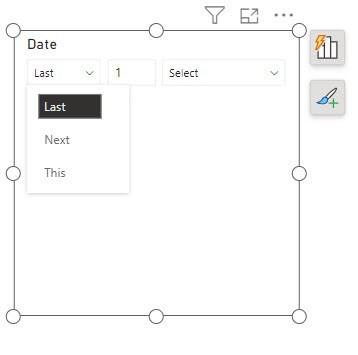
3. Then expand the date slicers. You have the following choices:
- Last
- Next
- This
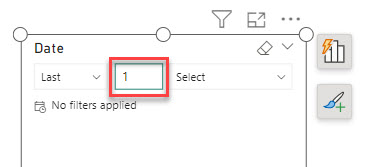
4. In the second (middle) box in the relative date slicer, you enter a number to define the relative date range.
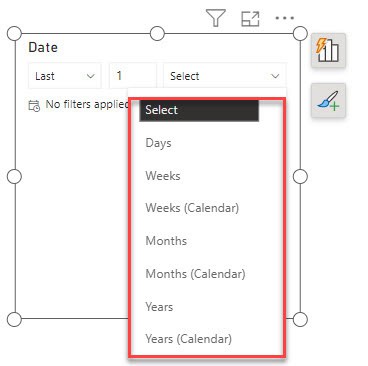
5. In the third box, you choose the unit of time. You have the following options:
- Days
- Weeks
- Weeks (Calendar)
- Months
- Months (Calendar)
- Years
- Years (Calendar)
This way, you can create the relative date range Power BI slicer.
Create the relative date range filter in Power BI
To use a relative date range filter in Power BI. Follow below steps:
I hope you created the above example.
1. Expand the Fields pane.
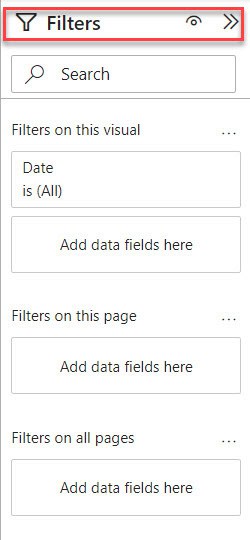
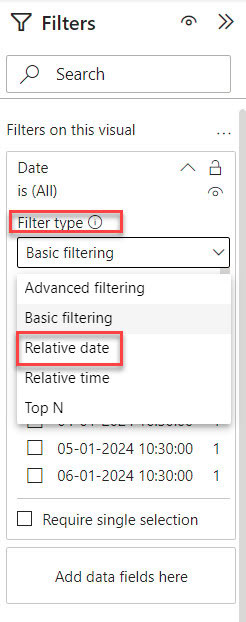
2. Select the Relative date from the Filter type drop-down.
3. You’ll notice three sections to adjust under “Show items when the value changes,” including a middle box where you can enter numbers, similar to the slicer.
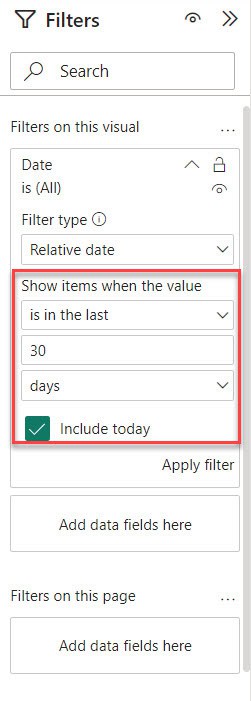
This way, you can create the relative date range filter in Power BI.
Power BI Date Slicer Default to Last 30 Days
Now we see how to set the default last 30 days in Power BI Date Slicer.
Follow the below steps:
1. Open Power BI Desktop and load the data set. Then, in the Data pane, you can see your data set.
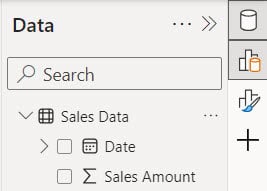
2. Under the Home tab, expand Visual gallery -> Click the Slicer visual.
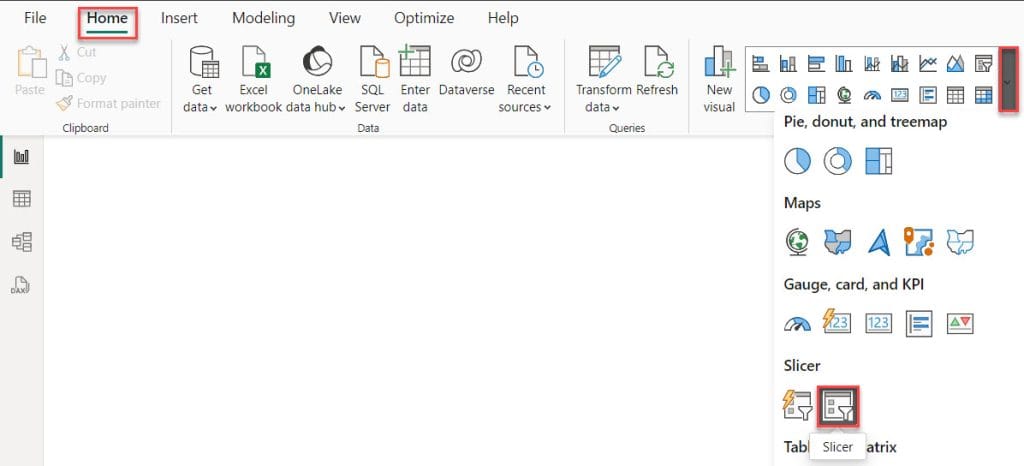
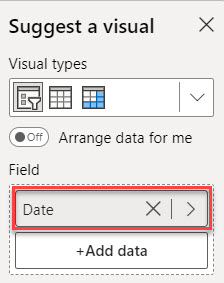
3. Then, using the +Add data option, add Date into the Field.
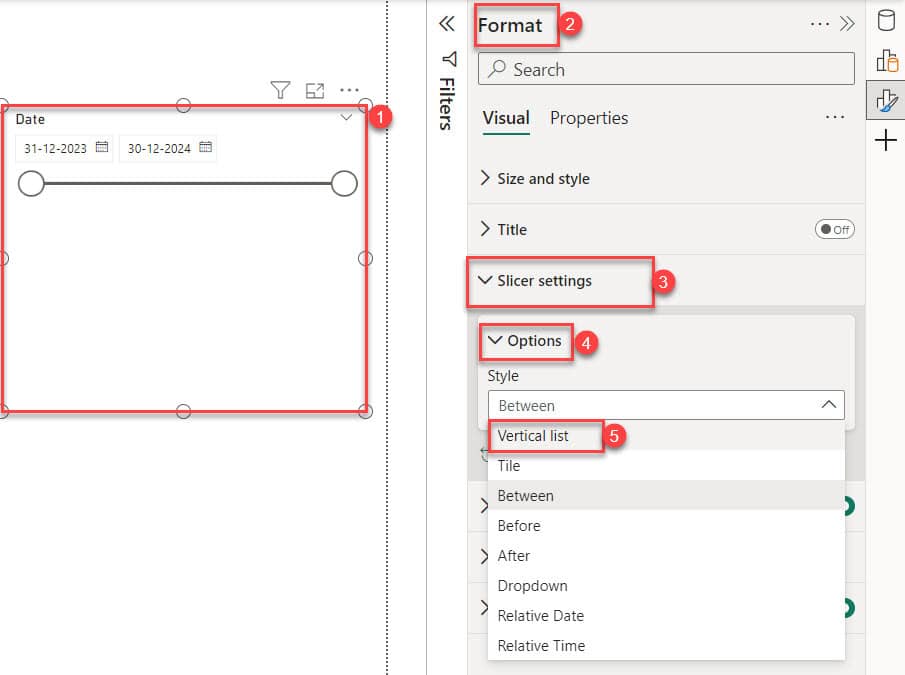
4. Select the visual -> expand Format pane -> expand Slicer settings -> expand Options -> expand Style -> click Vertical list.
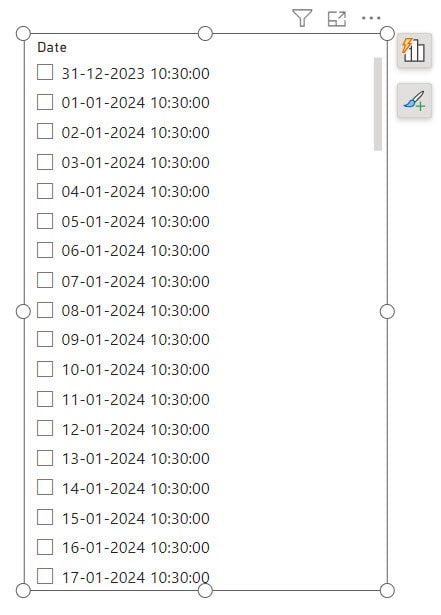
5. Now you see our date slicer successfully created.
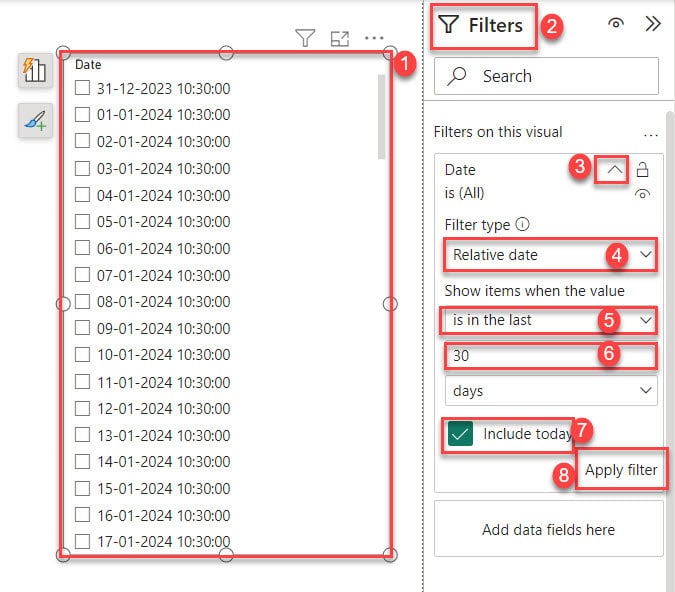
6. Select the slicer. Then, open the “Filters pane” by clicking on “expand.” Next, click on “Date” under the “Filters on this visual” section. Choose “Relative date” as the “Filters type.” Select “Show items when the value is in the last” and enter “30 days” for the date. If you want, you can also check “Include today.” Finally, click on “Apply filter.”
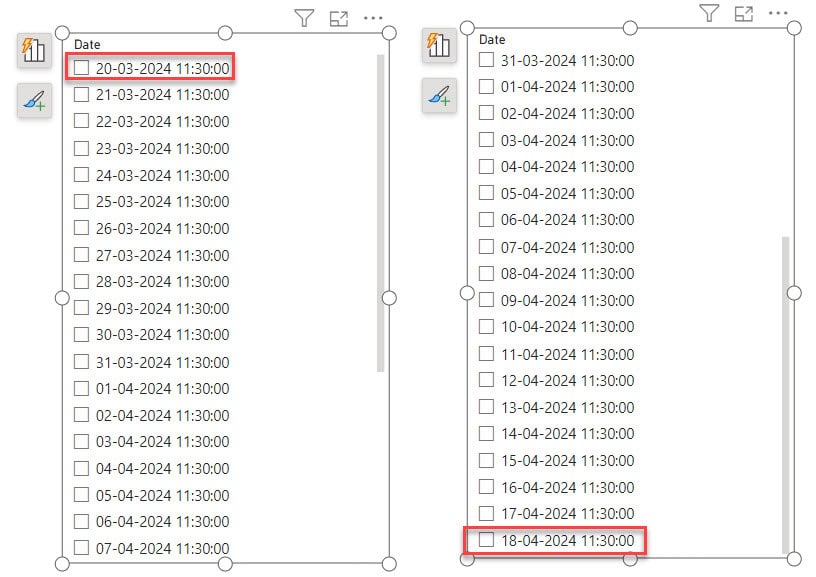
7. After you apply the filter, you’ll notice that the slicer shows dates starting from March 20, 2024, and ending on April 18, 2024, which is today’s date.
This way, you can see how to set the default last 30 days in Power BI Slicer.
Power BI Slicer Month and Year
Here, we’ll display only the month and year from the date in the Slicer in Power BI.
For this example, we already loaded our data set.
To show only the Month and Year in a Date Slicer using Power BI, follow these steps:
1. Under the Home tab, expand Visual gallery -> Click the Slicer visual.
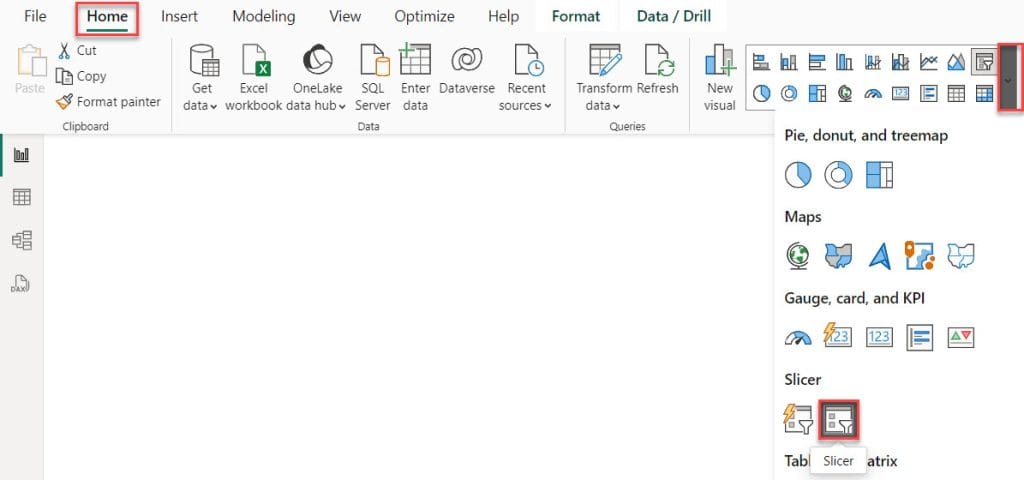
2. Then, using the +Add data option, add Date into the Field. Select Date Hierarchy.
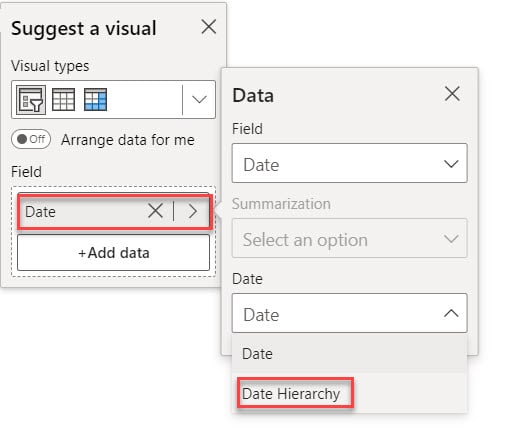
3. Next, delete the Quarter and day options by clicking on the cross icon next to them. Then, expand the year option so you can see the months.
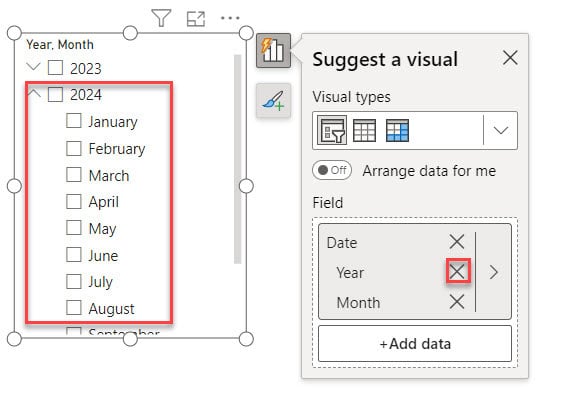
This is how you set up a Date Slicer in Power BI to show the month and year only.
Power BI Date Slicer Last 12 Months
Here’s how to make the Power BI Date slicer show the last 12 months.
In this example, we’ll use the Relative date option in the Date slicer to show the past 12 months in Power BI Desktop. To do this, follow the below steps:
1. Under the Home tab, expand Visual gallery -> Click the Slicer visual.
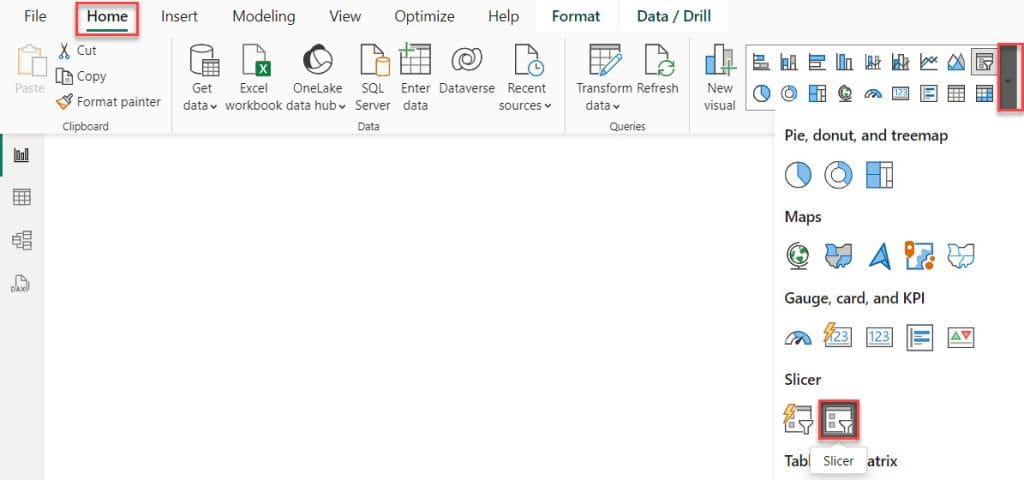
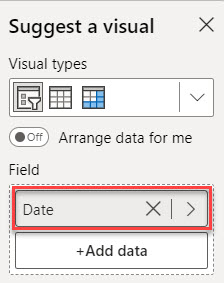
2. Then, using the +Add data option, add Date into the Field.
3. Select the visual -> expand Format pane -> expand Slicer settings -> expand Options -> expand Style -> click Relative Date.
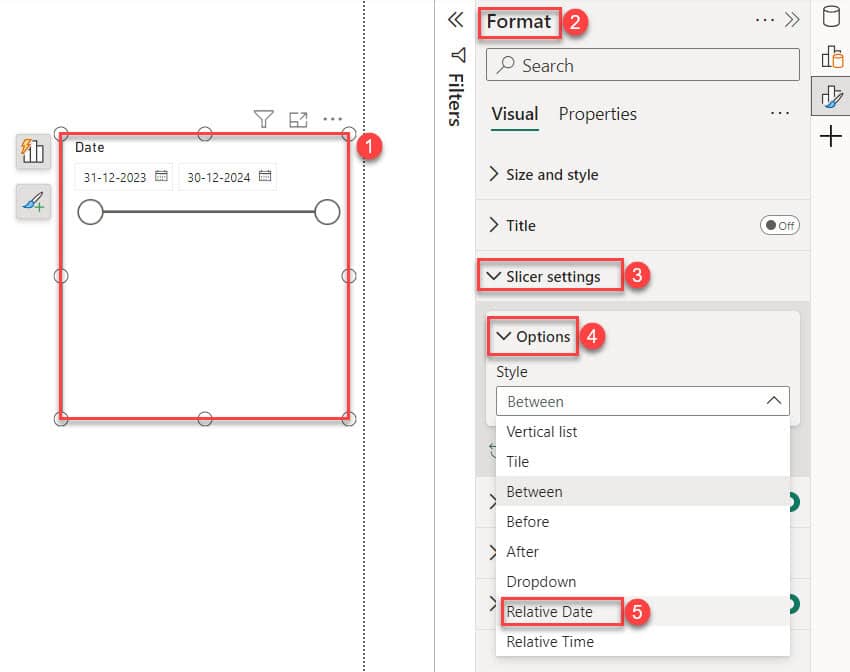
4. After that, choose “Last” and enter “12”, then pick “Months” from the options.
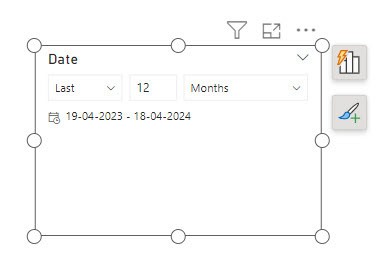
This shows how the Power BI Date Slicer displays the last 12 months.
Also, you may like:
- Power BI Split String
- Create Date Hierarchy in Power BI
- Power BI Group by
- Power Query Date Functions
- Power BI Power Query Examples
- Power Query Create Table in Power BI
This tutorial showed how to use Power BI date slicer effectively, including adding, customizing, and filtering data for better analysis.
We’ve explored various aspects, including the Power BI calendar slicer, single date slicer, defaulting to the last 30 days, slicing by month and year, and selecting the last 12 months.
We also covered how to use the Power BI date slicer, create a date range slider in Power BI, and make a relative date slicer and filter in Power BI.
I am Bijay a Microsoft MVP (10 times – My MVP Profile) in SharePoint and have more than 17 years of expertise in SharePoint Online Office 365, SharePoint subscription edition, and SharePoint 2019/2016/2013. Currently working in my own venture TSInfo Technologies a SharePoint development, consulting, and training company. I also run the popular SharePoint website EnjoySharePoint.com
Similarly, could you post what kind of slicing done on time?