Power BI Date Hierarchy organizes dates into different levels of granularity, such as year, quarter, month, and day.
In this tutorial, we will learn how to create date hierarchy in Power BI and how to work with Power BI add week to date hierarchy. Also, we will cover the topics below:
- Power BI auto create date hierarchy
- Add date hierarchy Power BI
- Power BI create date hierarchy from date column
- Power BI date hierarchy show month and year
- how to remove the date hierarchy in Power BI
- Power BI date time hierarchy hour
Power BI Date Hierarchy
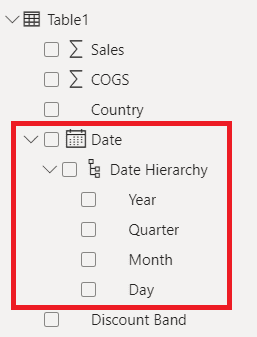
In Power BI, when you use date data, it’s smart enough to organize it into a hierarchy for you. This is handy for viewing your data by year, quarter, month, and day. The Date hierarchy in Power BI helps you organize your data table so you can easily explore and update it by different time periods.
The Power BI Date hierarchy looks like this:
Power BI Auto Create Date Hierarchy
When you load date data into Power BI Desktop, Power BI automatically arranges it in a hierarchy. If it doesn’t do this, you might need to turn on “auto date/time” either globally or just for the current file.
To do this, follow the below steps:
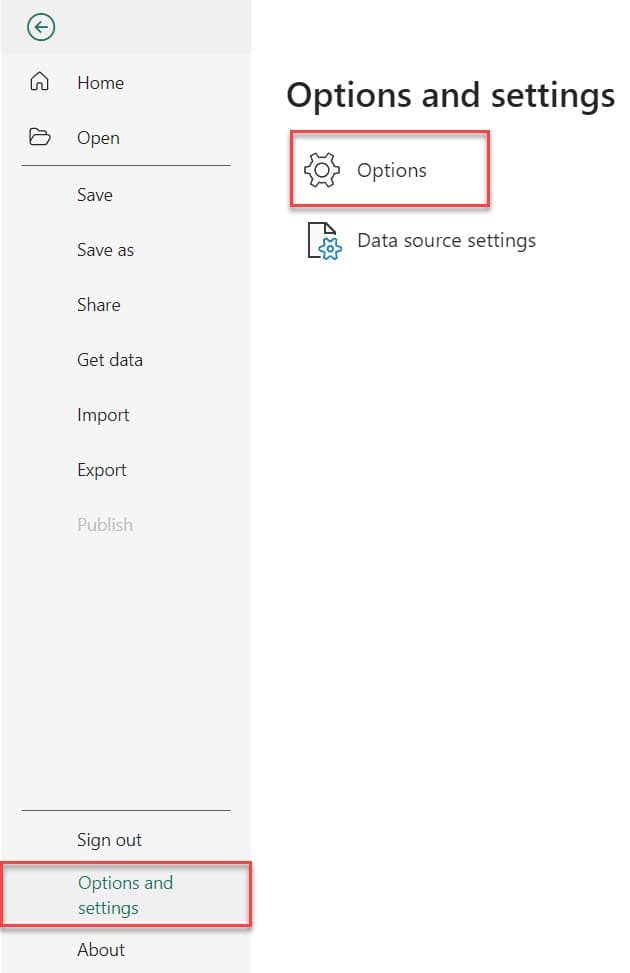
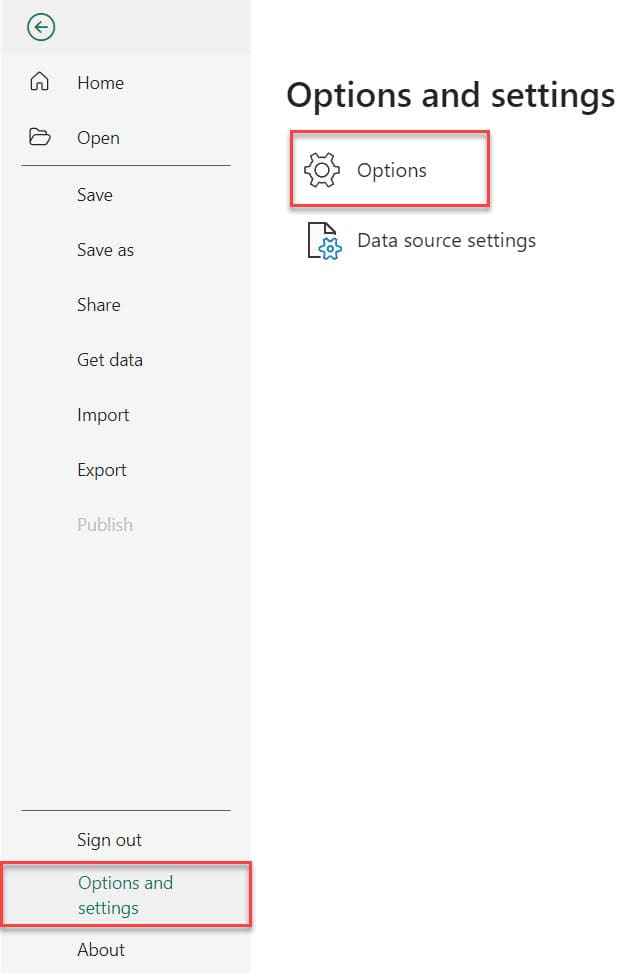
1. In Power BI Desktop, click on the “File” tab. Then, select “Options and settings” and choose “Options.”
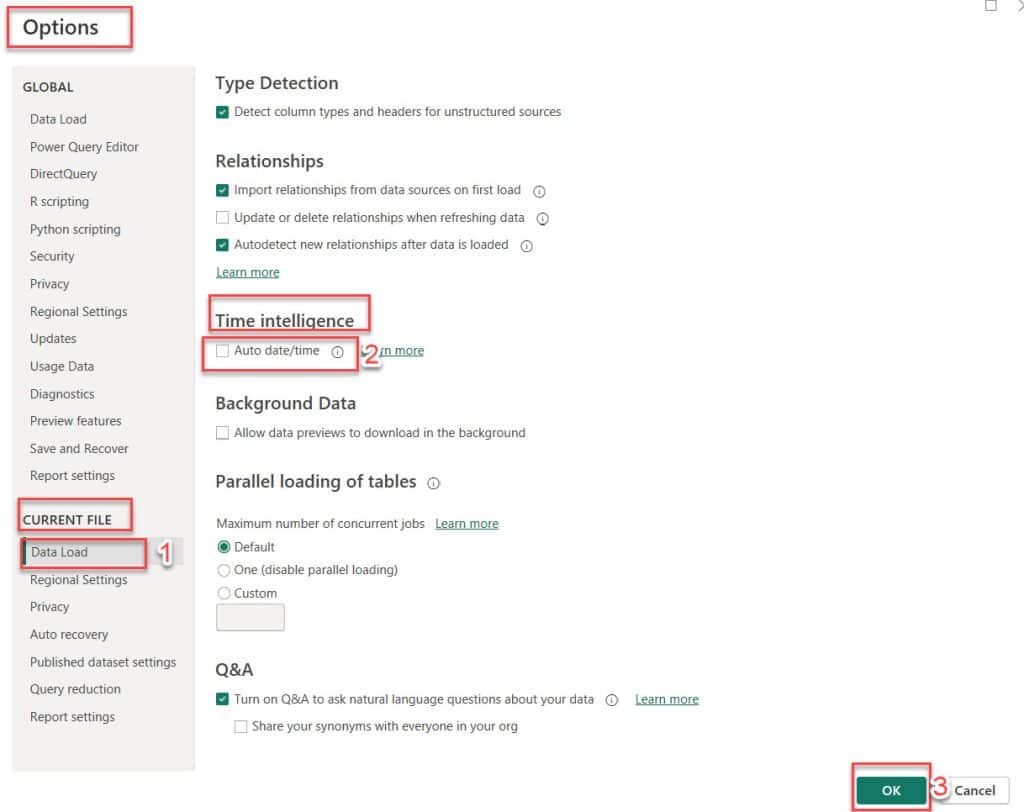
2. Then the Options window opens. Check the Auto date/time for new files under Data Load, both GLOBAL and CURRENT FILE. Then click OK.
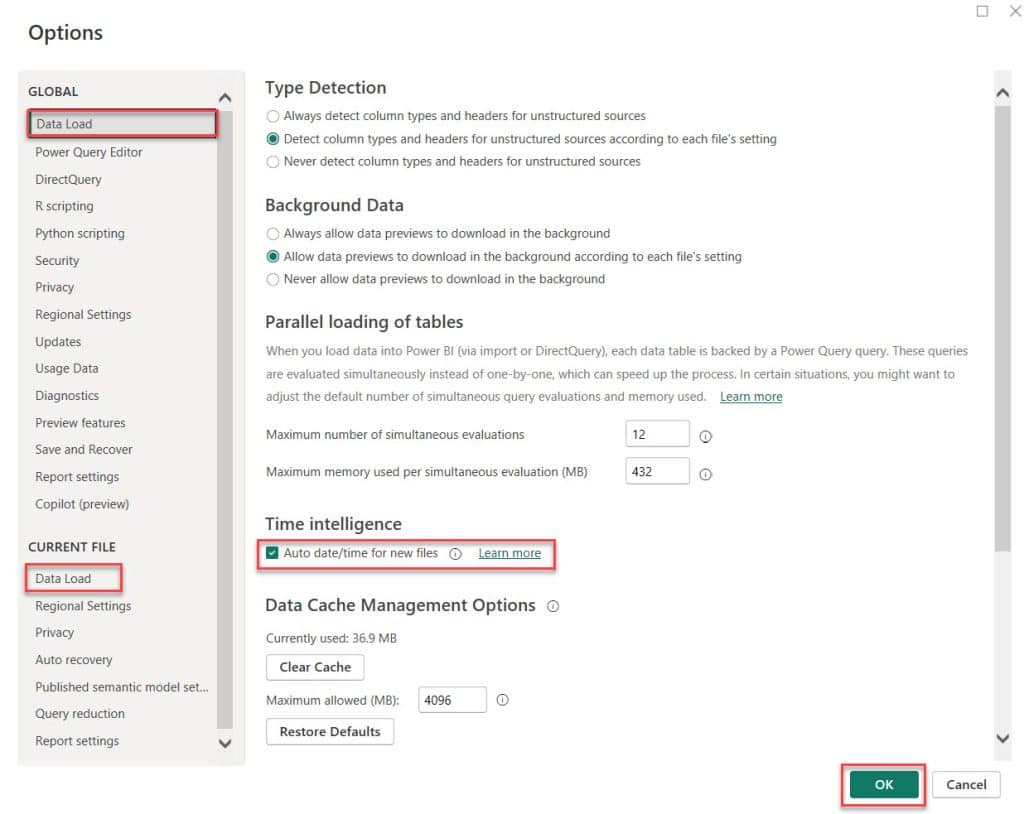
By checking this option, Power BI will automatically create a date hierarchy in the data model. This makes it easier to analyze your data by dates in Power BI reports.
How to Create Date Hierarchy in Power BI
In this example, we will see how to create date hierarchy in Power BI.
1. Open Power BI Desktop and load the data set. Then, in the Data pane, you can see your data set.
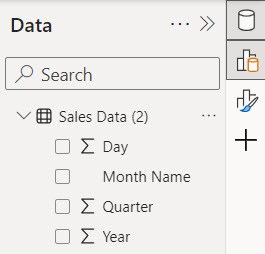
2. Select the Year column -> click on the More icon (…) -> Click on the Create hierarchy option.
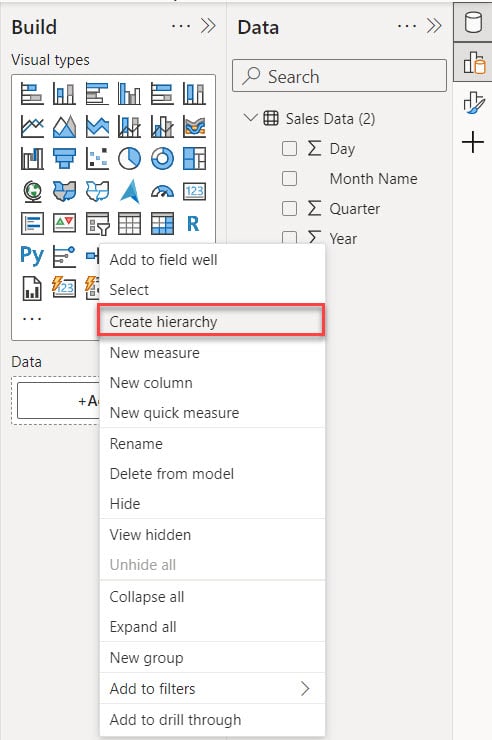
3. Then, you can see the new hierarchy created as the Year hierarchy. Then rename it as Date hierarchy.
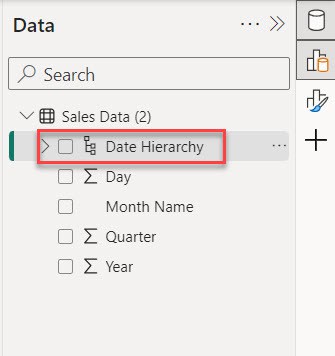
This way, you can create a date hierarchy.
Add Date Hierarchy Power BI
In this example, we see how to add columns to the Date hierarchy in Power BI.
I hope you created a date hierarchy in the above example.
1. In the Quarter column, click on the More icon (…), then select “Add to hierarchy” and click on “Date Hierarchy“.
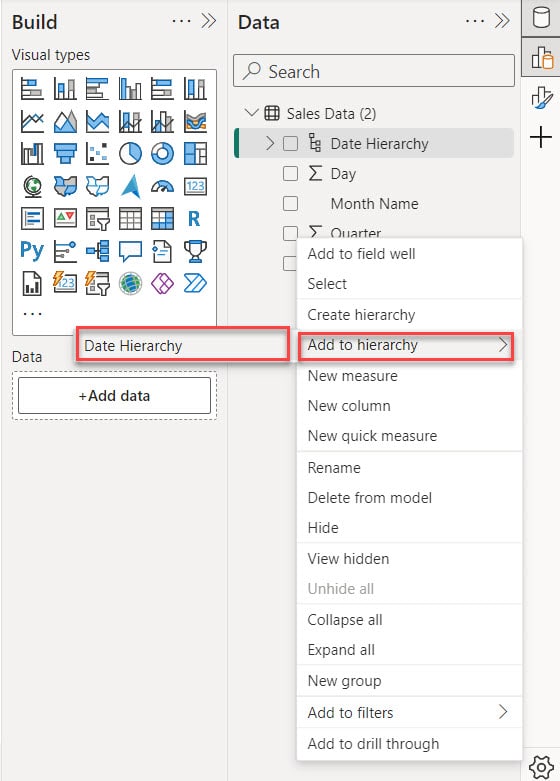
2. Then you can see the Quarter column added to the Date Hierarchy.
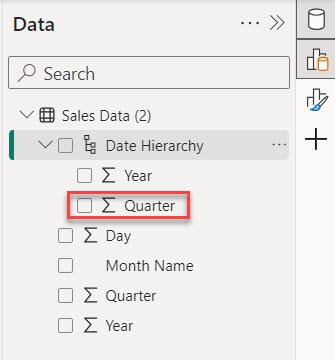
3. In the same way I can add Month and Day columns into Date Hierarchy.
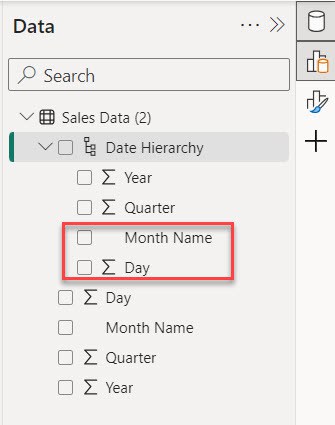
This way, you can add a column to the date hierarchy.
Power BI Create Date Hierarchy From Date Column
To create a date hierarchy from the date column in Power BI, refer to the example below.
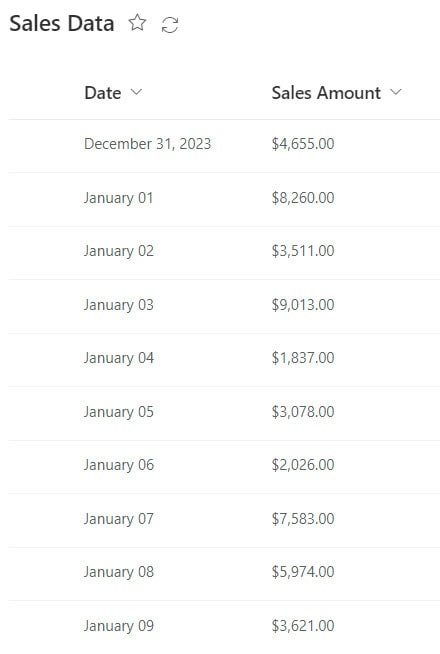
I have a SharePoint list named Sales Data with two different columns:
- Date – Date and time
- Sales Amount – Currency
Now, I want to create a Power BI Date hierarchy using this SharePoint Date column.
Now follow the below steps:
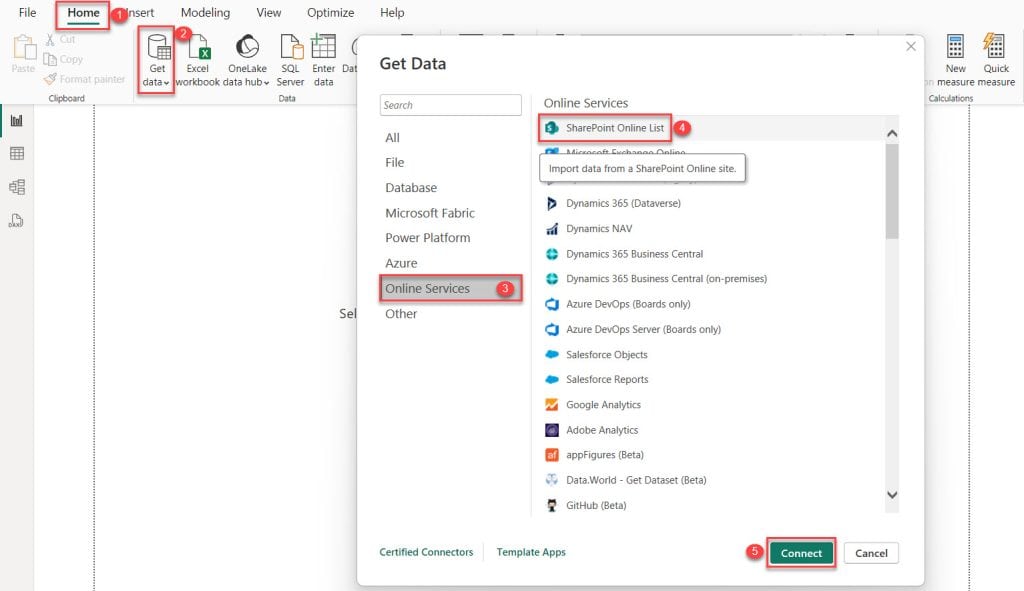
1. Open Power BI Desktop, go to the “Home” tab, and select “Get data.” In the “Get Data” window, choose “Online Services,” then click on “SharePoint Online List,” and click “Connect.”
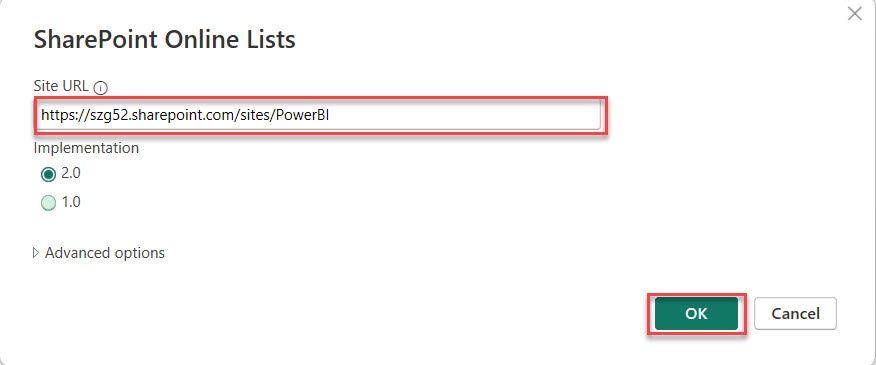
2. You can see “SharePoint Online List,” a dialog box will appear asking for the SharePoint site URL. Enter the URL and click “OK” to continue. If it’s your first time creating a report, it might ask for your username and password to access the SharePoint online list or site.
3. After that, it will display all the lists and libraries on the SharePoint site. Select the list you want to use in this Power BI report. If your list has clean data, click the Load option. Otherwise, click Transform Data.
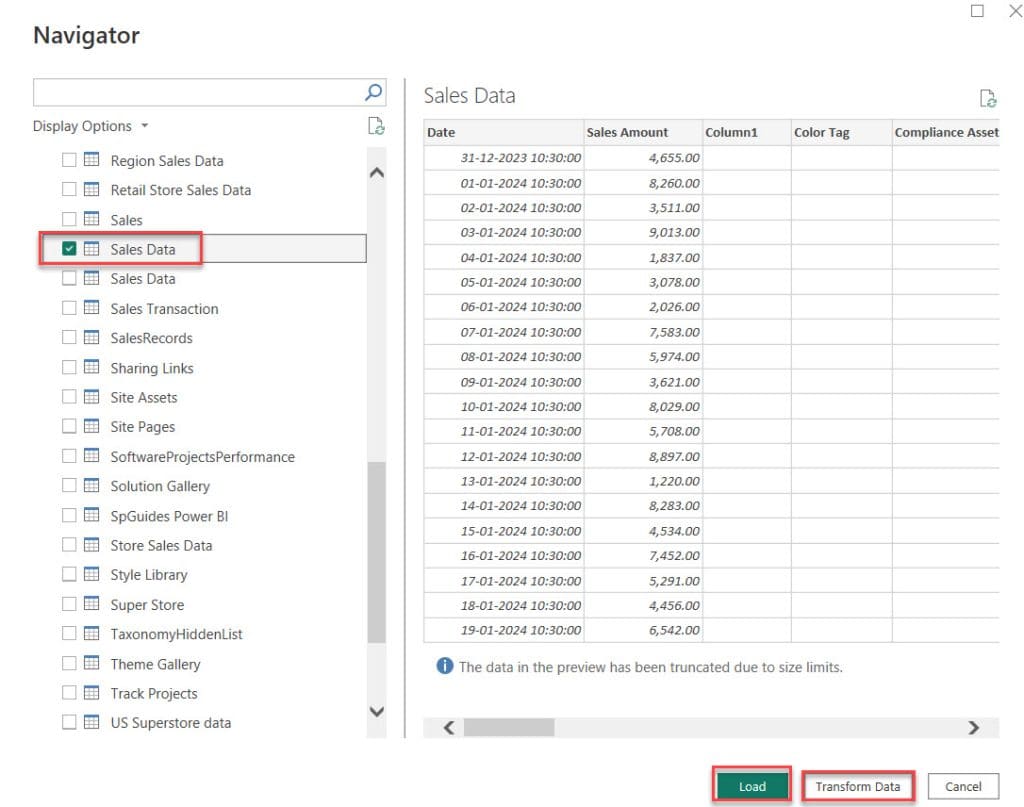
4. In my case, I clicked “Transform Data.” This action opens the Power Query Editor, where you can make adjustments. I’m removing some columns now. To do this, go to the top navigation, click “Home,” and then select “Choose Columns” from the ribbon.

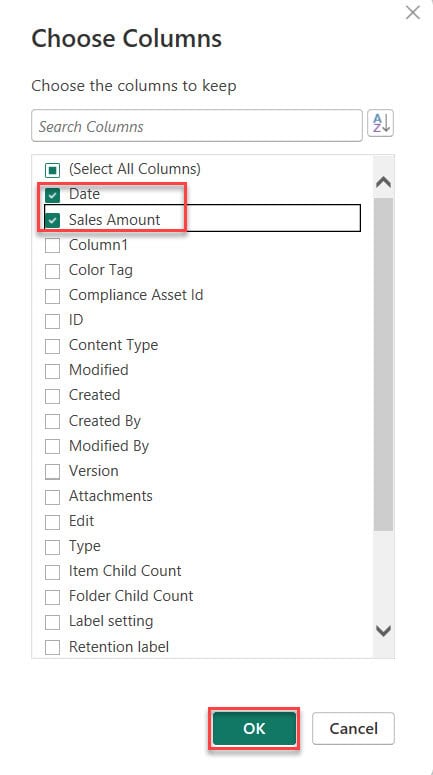
5. When you click, the “Choose Columns” dialog box pops up. Power BI usually loads all the list columns by default. You can select the columns you want to use for your report. After selecting, click “OK.”
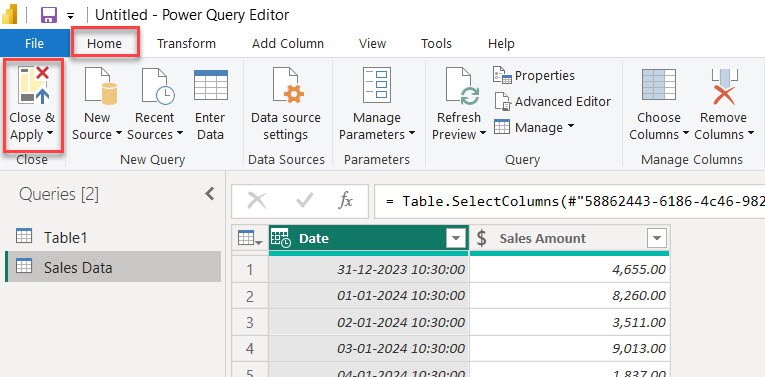
6. Click on the “Home” option in the top navigation, then click Close & Apply on the top left side.
7. After that, you’ll notice that a “Date Hierarchy” is automatically created in the Data pane.
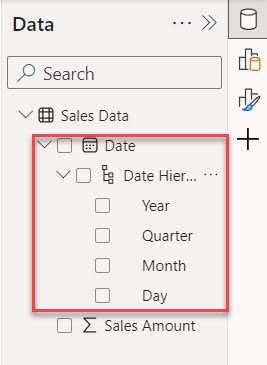
This is how to create a date hierarchy from the date column in Power BI.
Power BI Add Week to Date Hierarchy
In this example, we see how to add a week to the date hierarchy.
To do this, let’s create a week column:
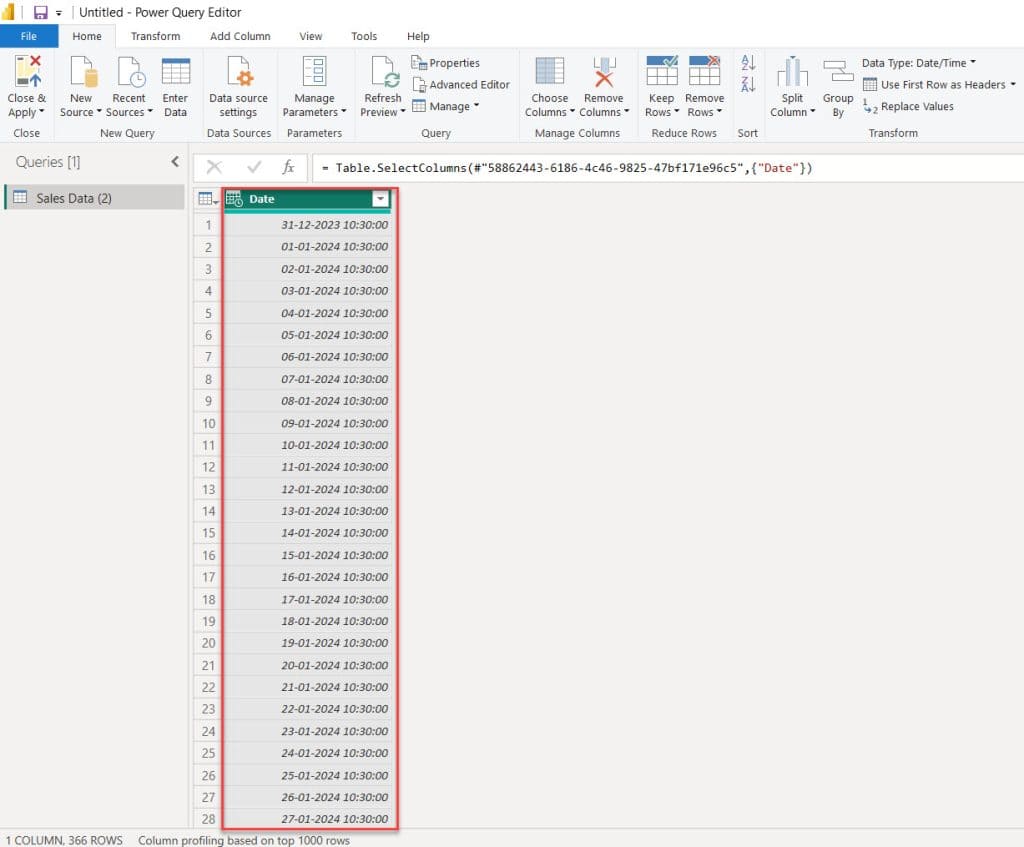
1. In the Power Query Editor, load the Date column from your data source.
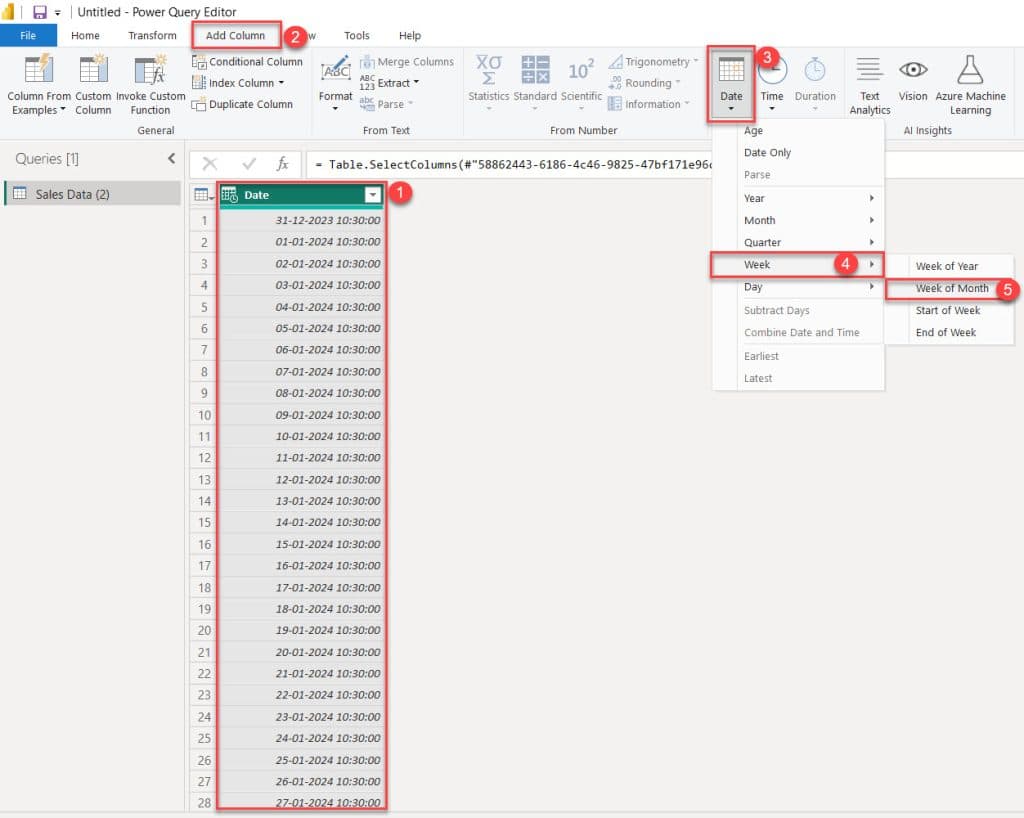
2. Then select the Date column -> click Add Column tag -> expand the Date -> select Week -> click Week of Month.
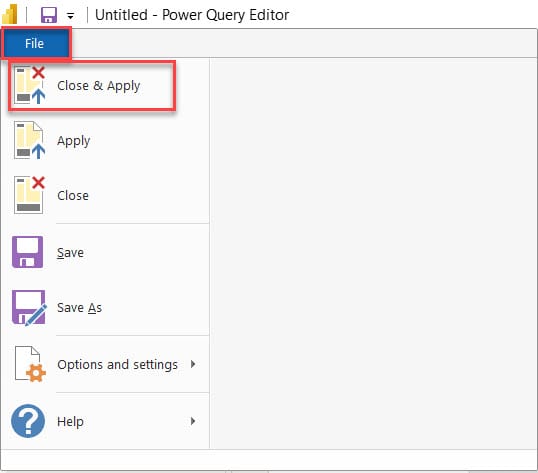
3. In the File tab, click Close & Apply.
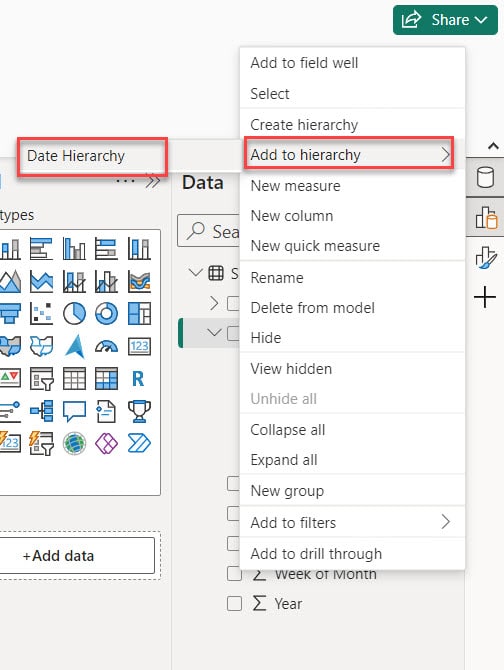
4. In the Week of Month column, click on the More icon (…), then select “Add to hierarchy” and click on “Date Hierarchy“.
5. Then, you can see the Week of Month column added to the Date Hierarchy.
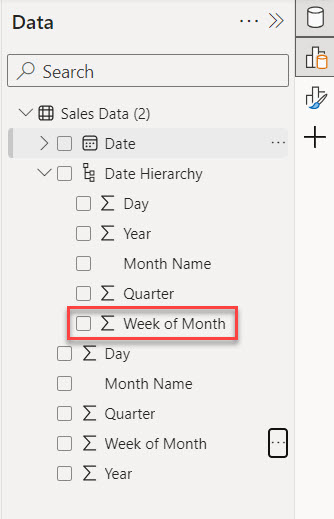
This way, you can add a Week column in the Date Hierarchy.
Power BI Date Hierarchy Show Month and Year
In this example, we see the date hierarchy shows month and year in Power BI.
We’ll make a Stacked column chart to display Sales based on Month and year.
1. Under the Home tab, expand the Visual gallery and select the Stacked column chart.

2. Then, using the +Add data option, add the date hierarchy(Year and Month) into the X-axis and the Sales Amount into the Y-axis.
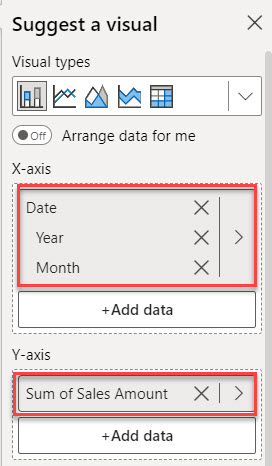
3. Then click on the drill-down icon (tree icon), and you’ll see the Year Month on the axis.
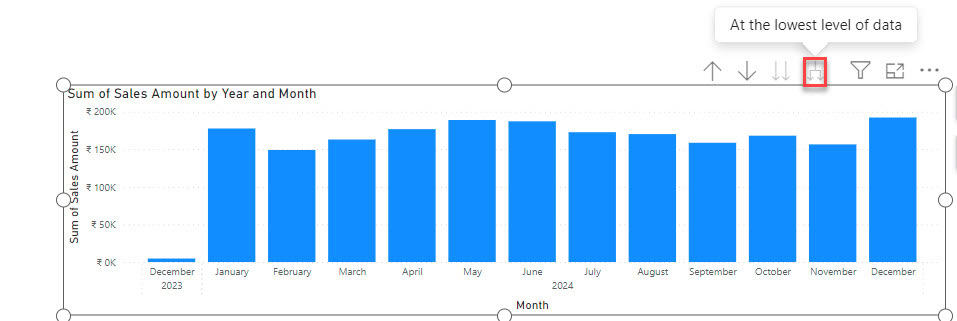
This is an example of the Power BI date hierarchy showing month and year.
Power BI Date Hierarchy Remove
Let’s see how to remove the date hierarchy in Power BI.
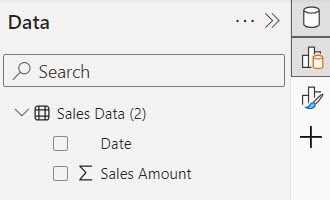
On the left side is a screenshot displaying the date hierarchy. On the right side is the screenshot after removing the date hierarchy how it looks.
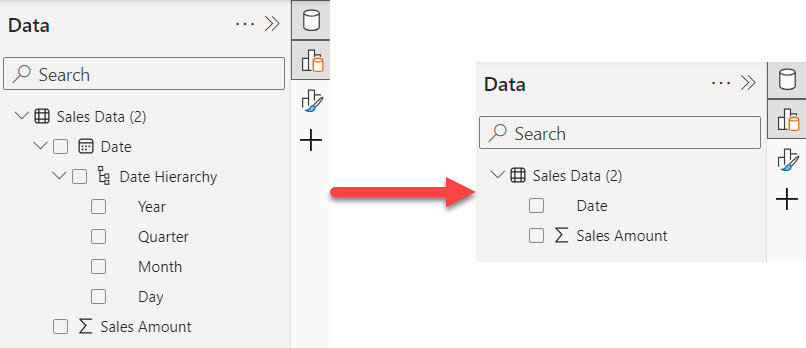
To remove auto date hierarchy, follow the below steps:
1. Click File -> Options and Settings -> Options.
2. Click on “Current File,” then go to “Data Load,” and choose “Time Intelligence.” Uncheck the “Auto date/time” checkbox, and click “OK.”
3. Then you see the date hierarchy removed.
This way, you can remove the date hierarchy in Power BI.
Power BI Date Time Hierarchy Hour
In this example, we see how to create a time hierarchy.
1. Open Power BI Desktop and load the data set. Then, in the Data pane, you can see your data set.
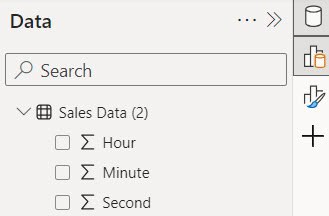
2. Select the Hour column -> click on the More icon (…) -> Click on the Create hierarchy option.
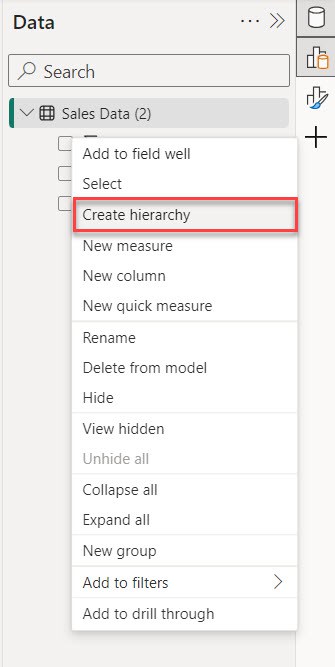
3. In the Minute column, click on the More icon (…), then select “Add to hierarchy” and click on “Time Hierarchy“.
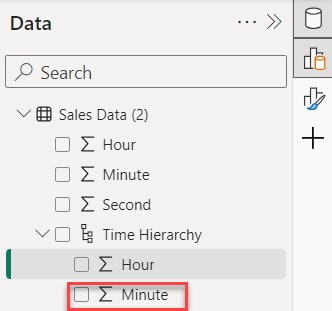
4. In the same way, you can add a Second column in the time Hierarchy.
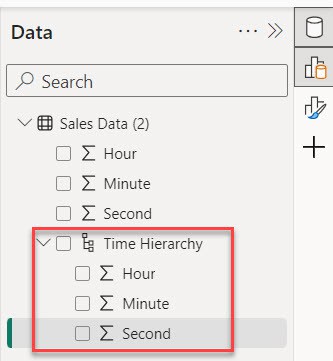
This way, you can create a time hierarchy in Power BI.
Also, you may like:
- Power BI Date Slicer
- Add Conditional Column in Power BI
- How to remove Date Hierarchy in Power BI
- Power BI sort table by Date
- Power BI Date Slicer By Month
- Power BI Group by
- Power Query Create Table in Power BI
I hope this tutorial gave you all the information about Date hierarchy Power BI, how to create date hierarchy in Power BI, Power BI add week to date hierarchy, and many more:
- Working with Power BI date hierarchy week
- Power BI create date hierarchy from date column
- Power BI date hierarchy show month and year
- How to remove Power BI Date Hierarchy
I am Bijay a Microsoft MVP (10 times – My MVP Profile) in SharePoint and have more than 17 years of expertise in SharePoint Online Office 365, SharePoint subscription edition, and SharePoint 2019/2016/2013. Currently working in my own venture TSInfo Technologies a SharePoint development, consulting, and training company. I also run the popular SharePoint website EnjoySharePoint.com
didn’t work. have to do more than enable preview settings.
How to add Minutes and Hours to Date Hierarchy without those fields in the table.