In this Power BI Tutorial, we will learn about the Power BI Group By function and Power BI Count Group By. Also, we will cover the topics below:
- Power BI group by date
- Power BI group by month
- Power Query group by concatenate text
- How to use group by dax function in Power BI
- Power BI Group By Multiple Columns
Power BI Group By function
Power BI GROUP BY is a function used in the query editor or in DAX (Data Analysis Expressions) to combine data based on certain criteria. The Power BI GROUPBY DAX function groups data by gathering information from two different tables.
Syntax:
GROUPBY (<table> [, <groupBy_columnName> [, <groupBy_columnName> [, …]]] [, <name>, <expression> [, <name>, <expression> [, …]]])Where,
- GROUPBY = This function is used in DAX (Data Analysis Expressions) to group data based on certain criteria.
- <table> = This is the table you want to group. It’s the source of the data you’re working with.
- <groupBy_columnName> = These are the columns in the table that you want to use to group your data. (For example, if you’re working with a table of sales data, you might want to group the data by region or product category.)
- <name> = It is the name you want to give to the new column.
- <expression> = It is the calculation you want to perform to generate the values for that column.

Power BI Group by Dax
Let’s see, you want to analyze your sales data to understand which product categories are performing the best in terms of revenue.
I have a SharePoint List [Sales] that includes information such as product category, sales quantity, and revenue.
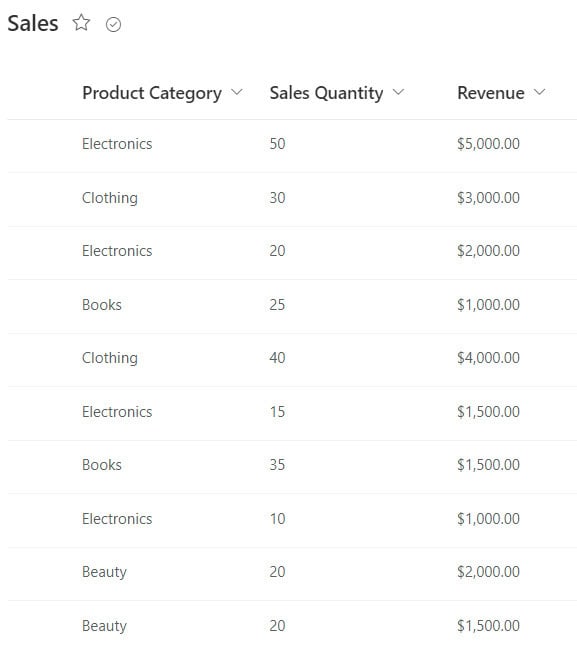
To do this, follow the below steps:
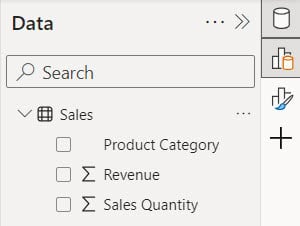
1. First, open Power BI Desktop and load the SharePoint list. Then, you will see the dataset in the Data pane.
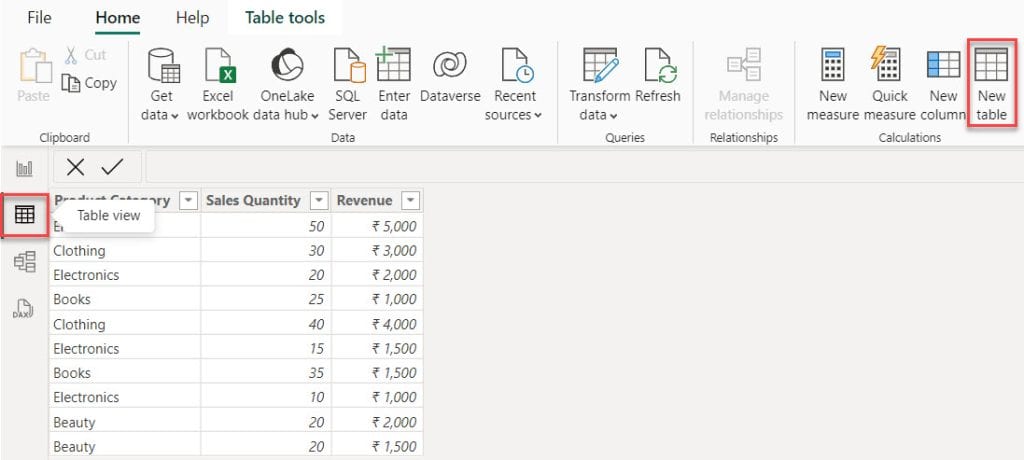
2. Next, navigate to the Table view and click “New table” under the Home tab.
3. Then, in the formula bar, put the below expression. Then click the Commit button.
TotalSalesByCategory =
GROUPBY(
    Sales,
    Sales[Product Category],
    "TotalSalesQuantity", SUMX(CURRENTGROUP(), Sales[Sales Quantity]),
    "TotalRevenue", SUMX(CURRENTGROUP(), Sales[Revenue])
)
Where,
- TotalSalesByCategory = This is the name of the table that we’re creating a new table called TotalSalesByCategory.
- GROUPBY() = This function groups rows together based on a specified column.
- Sales = It specifies the table (Sales) from which data will be grouped.
- Sales[Product Category] = This indicates the column (Product Category) by which the data will be grouped.
- “TotalSalesQuantity”, SUMX(CURRENTGROUP(), Sales[Sales Quantity]) = It calculates the total sales quantity for each group by summing up the Sales Quantity column within the current group.
- “TotalRevenue”, SUMX(CURRENTGROUP(), Sales[Revenue]) = It calculates the total revenue for each group by summing up the Revenue column within the current group.

4. Then you can see in the table view a new table created.
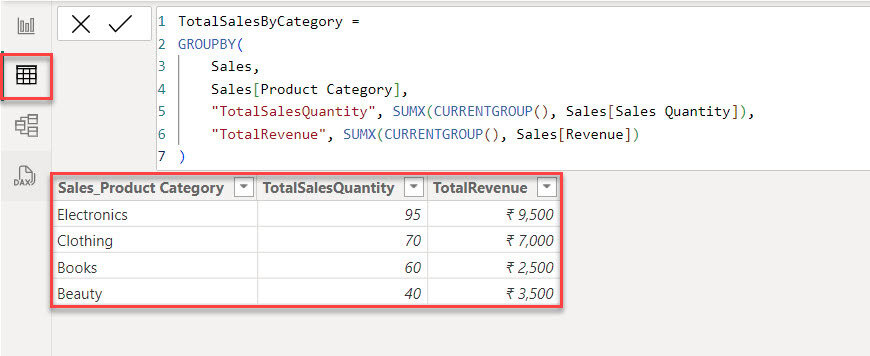
This way, you can see which categories are bringing in the most revenue(i.e., electronics) and make informed business decisions.
Power BI Count Group By
Here, we will see an example of a count group by Power BI.
Now Follow the below steps:
1. Open Power BI Desktop, then under the Home tab, click Enter data.

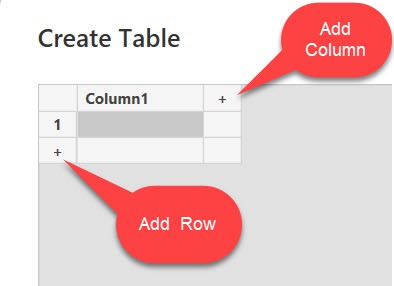
2. Then the below Create Table dialog box will appear. We use the ‘+‘ symbols to add new columns and rows.
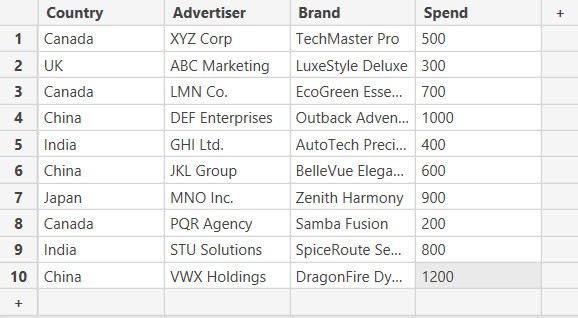
3. We can add data to the table by typing it into the grid.
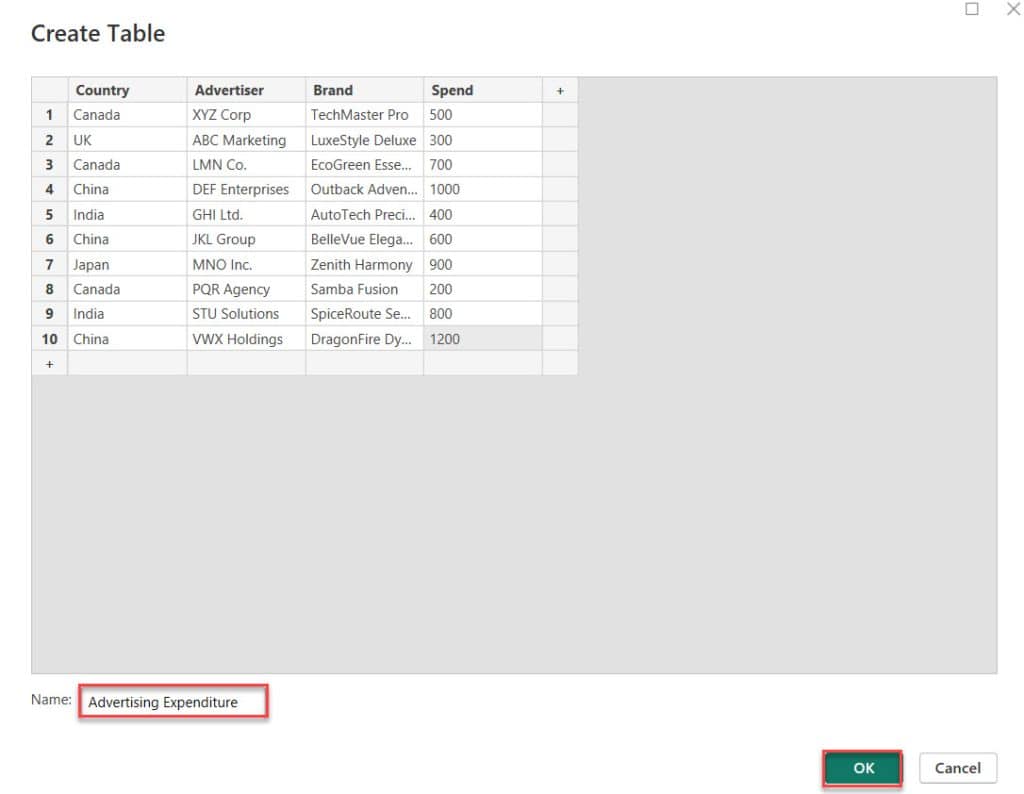
4. Now, our table is created. Then, specify the table name under the Name field and Click OK.
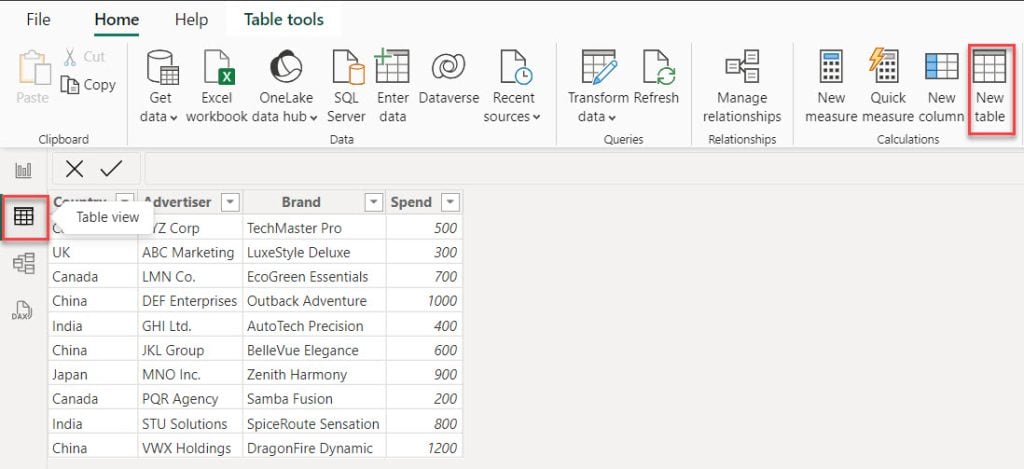
5. Next, navigate to the Table view and click “New table” under the Home tab.
6. Then, in the formula bar, put the below expression. Then click the Commit button.
Table =
GROUPBY(
		'Advertising Expenditure',
		'Advertising Expenditure'[Country],
		"Total Brand",
		COUNTX(
			CURRENTGROUP(),
			'Advertising Expenditure'[Brand]
		)
	)
Where:
- GROUPBY = This function groups data based on specified criteria.
- ‘Advertising Expenditure’,’Advertising Expenditure'[Country] = This specifies the table and the column from which data is grouped. In this case, the table is ‘Advertising Expenditure’, and it’s grouped by the column ‘Country’.
- “Total Brand” = This is the name given to the new column created in the result, representing the total number of brands.
- COUNTX(CURRENTGROUP(),’Advertising Expenditure'[Brand]) = It counts the number of items in the specified column (‘Brand’ in this case) within each group.
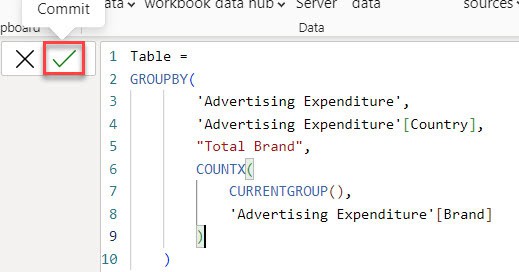
7. Then you can see in the table view a new table created.
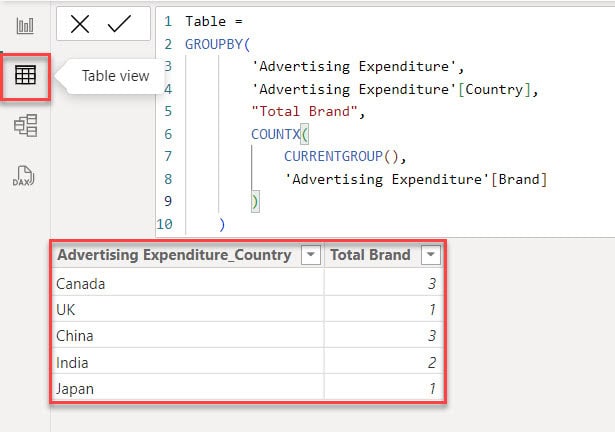
This way, you can Count Group By in Power BI.
Power BI Group By Date
Imagine you own a small bakery business and sell various baked goods, such as bread, cakes, and pastries.
You want to analyze your sales data to understand your bakery’s performance over time and identify trends, which will help you make informed business decisions.
We have an Excel file named BakerySales that contains the Date, Product, Quantity, and Revenue columns.
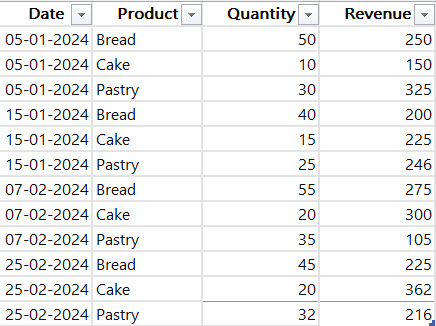
Now follow the below steps:
1. First, open Power BI Desktop and load the Excel. Then, you will see the dataset in the Data pane.
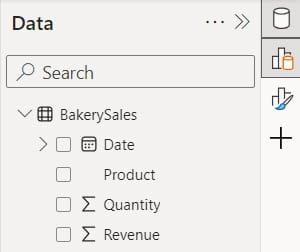
2. Under the Home tab, click Transform date.

3. In the Power Query Editor, under the Transform tab, click Group By.
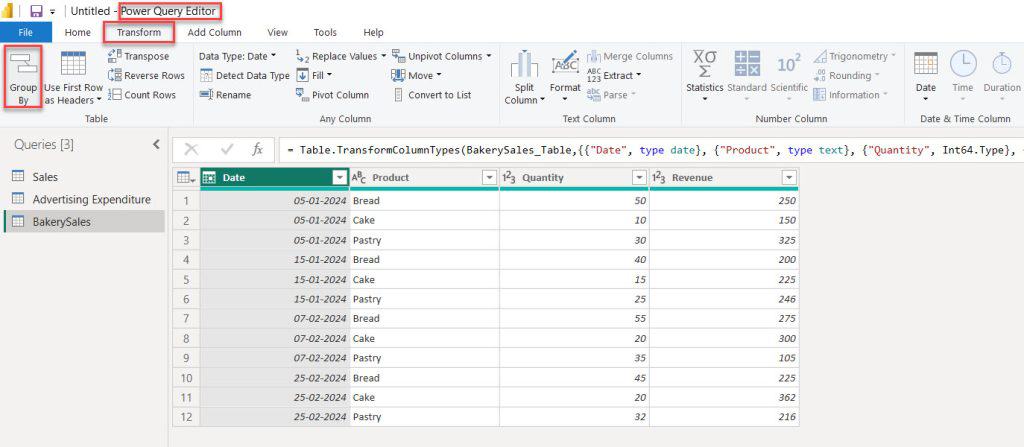
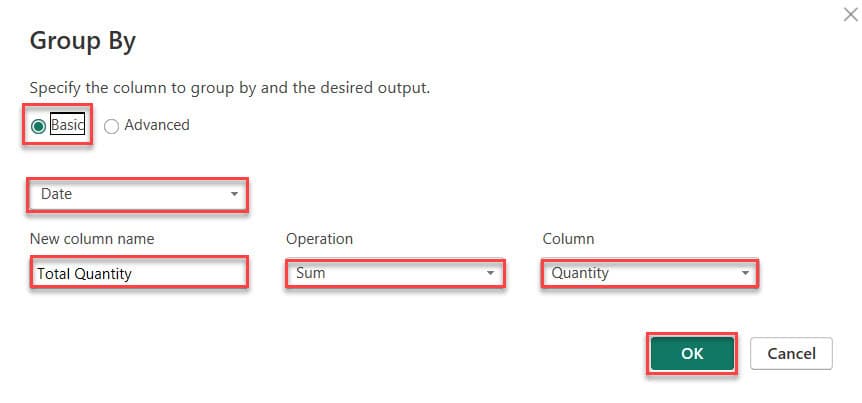
4. Once the Group By window opens, choose the “Basic” option. After that, select the “Date” columns. Next, name the column and choose “Sum” as the operation. Finally, select the “Quantity” column. Then click OK.
5. So you can see the Total Quantity value based on the grouped date column using Power Query.
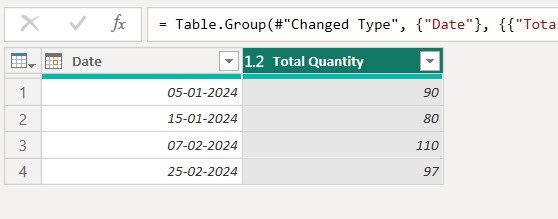
This way, you can create a Power BI Group By date.
Power BI Group By Month
Now, let’s learn how to group sales by month using the GroupBy function in Power BI.
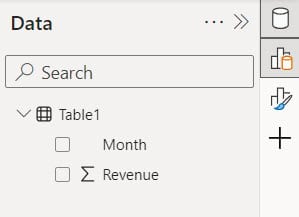
For this example, I am using below table:
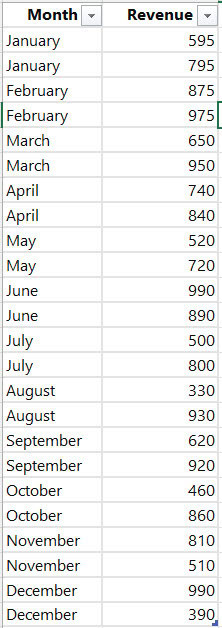
Now follow the below steps:
1. First, open Power BI Desktop and load the Excel. Then, you will see the dataset in the Data pane.
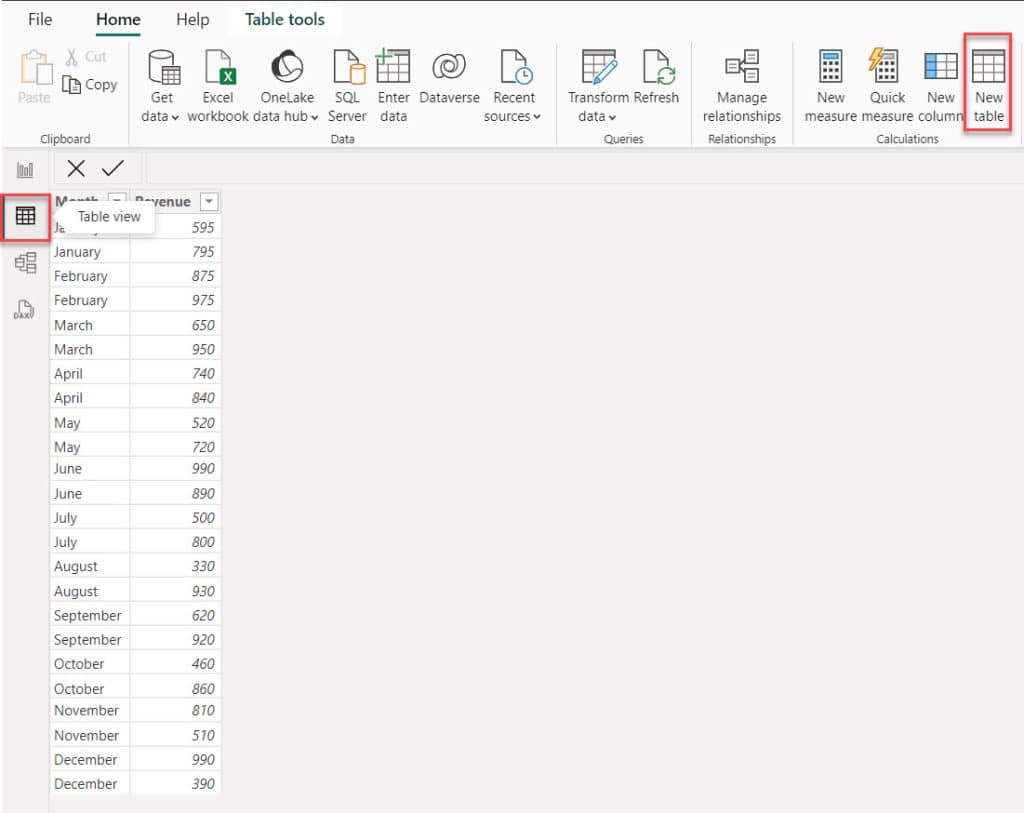
2. Go to the Table view, under the Home tab, and click New table.
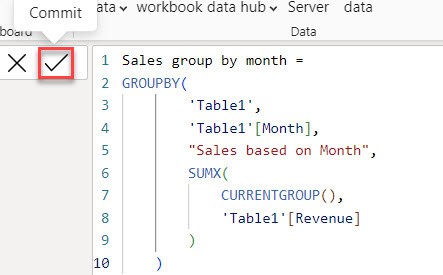
3. Then, in the formula bar, put the below expression. Then click the Commit button.
Sales group by month =
GROUPBY(
		'Table1',
		'Table1'[Month],
		"Sales based on Month",
		SUMX(
			CURRENTGROUP(),
			'Table1'[Revenue]
		)
	)
Where:
- Sales group by month = This is the name given to the calculated table.
- GROUPBY() = This is a DAX function used to group rows of a table based on one or more columns.
- ‘Table1’ = This is the name of the table that contains the month and revenue columns.
- ‘Table1′[Month] = This specifies the column in ‘Table1’ that we want to group by, which likely contains the month information.
- “Sales based on Month” = This is the name of the new column that will store the aggregated sales data for each month.
- SUMX = This is a DAX function used to iterate over each row of a table and perform a calculation.
- CURRENTGROUP() = This refers to the current group of rows being processed within the
GROUPBYfunction, which in this case would be the rows corresponding to a particular month. - ‘Table1′[Revenue] = This specifies the column containing revenue data in ‘Table1’.
4. Now, you can see the table contains the total sales for each month in Power BI.
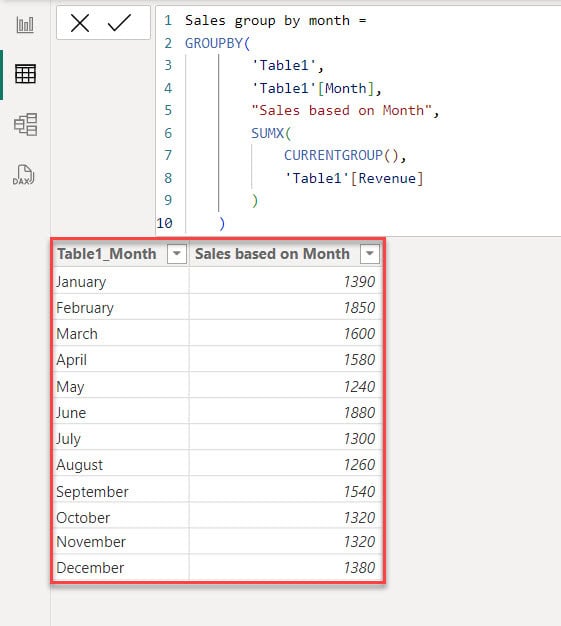
This is how to use Group By Month in Power BI.
Power Query Group By Concatenate Text
Now, let’s look at an example of using Power BI to group data and combine it using Power Query.
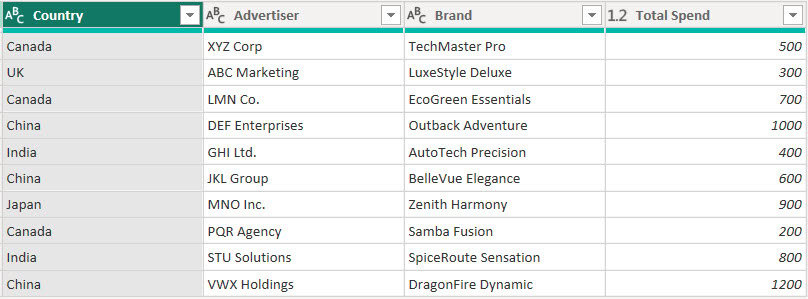
Let’s use the table below. Using Power Query, we’ll group the total spend and brand based on the country and advertiser columns. Then, we’ll combine the brand column.
Now follow the below steps:
1. In Power Query Editor, Go to the “Home” tab, then click on the “Group By” icon in the ribbon.

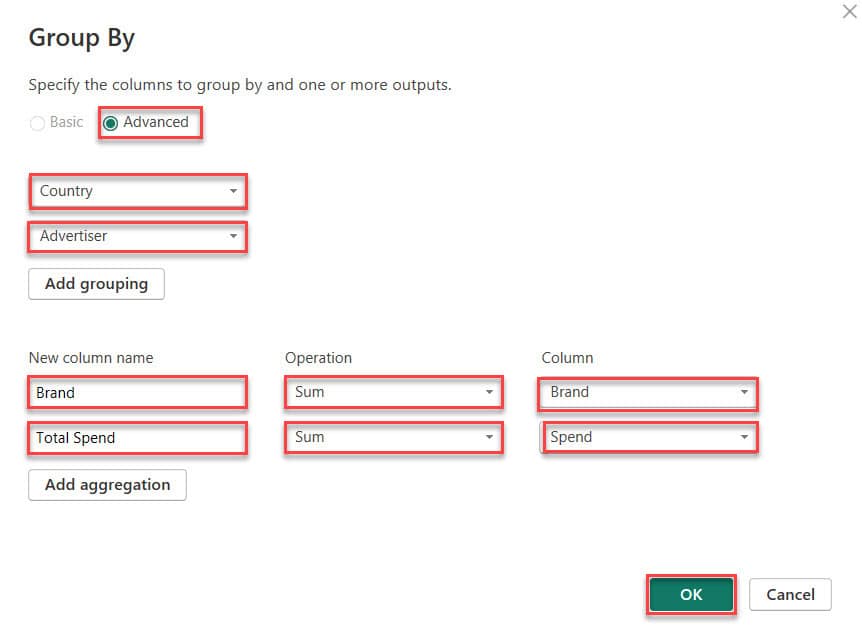
2. In the Group By window, choose Advanced options, select the Country column and click Add grouping, then choose the Advertiser column.
Provide a new column name, choose “Sum” as the operation for the Brand column, add aggregation, provide another new column name, select “Sum” as the operation for the Spend column, and then click OK.
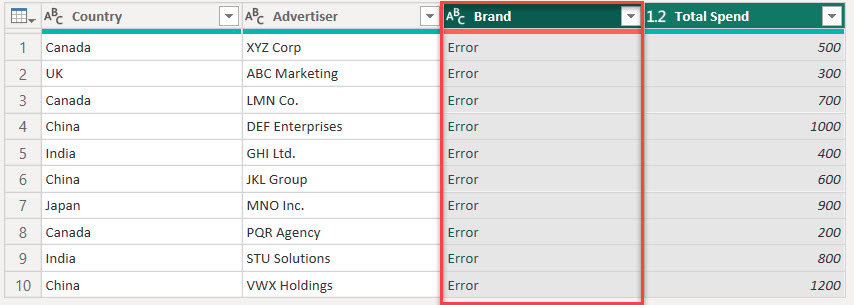
3. You might notice an error in the brand column because Power Query tries to sum text values, which doesn’t work for concatenation.
To concatenate the brand column, we need to change the aggregate part of the code. Power Query uses List.Sum to aggregate the Spend column, but since List.Sum only works with numbers, and it won’t aggregate the Brand column.
To concatenate the Brand, we’ll use Text.Combine() in the code, which will concatenate the Brand column values based on the group.
4. Replace the highlighted part of the code in the formula box with the following:
Text.Combine([Brand], ", "), type text
5. Now, you’ll see that the brand values are concatenated based on the Country and Advertiser.

This way, you can power query group by concatenate text.
Power BI Group By Multiple Columns
Now we see how to group by multiple columns in Power BI.
Follow the below steps:
1. Open Power BI Desktop. Then, under the Home tab, click Transform data.

2. In the Power Query Editor, load the data using the “New Source” option.
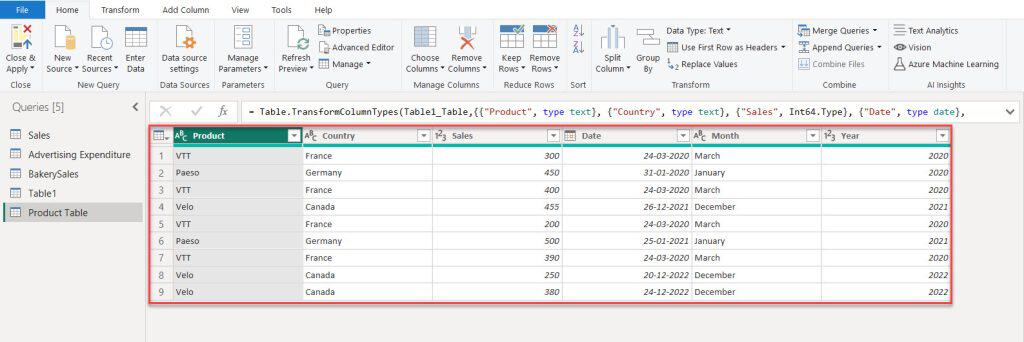
3. In Power Query Editor, Go to the “Home” tab, then click on the “Group By” icon in the ribbon.

4. After opening the Group By window, click on “Advanced options,” select the “Country” column, add it as a grouping, and then choose the “Product” column. Enter a new column name, select “Sum” as the operation, and choose “Sales” as the column. Finally, click “OK.”
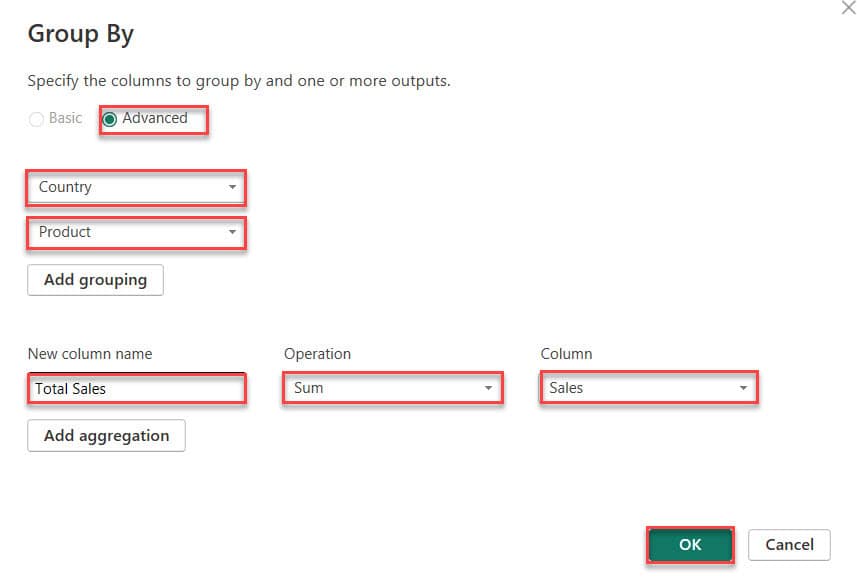
5. The screenshot below shows that the two columns are grouped, and the Sales values are displayed.

This is how to sum and group by Multiple columns in Power BI.
Also, you may like:
- Create Date Hierarchy in Power BI
- Add Conditional Column in Power BI
- Power BI Date Slicer
- Power BI Group by Column
- Power BI Sum Group by
- Power BI Split String
- Power Query Today
In this tutorial, we covered how to use the Group By function and Count Group By in Power BI. We also learned how to group data by date and month using DAX functions.
I am Bijay a Microsoft MVP (10 times – My MVP Profile) in SharePoint and have more than 17 years of expertise in SharePoint Online Office 365, SharePoint subscription edition, and SharePoint 2019/2016/2013. Currently working in my own venture TSInfo Technologies a SharePoint development, consulting, and training company. I also run the popular SharePoint website EnjoySharePoint.com