In this Power BI tutorial, we will learn what is Power BI group by function is and how to work with a Power Bi group by measure value in Power Bi with different examples. Moreover, we will also cover the below headings:
- Power BI sumx group by measure
- Power BI divides the group by measure
- Power BI matrix group by measure
- Power BI count group by measure
- Power BI measure group by Average
What is Power BI Group By function?
- The Power BI GROUPBY function is similar to the SUMMARIZE function, and the GROUP BY function returns the table. The CURRENT GROUP function can be utilized inside the aggregation functions.
- Power BI GROUP BY Function is utilized to achieve several aggregations within the expression. The below syntax is for Power BI GROUP BY Function:
GROUPBY (<table> [, <groupBy_columnName> [, <groupBy_columnName> [, …]]] [, <name>, <expression> [, <name>, <expression> [, …]]])Power BI Group by Measure Value
Here we will see how we can group the values using the Group by measure value in Power BI.
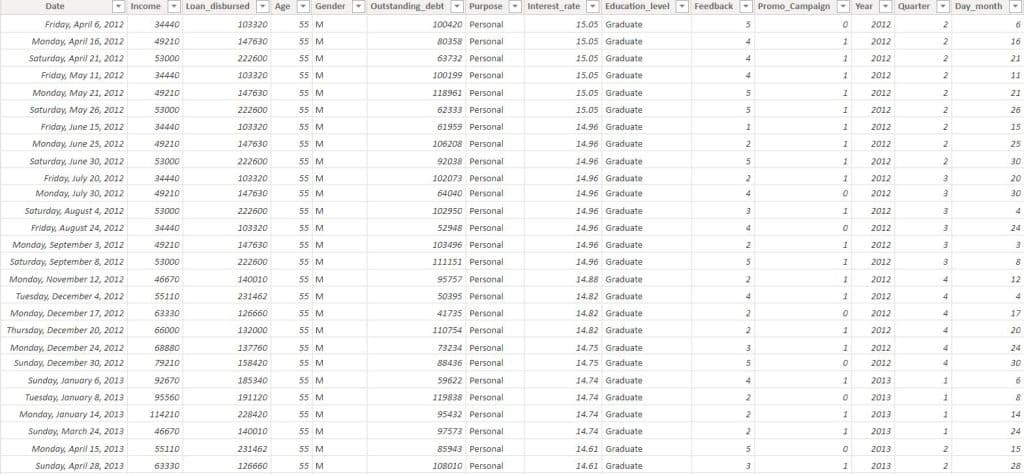
In this example, we are going to use the Loan data excel sheet. So we will find the total Loan disbursed amount by grouping the purposes using the Group by function in Power BI.

Open the Power Bi desktop, and load the data using the get data option. Once the data has been loaded select the New Table under the modeling tab as shown below:

In the formula bar, write the below-highlighted formula and click on the check icon.
Loan disbursed by Purpose = GROUPBY(BIData,BIData[Purpose],"Total Loan disbursed",SUMX(CURRENTGROUP(),BIData[Loan_disbursed]))Where,
- Loan disbursed by Purpose = New Table name
- GROUP BY = Function name
- BIData = Table name
- Purpose,Loan_disbursed = Existing column names
In the below screenshot, you can see that it groups the data based on the purposes and displays the total loan disbursed value.

This is how to group the values using the Group by measure value in Power BI.
Power BI SUMX Group by Measure
Let us see how we can sum and group the values using the Sumx and Group by functions in Power BI,
In this example, we will calculate the outstanding debts by grouping the Education levels using the Sumx and Group by functions in Power BI.
- Load the data into the Power BI desktop, and choose the new table option under the modeling tab.
- In the New table formula bar, apply the below-mentioned formula to sum the values by grouping the education levels, and click on the check icon to save.
Outstanding debts= GROUPBY('BIData','BIData'[Education_level],"Total Outstanding debts",SUMX(CURRENTGROUP(),BIData[Outstanding_debt]))Where,
- Outstanding debts = New Table name
- GROUP BY, SUMX = Function names
- BIData = Table name
- Education_level,Outstanding_debt = Existing column names
The Screenshot below displays the total values of the outstanding debts by grouping the educational level.

This is how to sum and group the values using the Sumx and Group by functions in Power BI.
Power BI Divides the Group by Measure
Here we will see how we can work with the divide and group by measure in Power BI.
In this example, we will calculate the total interest rate by dividing the interest rate by the loan disbursed value and also by grouping the education level column and purpose column in Power BI.
- Select the data source and load it into the Power Bi desktop, once the data has been loaded select the New Table under the modeling tab.
- Write the below DAX formula in the new table formula bar and click on the check icon.
Interest rate total = GROUPBY('BIData','BIData'[Education_level],BIData[Purpose],"Total Interest rates",SUMX(CURRENTGROUP(),BIData[Loan_disbursed]/BIData[Interest_rate]))Where,
- Interest rate total = New Table name
- GROUP BY, SUMX = Function names
- BIData = Table name
- Education_level,Loan_disbursed,Purpose,Interest_rate= Existing column names
In the screenshot below, you can see that the table groups the education level and purpose column from the BI table and displays the total interest rates value as below:

This is how to work with the divide and group by measure in Power BI.
Power BI Matrix Group by Measure
Let us discuss how to display the grouped calculated value in the matrix visual in the Power BI report,
In this example, we will calculate the total Loan disbursed amount by grouping the purposes and education level using the Group by function and display the result in the matrix visual in Power BI.
- Use the get data option to load data into the Power BI desktop. Select Modeling tab -> New Table
- Apply the below-mentioned formula in the formula bar and click on the check icon.
Loan disbursed by Purpose = GROUPBY(BIData,BIData[Purpose],BIData[Education_level],"Total Loan disbursed",SUMX(CURRENTGROUP(),BIData[Loan_disbursed]))Where,
- Loan disbursed by Purpose = New Table name
- GROUP BY = Function name
- BIData = Table name
- Purpose,Loan_disbursed,Education_level = Existing column names
In the below screenshot, you can see that it groups the data based on the purposes and education level and displays the total loan disbursed value.

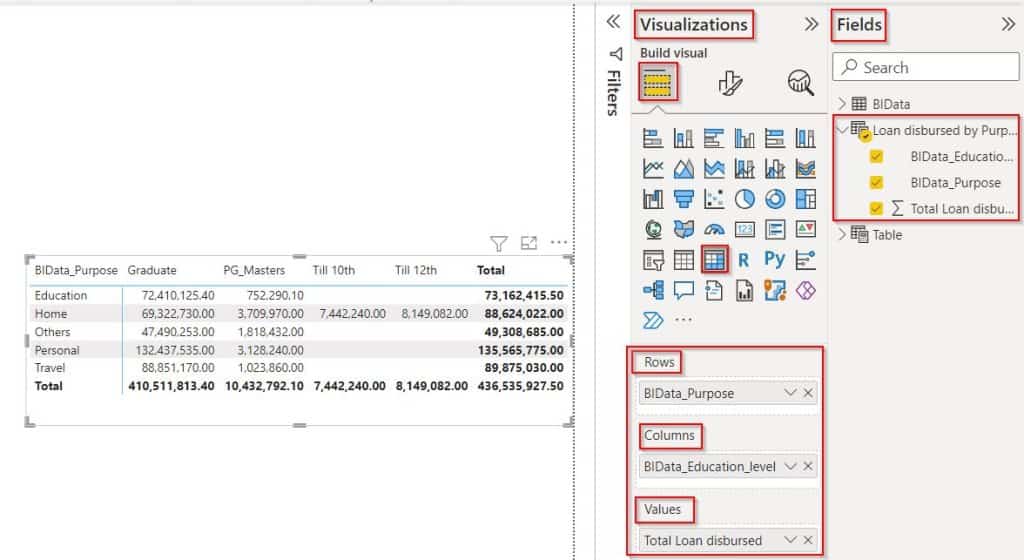
- Now in the report view, select the matrix visual from visualization. Drag-drop the BI_Data Purpose field from the field pane to the row section.
- In the same way, drag-drop the BI_Data education level field into the column section and the Total loan disbursed field into the Values section as below:

The screenshot displays the calculate total Loan disbursed amount by grouping the education level column and purpose column in the Power BI matrix visual.

This is how to display the grouped calculated value in the matrix visual Power BI report.
Power BI Count Group by Measure
Here we will discuss how we can count the grouped value using the Count Function in Power Bi.
In this example, we are going to count the education level by grouping the purposes field in Power BI.
- Load the data into the Power BI desktop, and choose the new measure option under the modeling tab as displayed below:

- Apply the below-mentioned formula to count the unique values by grouping the purpose field, and then selecting the check icon.
Count = CALCULATE(DISTINCTCOUNT(BIData[Education_level]), GROUPBY(BIData,BIData[Purpose]))Where,
- Count = New Table name
- GROUP BY, DISTINCT COUNT = Function name
- BIData = Table name
- Purpose,Education_level = Existing column names
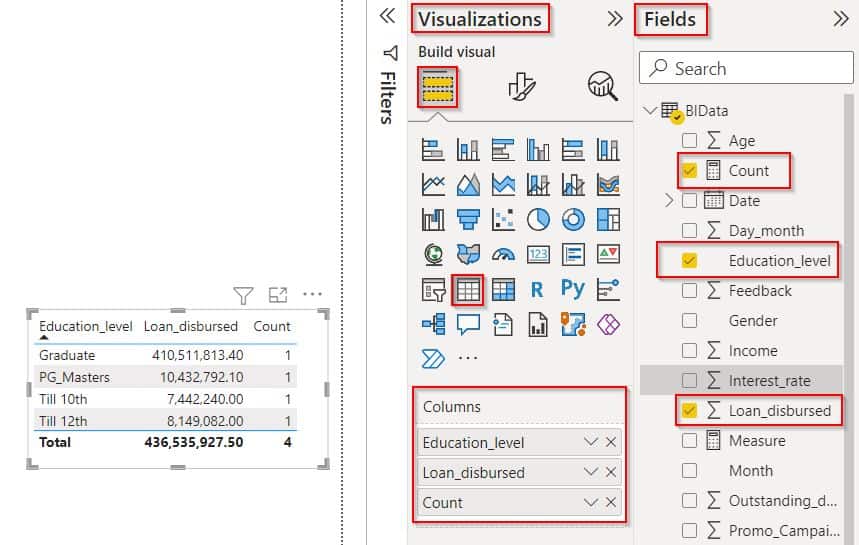
Now in the report view, select the table visual from visualization. Drag-drop the BI_Data Purpose, and Education_level fields from the field pane.

In the below screenshot, you can see that the table visually displays the distinct count value for the education level field.

This is how to count the grouped value using the Count Function in Power Bi.
Power BI Measure Group by Average
Let us discuss how we can calculate the average value by grouping the existing values in Power BI.
In this example, we are going to calculate the average of the total value. So we will find the average total Loan disbursed amount by grouping the purposes using the Averagex and Group by function in Power BI.
- Open the Power Bi desktop, and load the data using the get data option. Once the data has been loaded select the New Table under the modeling tab.
- In the formula bar, write the below-highlighted formula and click on the check icon.
Average of Total = GROUPBY(BIData,BIData[Purpose],"Average of Total",AVERAGEX(CURRENTGROUP(),BIData[Loan_disbursed]))Where,
- Average of Total = New Table name
- GROUP BY,AVERAGEX = Function names
- BIData = Table name
- Purpose,Loan_disbursed = Existing column names
In the below screenshot, you can see that it groups the data based on the purposes and displays the average total loan disbursed value.

This is how we can calculate the average value by grouping the existing values in Power BI.
In this Power BI tutorial, we have learned what is Power BI group by function is and how to work with a Power Bi group by measuring value in Power Bi with different examples. Moreover, we also covered the below headings:
- Power BI sumx group by measure
- Power BI divides the group by measure
- Power BI matrix group by measure
- Power BI count group by measure
- Power BI measure group by Average
You may also like:
- Power BI Multi-row Card
- How to Convert Text to Number in Power BI
- Power BI Measure If Multiple Conditions
- Power BI Measure If Text
- How to sort slicer by measure in Power BI
I am Bijay a Microsoft MVP (10 times – My MVP Profile) in SharePoint and have more than 17 years of expertise in SharePoint Online Office 365, SharePoint subscription edition, and SharePoint 2019/2016/2013. Currently working in my own venture TSInfo Technologies a SharePoint development, consulting, and training company. I also run the popular SharePoint website EnjoySharePoint.com