In this Power BI tutorial, We will learn What is a Multi-row card in Power BI and how to add it to the Power BI report. Also, We will see how to work with Power BI Multi-row card conditional formatting.
Also, we will cover the below headings:
- Power BI Multi-row card
- Power BI Multi-row card Wrap text
- Power BI Multi-row card horizontal
- Power BI Multi-row card conditional formatting
- Power BI Multi-row card center text
- Power BI Multi-row card edit interactions
- Power BI Multi-row card alternative
- Power BI Multi-row card label on top
- Power BI Multi-row card category label on top
What is a Multi-row card in Power BI?
- Power bi Multi-Row Card is used to display data in a group format, and the resulting data value will be in summarized form.
- Sometimes we want to track our Power BI report or dashboard through multiple values grouped format such as Total load amount distributed for different purposes, etc.
- For this, the Power BI Multi-row card visual is the best choice. We can get this visual in Power BI and Power BI service as it is available by default.
In the following example, we will see how to create and implement a Multi-row card visual in Power BI.
Power BI Multi-row card
Let us see how we can create a Multi-row card visually and display the summarized values in it in Power BI.
In this example, we will use the Loan data set, which you can download and use in your Power Bi reports.
- Select the sample data and then load it to the Power BI Desktop. Once the data has been loaded click on the Multi row card visual from the visualization it will create a blank multi-row card visual as below:
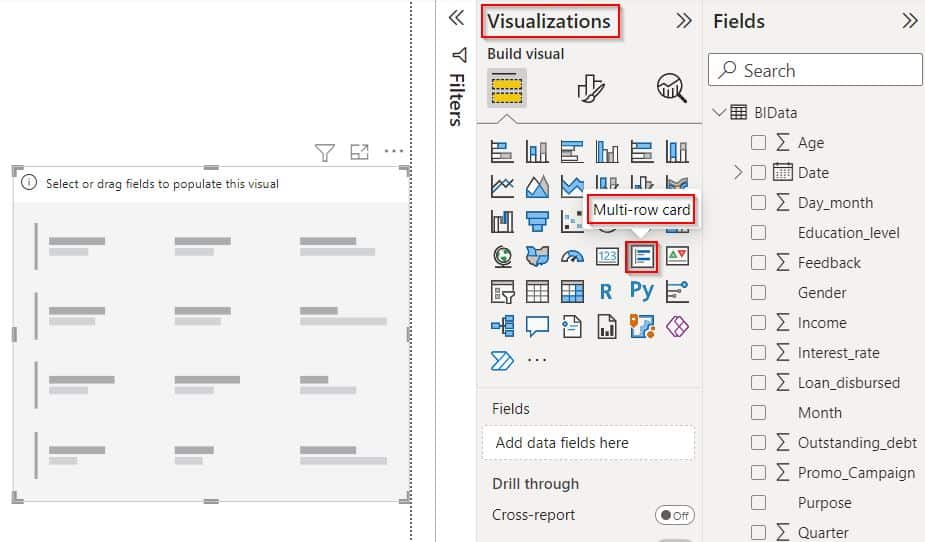
- Now we will drag and drop the fields into the section. For example, here we will see the loan distributed amount based on the purposes.
- The Screenshot below displays the summarized loan values based on the purposes of a multi-row card visual
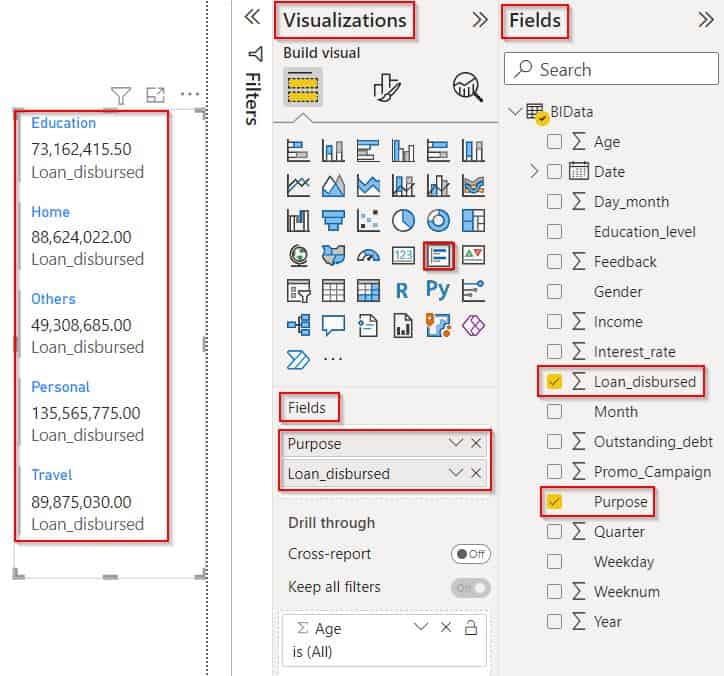
This is how to create a Multi-row card visually and display the summarized values in it in Power BI.
Also, Read: How to Convert Text to Number in Power BI
Power BI Multi-row card Wrap text
- It is not possible to wrap text in the multi-row card in the Power Bi report. In the Format section, we cannot see any option to wrap the text in a Multi-row card in the Power BI report.
Power BI Multi-row card horizontal
Here we will see how we can display the multi-row card visual in the horizontal orientation in Power BI.
- By default, Multi row card visually displays the summarized values in the Vertical Option.
- Still, there is no direct horizontal and vertical option to change the multi-row card visual in Power BI.
Load the data into the Power BI desktop, select the multi-row card visually, and add multiple fields in the field section as shown below:
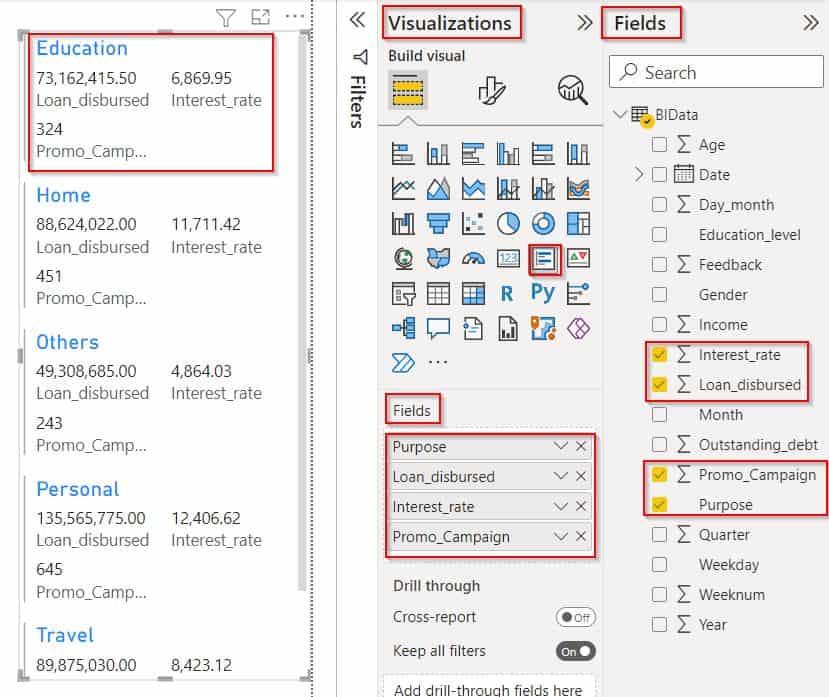
Now simply expand the multi-row card visually in a horizontal manner to view the data visually in a horizontal view as shown below:
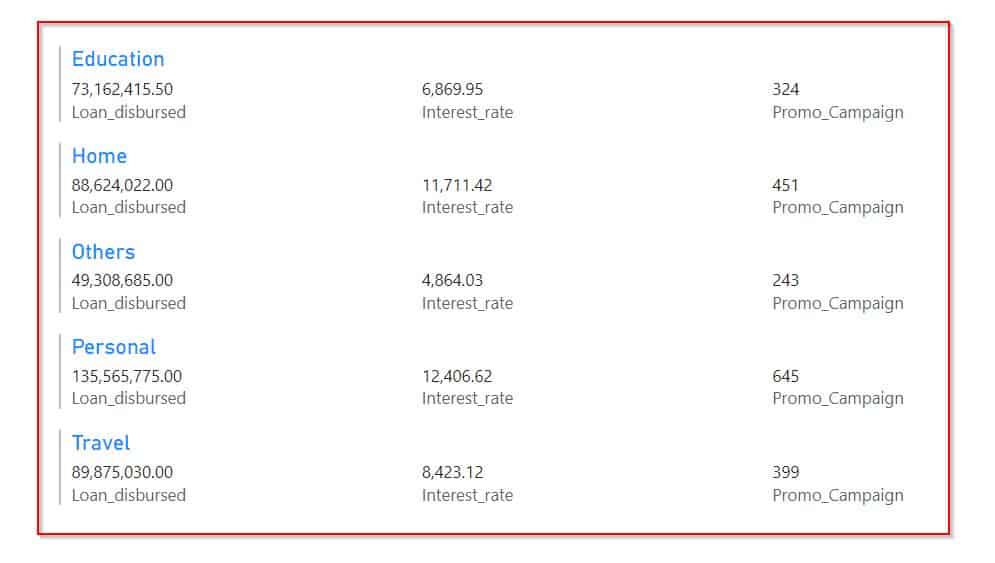
This is how to display the multi-row card visual in the horizontal orientation in Power BI.
Check out: Power BI Measure If Multiple Conditions
Power BI Multi-row card conditional formatting
Let us see how we can apply conditional formatting in a Multi-row card visual in Power BI,
In this example, we will use the slicer visual and the multi-row card visual, we will apply conditions for the multi-row card visual,
- Make sure the source data has been loaded to the Power BI desktop.
- Now under the Visualizations pane, click on the Multi-row card option, and drag and drop the Purpose, Loan distributed, Interest rate, and Promo campaign fields in it.
- In the same way, select the slicer visual and drop the purposes field in it as shown below:
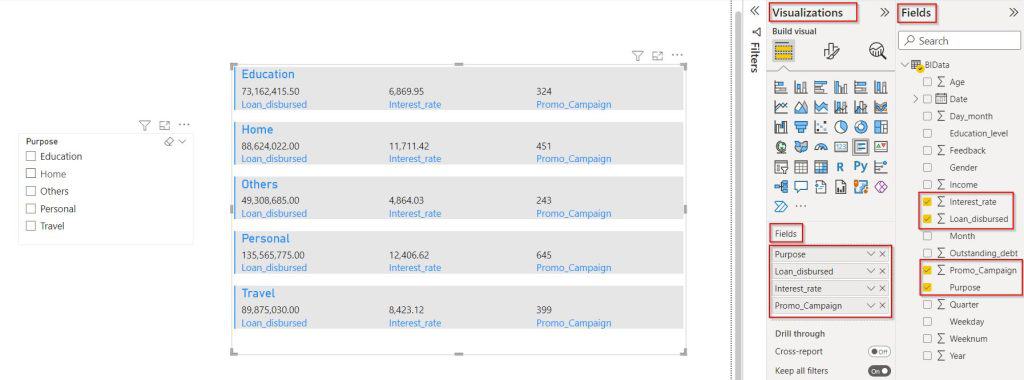
- Select Multi row card visual, expand the card option, and choose the fx icon
- Now, Select the Format style as Gradient and choose the column field value as Promo campaign, Either we can add a custom value in the Enter a value field or We can leave the values by default, lowest value, Middle value, and Highest Value.
- Click on the Ok button to apply the conditional formatting for the column chart.
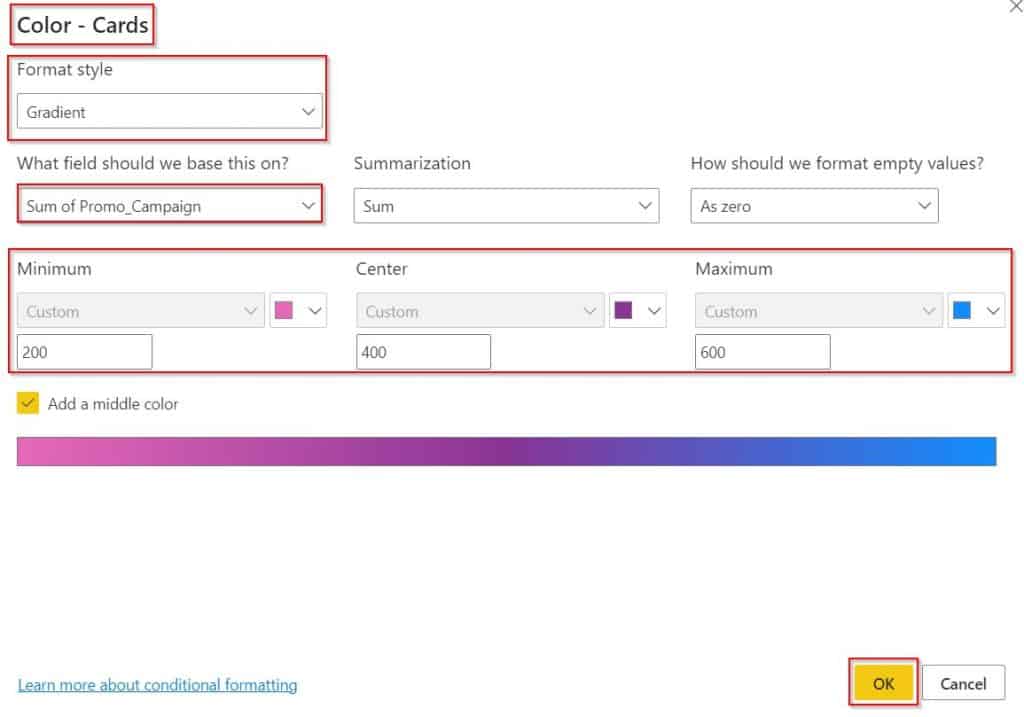
- Now select any of the purposes from the slicer visual, based on the slicer selection it filters and displays the value in the multi-row card visual.
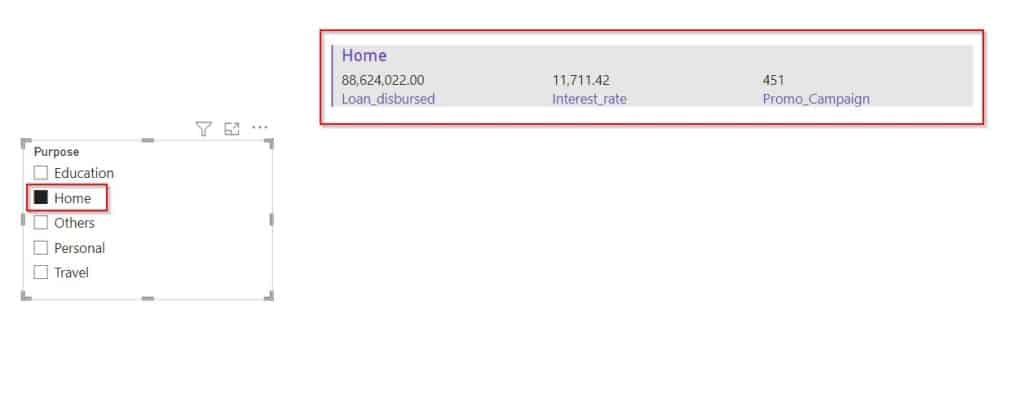
- In the below screenshot, you can see that I have selected a home loan from the slicer visual, and in the multi-row card visual filters and displays the value for the selected purpose.
In the same way, if we select any other purposes it displays the value with applied conditional formatting in a multi-row card visual.
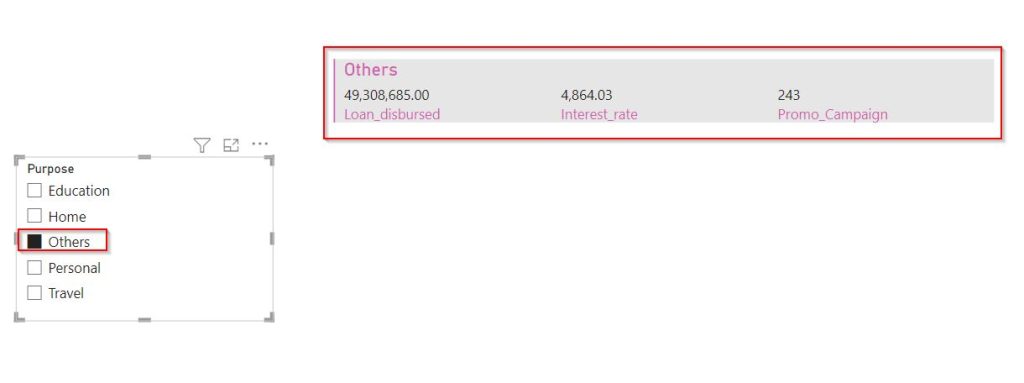
This is how to apply conditional formatting in a Multi-row card visual in Power BI.
Power BI Multi-row card center text
- Currently, the Multi-row card visual in Power BI doesn’t have the option to align the text values.
- By default, it displays the value in the left alignment. There is no option to align the text values in a multi-row card visual.
Also, Check: Power BI IF NULL then 0
Power BI Multi-row card edit interactions
Let us see how we can enable and work with the edit interactions in the Multi row card visual in Power BI.
In this example, we will enable and filter the multi-row card value using the edit interactions in Power BI,
- Load source data into the Power BI desktop.
- Select the Multi-row card visual option under the visualization, and drag and drop the Purpose, Loan distributed, Interest rate, and Promo campaign fields in it.
- In the same way, select the slicer visual and drop the purposes field in it as shown below:

- Now to enable the edit interactions, select the multi-row card visual choose the format option -> Edit interactions as highlighted below:
- It will automatically enable the edit interaction filters.
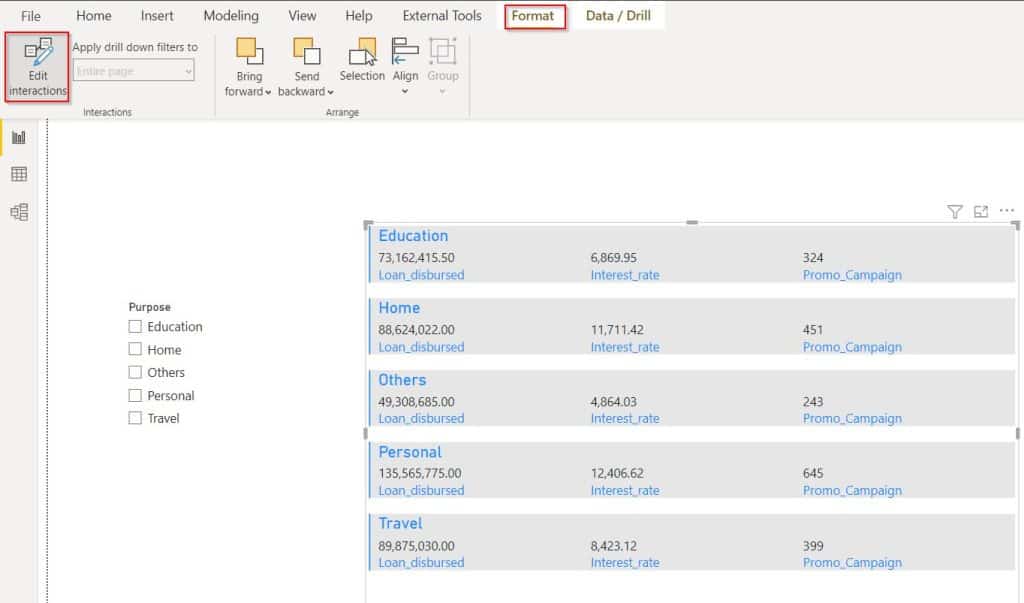
- Now select any of the purposes from the slicer visual, based on the slicer selection it filters and displays the value in the multi-row card visual.
- In the below screenshot, you can see that the edit interactions have been applied, so that it displays the filtered data value.

- If we select the none option presented in the edit interactions multi-row card visual, it will not display the filtered data.
- In the below screenshot, you can see that even though we apply a filter in the slicer visual it will not filter or interact with the multi-row card visual in Power BI.
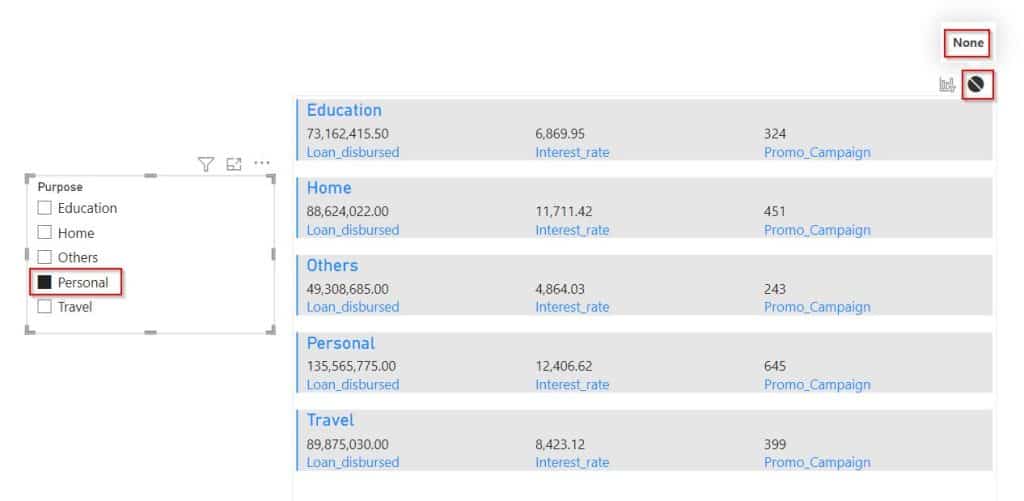
This is how to enable and work with the edit interactions in the Multi row card visual in Power BI.
Power BI Multi-row card alternative
Let us discuss what visual we can use instead of the MUlti-row card visual in Power BI.
- An alternative to Multi row card visual is a Table visual in Power BI to display multiple values. In the following example, I have displayed the multiple values in a table visual in Power BI.
- Select the table visual and drag-drop the fields into the fields section, Multiple values will be displayed in the Table visual.
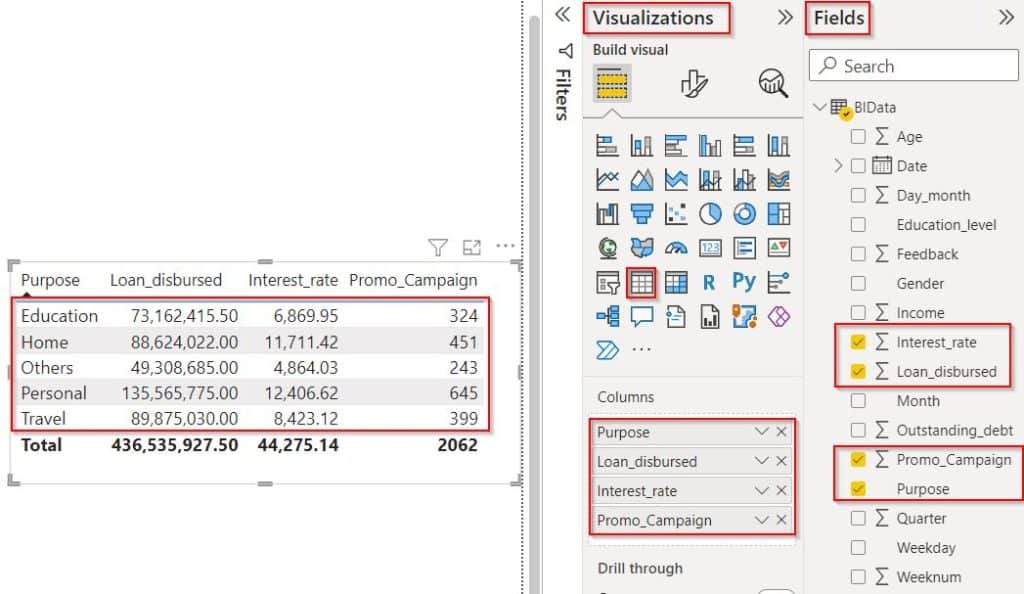
This is how we can display multiple values which work similarly to Multi row card visual in Power BI.
Check out: Power BI Card – How to Use + Examples
Power BI Multi-row card category label on top
- Currently, the Multi-row card visual has no option to display the category label on top of the Power BI multi-row card visual.
Power BI Multi-row card label on top
Here we will see how we can display the multi-row card visual label on top in Power BI.
In this example, we will enable the title to add the label on the top in Power BI visual.
- Select the sample data and then load it to the Power BI Desktop. Once the data has been loaded click on the Multi row card visual from the visualization.
- Add multiple fields in the field section to display values in Multi row card visual as shown below:

- Now select the Multi row card visual and choose the Format pane-> General settings and enable the title option as highlighted below:
- Enter the Title under the text section, and we can choose the font style, font size, and color also we can align the text based on the requirement.
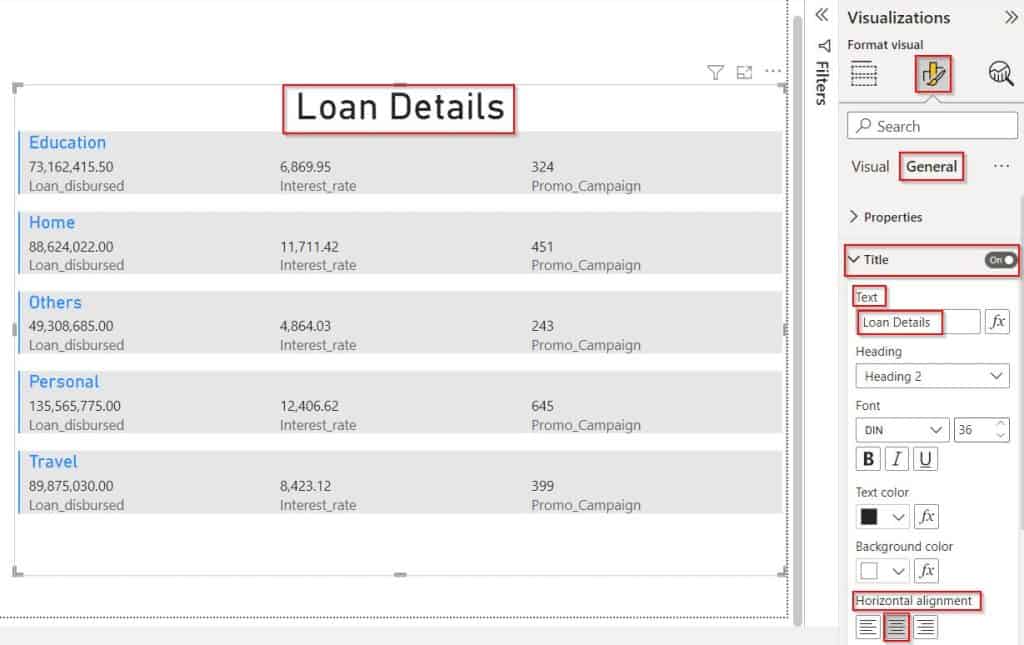
The screenshot below displays the title label on the top of the Power Bi multi-row card visual.
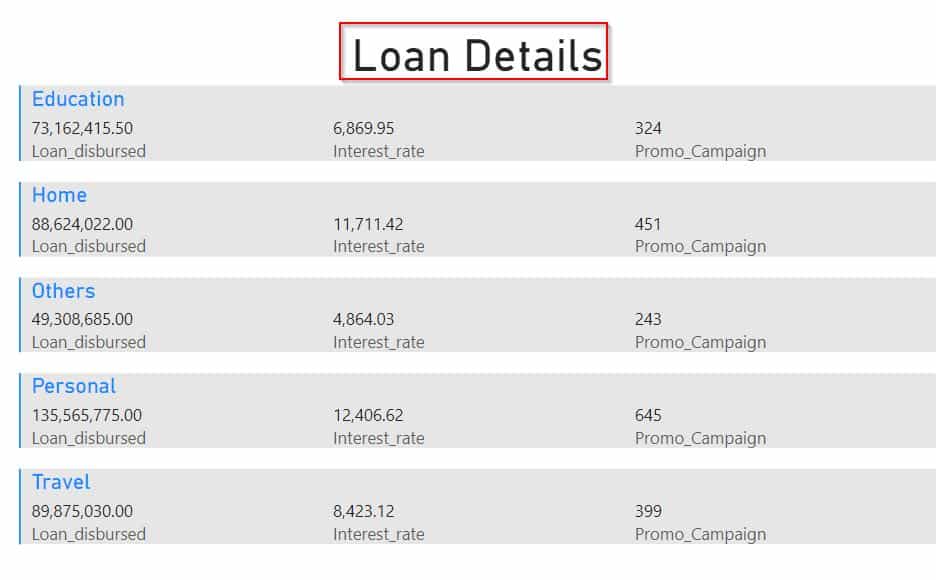
This is how to display the multi-row card visual label on top in Power BI.
Furthermore, you may like some more Power BI tutorials:
- How to Check IF Text is NULL in Power BI
- Power BI Measure If Text [With Examples]
- Power BI Conditional Formatting Based on Text
- Power BI Switch Multiple Conditions
In this Power Bi tutorial, We have learned What is a Multi-row card in Power BI and how to add it to the Power Bi report. Also, We saw how to work with Power BI Multi-row card conditional formatting.
Also, we covered the below headings:
- Power BI Multi-row card
- Power BI Multi-row card Wrap text
- Power BI Multi-row card horizontal
- Power BI Multi-row card conditional formatting
- Power BI Multi-row card center text
- Power BI Multi-row card edit interactions
- Power BI Multi-row card alternative
- Power BI Multi-row card label on top
- Power BI Multi-row card category label on top
I am Bijay a Microsoft MVP (10 times – My MVP Profile) in SharePoint and have more than 17 years of expertise in SharePoint Online Office 365, SharePoint subscription edition, and SharePoint 2019/2016/2013. Currently working in my own venture TSInfo Technologies a SharePoint development, consulting, and training company. I also run the popular SharePoint website EnjoySharePoint.com