In this Power BI tutorial, we will learn how to work with Measure If Multiple Conditions in Power BI, and also we will see how we can achieve the Measure Count If Multiple Conditions with various examples in Power BI.
Moreover, we will also cover the below topics:
- Power BI DAX Measure If Multiple Conditions
- Power BI Count Multiple Conditions
- Calculate Power BI Multiple Conditions
- Power BI IF statement with 3 conditions
- Multiple if statements in the Power Bi custom column
Power BI Measure If Multiple Conditions
Let us see how we can display the values of multiple conditions using the Power BI Measure Power BI.
In this example, we will use the Stocks table data as a data source and filter values using the multiple if conditions with different values in Power BI.
- Log in to the Power Bi desktop and load data using the get data option. Once the data has been loaded, select the new measure option and use the below formula:
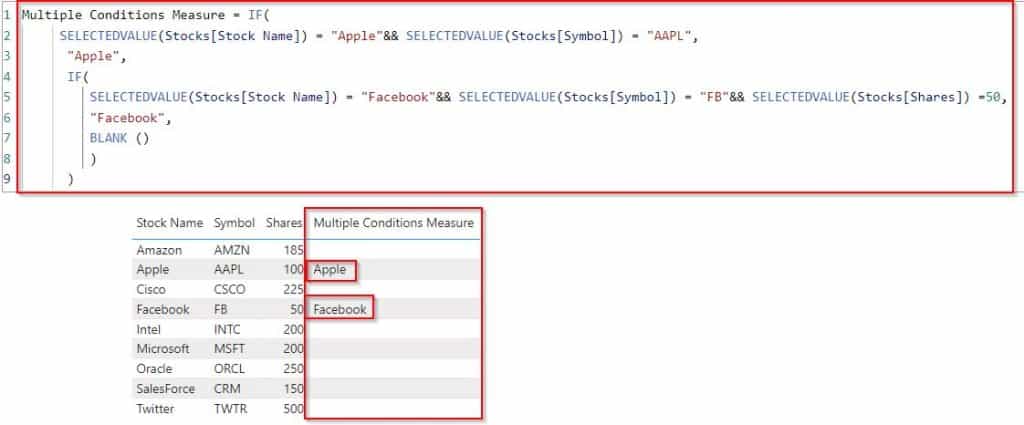
Multiple Conditions Measure = IF(
     SELECTEDVALUE(Stocks[Stock Name]) = "Apple"&& SELECTEDVALUE(Stocks[Symbol]) = "AAPL",
      "Apple",
      IF(
         SELECTEDVALUE(Stocks[Stock Name]) = "Facebook"&& SELECTEDVALUE(Stocks[Symbol]) = "FB"&& SELECTEDVALUE(Stocks[Shares]) =50,
         "Facebook",
         BLANK ()
         )
      )
Where,
- Multiple Conditions Measure = New Measure
- Stocks = Table Name
- Stock Name = Column Name
- SELECTEDVALUE & BLANK = Function Name
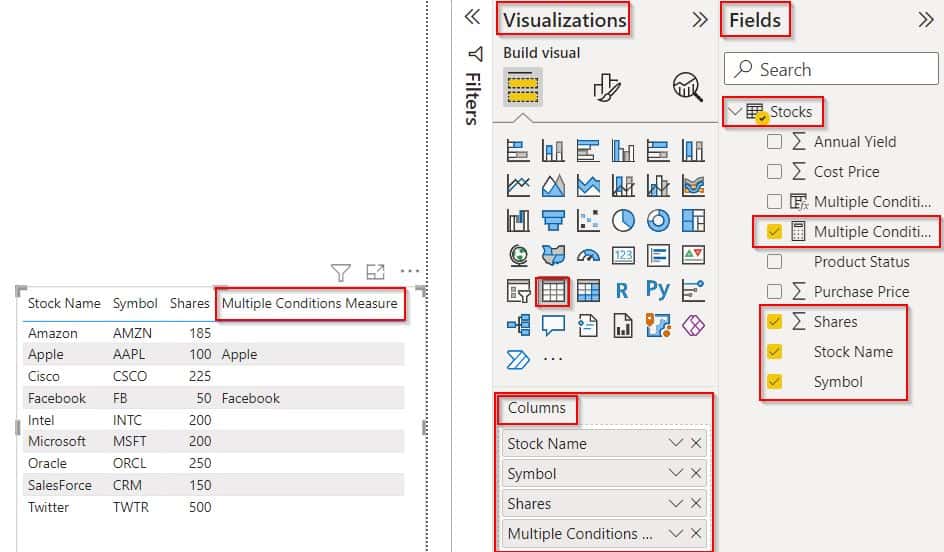
Select the table visual from the visualization, drop the Stock name, Symbol, shares, and the created measure value into the columns section as shown below:
In the below screenshot, you can see that the measure returns values based on the multiple conditions applied else, it returns a blank value.
This is how to display the values of multiple conditions using the Power BI Measure Power BI.
Power BI Measure Count If Multiple Conditions
Here we will see how we can count the values using Power BI If a function with multiple conditions in Power BI.
Load the data into the Power Bi desktop and click on the new measure and apply the below-mentioned formula:
Result =
VAR item_count1 =
COUNTAX(FILTER('Stocks','Stocks'[Stock Name] = "Amazon"),Stocks[Shares])
VAR item_count2 =
CALCULATE(
    COUNTAX( FILTER('Stocks','Stocks'[Stock Name] = "Microsoft"),Stocks[Shares])
   )

RETURN IF(
    item_count1 >= 1 || item_count2 >=1,
    "OK",
    "NOT OK"
)
Where,
- Result = New Measure name
- item_count1 , item_count2 = Variable Names
- Stocks = Table Name
- Stock Name = Column Name
- COUNTAX = Function Name
From the visualization choose the table visual, drag-drop the Stock name, Symbol, shares, and the created measure value into the columns section as shown below:
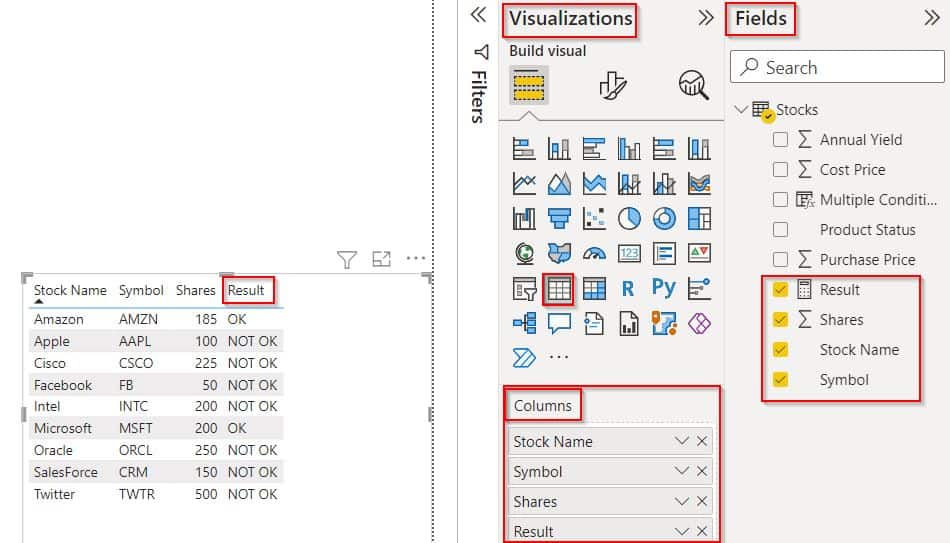
- The screenshot below displays the result value based on the applied condition in Power BI.
- If the Stock name matches with the mentioned name and the county is greater than or equal to 1 it returns the value as OK else it returns NOT OK as below:
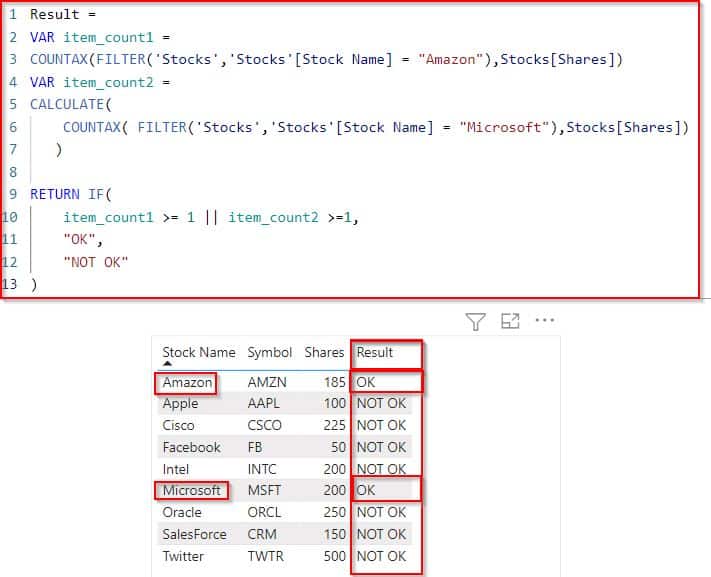
This is how to count the values using Power BI If a function with multiple conditions in Power BI.
Power BI DAX Measure If Multiple Conditions
Here we will see how we will use the Power BI Dax function to calculate values with multiple conditions in Power BI.
In this example, we will find the value if the value stock shares value matches with the stock name then it returns a true value else it returns a false value.
Open and Load data using the get data option into the Power Bi desktop. Click on the new column option under the modeling tab and apply the below-mentioned formula:
Multiple Conditions =
IF(
   AND(
       Stocks[Stock Name] = "Intel",
       'Stocks'[Shares] = 200 || 'Stocks'[Shares] = 185 || Stocks[Shares] = 50
      ),
   "True", "False"
  )
where,
- Multiple Conditions = New Calculated column
- AND = Function Name
- Stocks = Table Name
- Shares = Existing Column Name
In the below screenshot, you can see that the newly added column displays the result as true when the stock shares values match with the stock name value Else, it displays the false value.
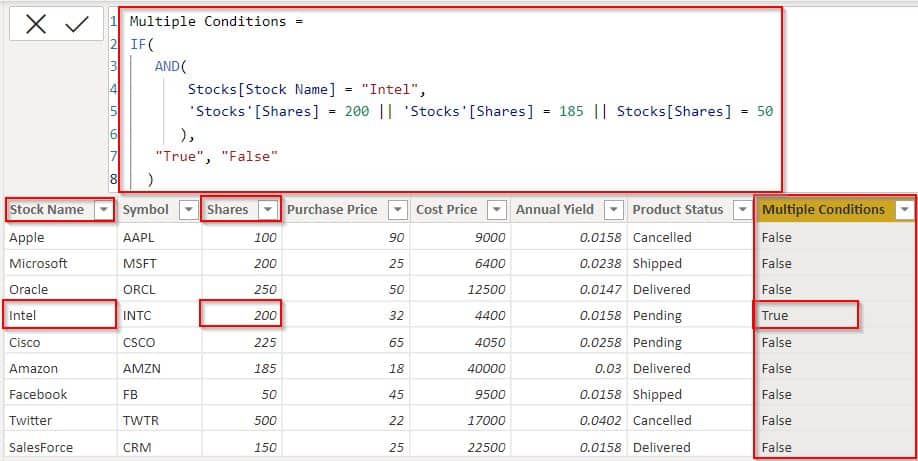
This is how to use the Power BI Dax function to calculate values with multiple conditions in Power BI.
Read Power BI Slicer Multiple Selection
Power BI Count Multiple Conditions
Let us see how to count the values using the Power BI Count function with Multiple conditions in Power BI.
In this example, we will use the table visual and the card’s visual to check the count value based on the condition applied in Power BI.
Load data to the Power Bi desktop using the get data option, click on the new measure option under the modeling tab, and use the below formula.
Total Count = COUNTX(
    FILTER(
        Stocks,
        Stocks[Stock Name] = "SalesForce"
            && Stocks[Product Status] = "Delivered"
    ),
Stocks[Stock Name]
)
where,
- Total Count = New measure name
- FILTER = Function Name
- Stocks = Table Name
- Stock Name, Product Status = Existing Column Names
- Add the table visual and card visual from the visualizations to the Power BI report canvas.
- In the table visually drag-drop the Stock name, Symbol, shares, and product status value into the columns section, and in the card visually drag and drop the created measure value to display the count as below:
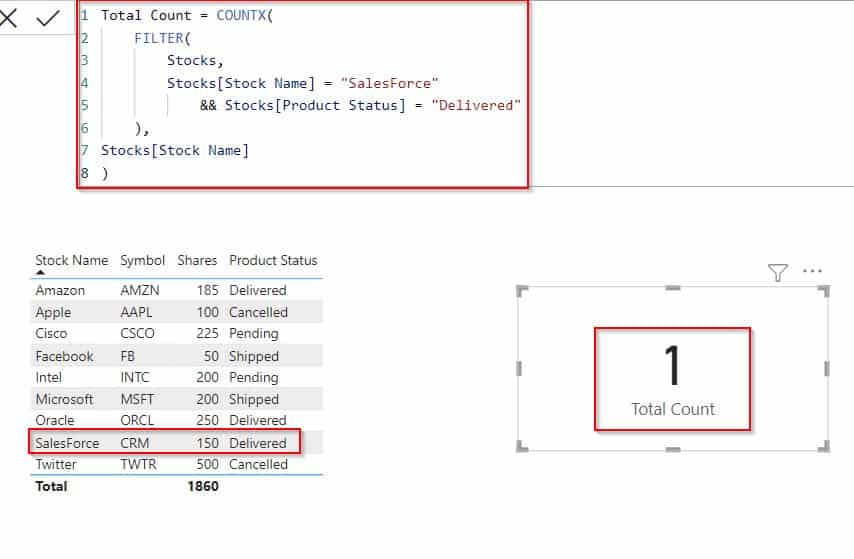
In the same way, it displays the count value based on the multiple conditions applied. In the below screenshot, you can see that I have changed the data value so the card visually displays the count value as 2.
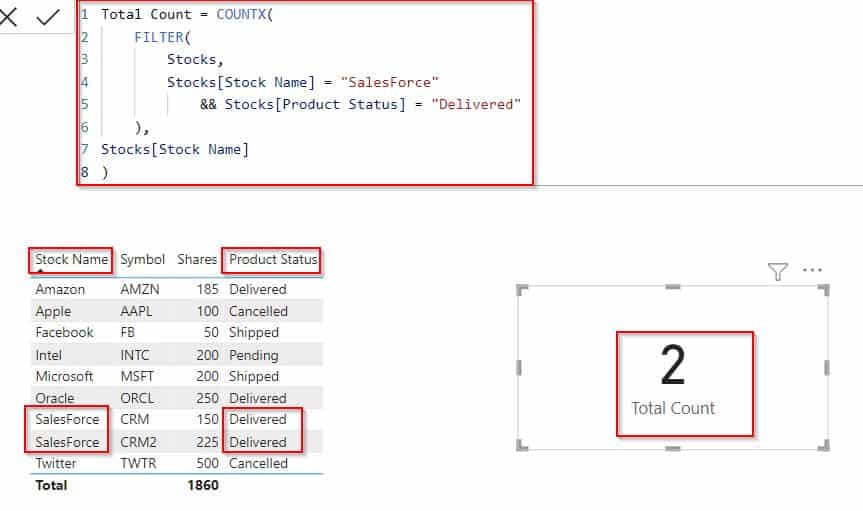
This is how to count the values using the Power BI Count function Multiple conditions in Power BI.
Calculate Power BI Multiple Conditions
Here we will see how to calculate values using the Power Bi calculate function with multiple conditions in Power BI.
In this example, we will create two measure values to calculate the value of total shares and sale value in Power BI.
- Log in to the Power Bi desktop and use the get data option to load data, once the data has been loaded click on the new measure under the modeling tab and use the below formula to find the value of the total shares.
Total Shares = SUM(Stocks[Shares]) Where,
- Total Shares = Measure Name
- Stocks = Table Name
- Shares = Column Name
In the same way, click on another new measure and use the below formula to calculate the sale value based on the different stock names.
Sale value = CALCULATE(Stocks[Total Shares],Stocks[Stock Name]="Amazon" || Stocks[Stock Name]="Cisco")Where,
- Sale value = Measure Name
- Total Shares = Existing measure
- Stocks= Table Name
- Stock Name = Column Name
- From the visualization, select the table visual and card visual and add them to the Power BI report canvas.
- In the table visually drag-drop the Stock name, Symbol, and shares into the columns section, and in the card visually drag and drop the created measure value to display the sale value based on the condition applied:
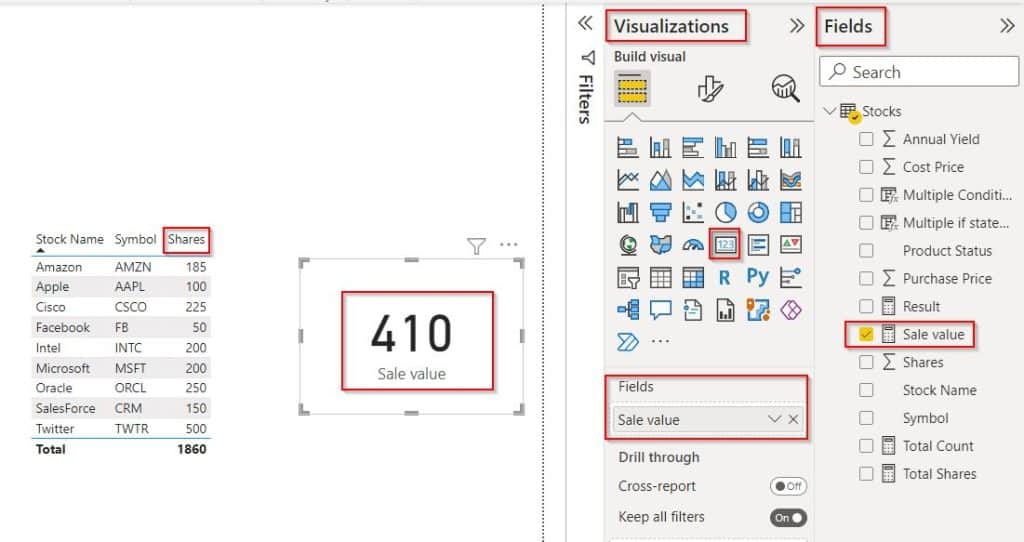
In the below screenshot, you can see that the measure returns a sale value in card visuals based on the multiple conditions applied.
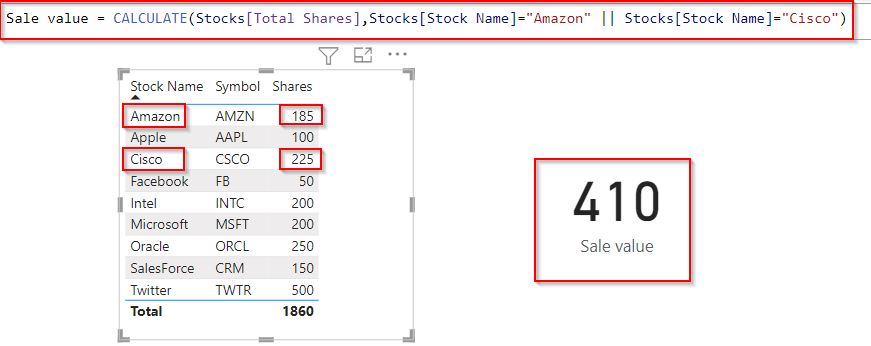
This is how to calculate values using Power Bi calculate function with multiple conditions in Power BI.
Read How to Concatenate with Space in Power BI
Power BI IF statement with 3 conditions
Let us see how we can filter value using the Power BI IF statement with 3 conditions in Power BI.
In this example, we will use an if statement with three conditions, if the value matches then it returns the true value else it displays the false value.
Load data into the Power Bi desktop, select a new column under the modeling tab, and use the below-mentioned formula.
IF 3 conditions = IF(Stocks[Stock Name] = "Amazon" && Stocks[Shares] = "185" && Stocks[Product Status]="Delivered", "True","False")Where,
- IF 3 conditions = New Calculated column
- Stocks = Table Name
- Shares, Product Status, Stock Name = Existing Column Names
In the below screenshot, you can see that the newly added column displays the result as true when the stock shares values match with the stock name and product status value Else, it displays the false value.

This is how to filter value using the Power BI IF statement with 3 conditions in Power BI.
Multiple if statements in the Power Bi custom column
Here we will see how we can filter the value using multiple if statements in the Power Bi custom column in Power BI.
In this example, we will add a new custom column with multiple if statements, if the value matches based on the applied condition it displays a true value else it returns a false value.
Load data into the Power Bi desktop, select modeling -> new column then apply the below-mentioned formula.
Multiple if statements = IF (
    OR (
        AND ( Stocks[Stock Name]= "Cisco", Stocks[Product Status] = "Pending" ),
        AND ( Stocks[Stock Name] = "Facebook", Stocks[Product Status]= "Shipped" )
    ),
    TRUE (),
    FALSE()
)
Where,
- IF 3 conditions = New Calculated column
- Stocks = Table Name
- Shares, Product Status, Stock Name = Existing Column Names
In the below screenshot, you can see that the newly added column displays the result as true based on the multiple if conditions. Else, it returns the false value.
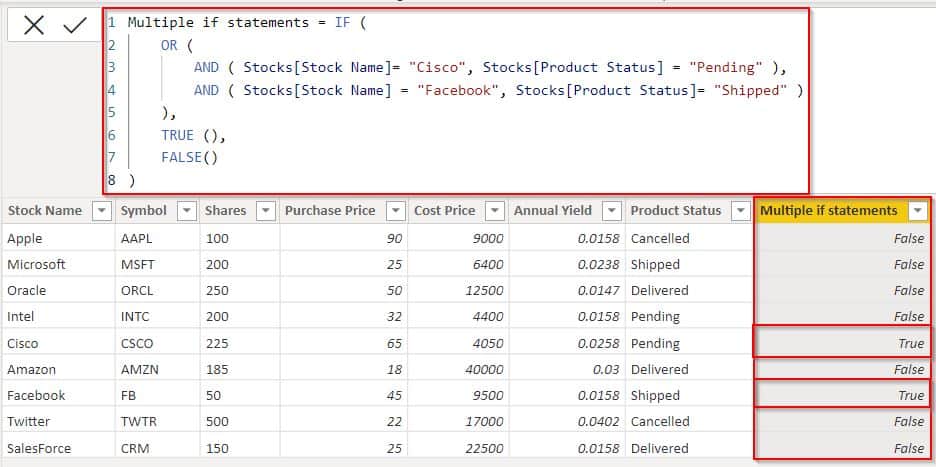
This is how to filter the value using multiple if statements in the Power Bi custom column in Power BI.
In this Power BI tutorial, we have learned how to work with Measure If Multiple Conditions in Power BI, and we also saw how we can achieve the Measure Count If Multiple Conditions with various examples in Power BI.
Moreover, we also covered the below topics:
- Power BI DAX Measure If Multiple Conditions
- Power BI Count Multiple Conditions
- Calculate Power BI Multiple Conditions
- Power BI IF statement with 3 conditions
- Multiple if statements in the Power Bi custom column
You may also like the following Power BI tutorials:
- Power BI IF NULL then 0
- Check IF Text is NULL in Power BI
- Power BI Measure If Text
- Power BI Conditional Formatting Based on Text
I am Bijay a Microsoft MVP (10 times – My MVP Profile) in SharePoint and have more than 17 years of expertise in SharePoint Online Office 365, SharePoint subscription edition, and SharePoint 2019/2016/2013. Currently working in my own venture TSInfo Technologies a SharePoint development, consulting, and training company. I also run the popular SharePoint website EnjoySharePoint.com