Are you looking forward to learning about how to use one slicer with Multiple Selections? Then this Power BI Tutorial will help you to achieve it. Here we will learn how to work with Power Bi Slicer visual Multiple Selections with various examples. Also covered the below-related headings:
- Power BI slicer multiple select without ctrl
- Power BI hierarchy slicer multiple selections
- Power BI slicer disables multiple selections
- Power BI applies the slicer to multiple tables
Power BI slicer multiple selections
Let us see how to create and use the Power Bi slicer with Multiple selections in the Power BI report,
In this example, I am going to use the Super Store data as mentioned below: You can also download the Sample data from here and use it in the Power Bi report.
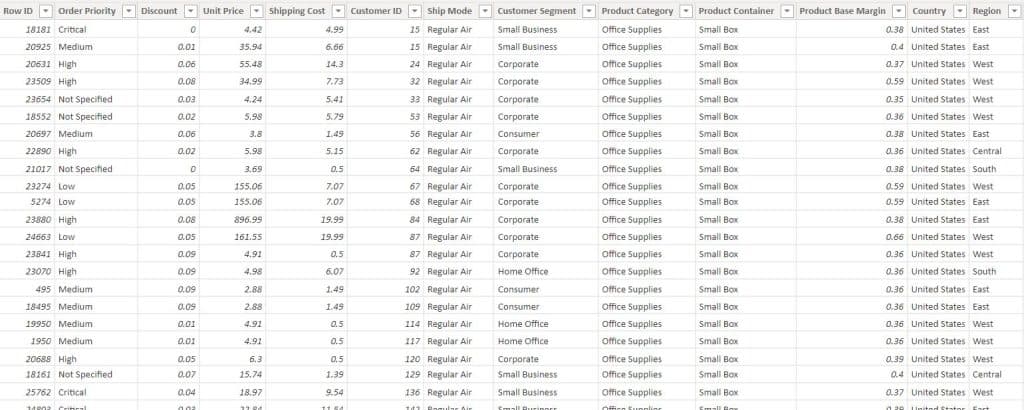
- Open Power bi desktop. Load the data source into the bi desktop by using the get data option.
- From the visualization pane, Select the Slicer visual and the Table visual so that if you filter any values in the Slicer visual the changes will be reflected in the Table visual.
- In the Fields section, for the slicer visually drag and drop the customer segment field from the field pane. In the same way, for the table visual drag and drop the customer segment, sales, and Profit field as below:
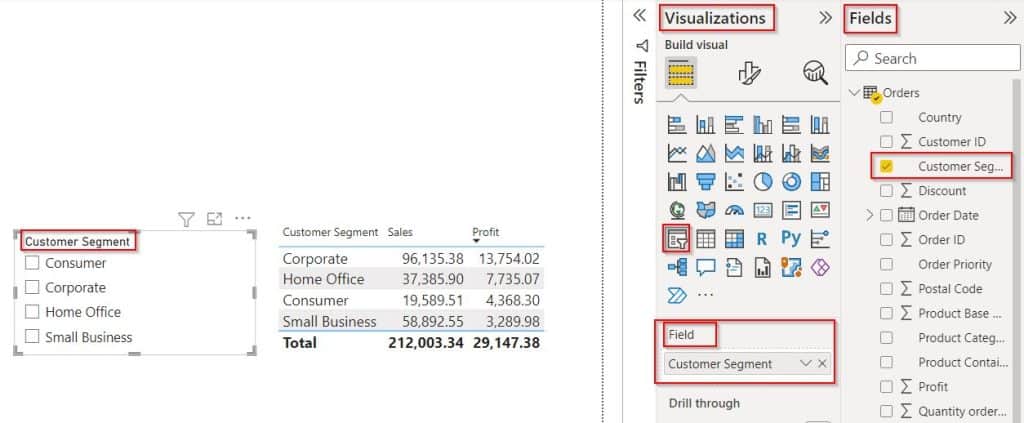
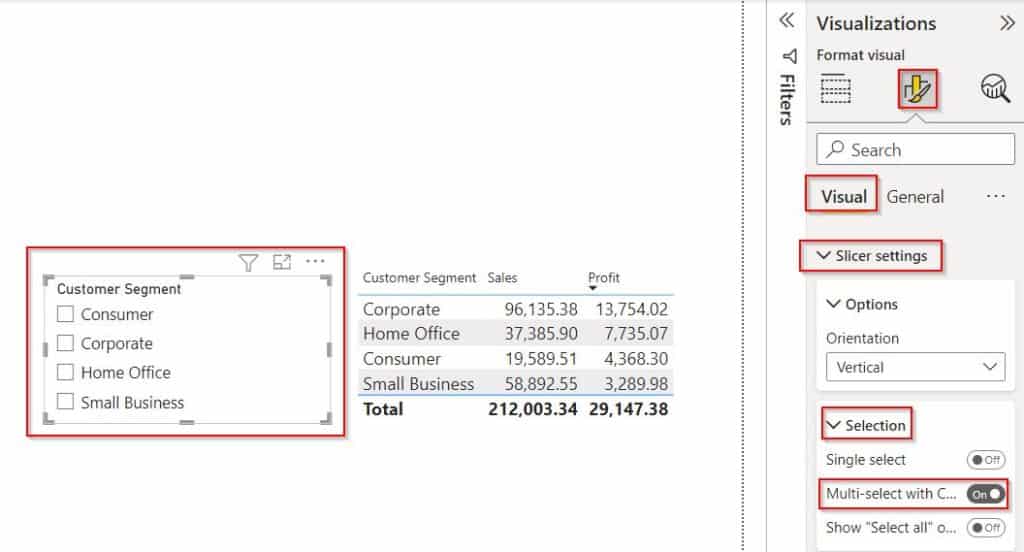
- Now To select Multiple selections from the slicer visual, Make sure the single selection is disabled and the Multiple selections are enabled.
- To check that simply select the slicer visual -> Format visual -> Slicer settings -> Selections as shown below:
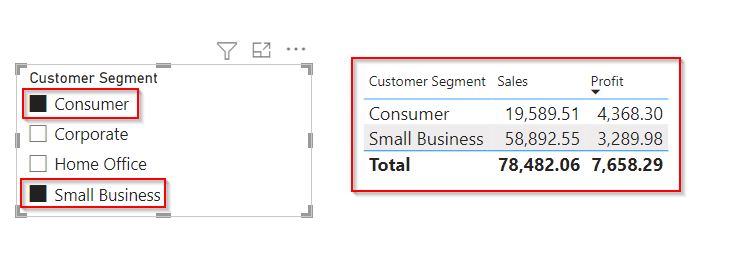
- To select multiple selections, click on the Ctrl key from the Keyboard and select the values that you want to apply a filter from the slicer selections.
- In the below screenshot, you can see that multiple options have been selected in the slicer visual, and in the table visual we can view the filtered value.
This is how to create and use the Power Bi slicer with Multiple selections in Power BI.
Power BI slicer multiple select without ctrl
Here we will see the power bi slicer multi-select without ctrl in the power bi desktop.
In this example, we will use the slicer for multi-select without the ctrl key presented on the Keyboard in Power BI.
- In the power bi desktop, select the slicer and table visual from the visualization.
- In the Fields section, for the slicer visually drag and drop the Product category field from the field pane. In the same way, for the table visual drag and drop the Product category, customer segment, sales, and Profit field as below:
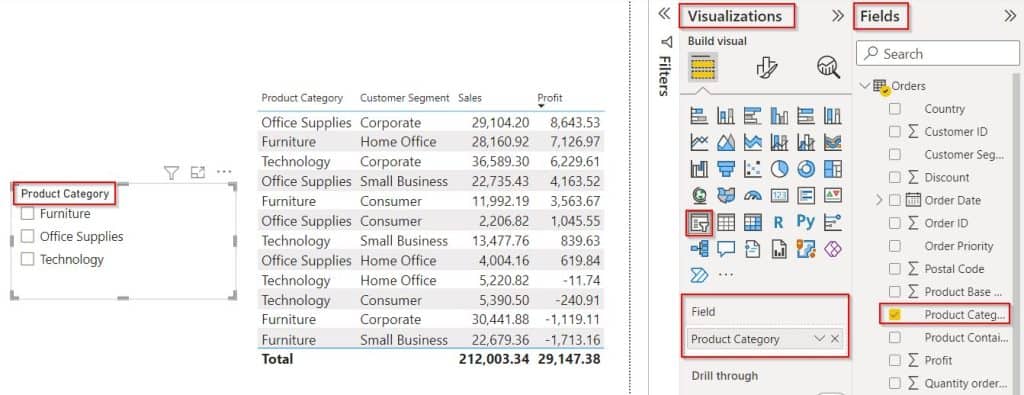
- Select the slicer visual Go to the Formatting section, in the visualization pane.
- Under the Slicer settings expand the selection -> Turn off the single selection and turn off the multi-select with ctrl.
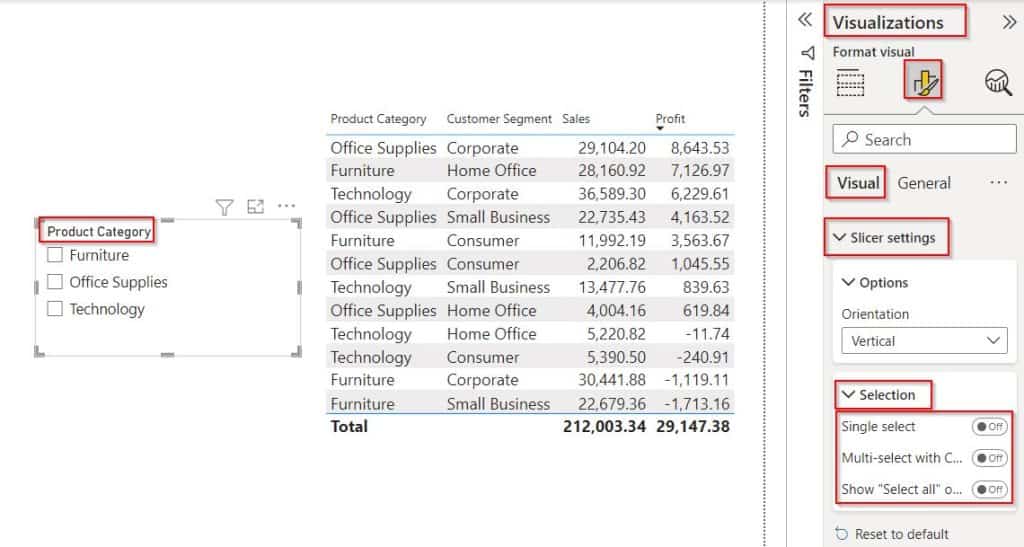
- Now you can select the multiple values in the power bi-slicer without the ctrl key selection.
- In the below screenshot, you can see that it filters and displays the data in power bi-slicer multi-select without ctrl.
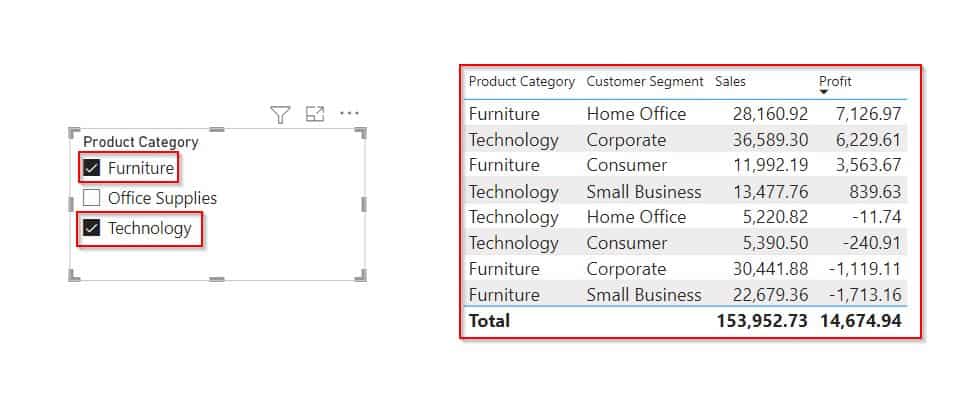
This is how the power bi slicer multi-select without ctrl works on the power bi desktop.
Check Out: Power BI slicer multiple dates
Power BI hierarchy slicer multiple selections
Let us see how to create and use the Power Bi hierarchy slicer with Multiple selections in Power BI.
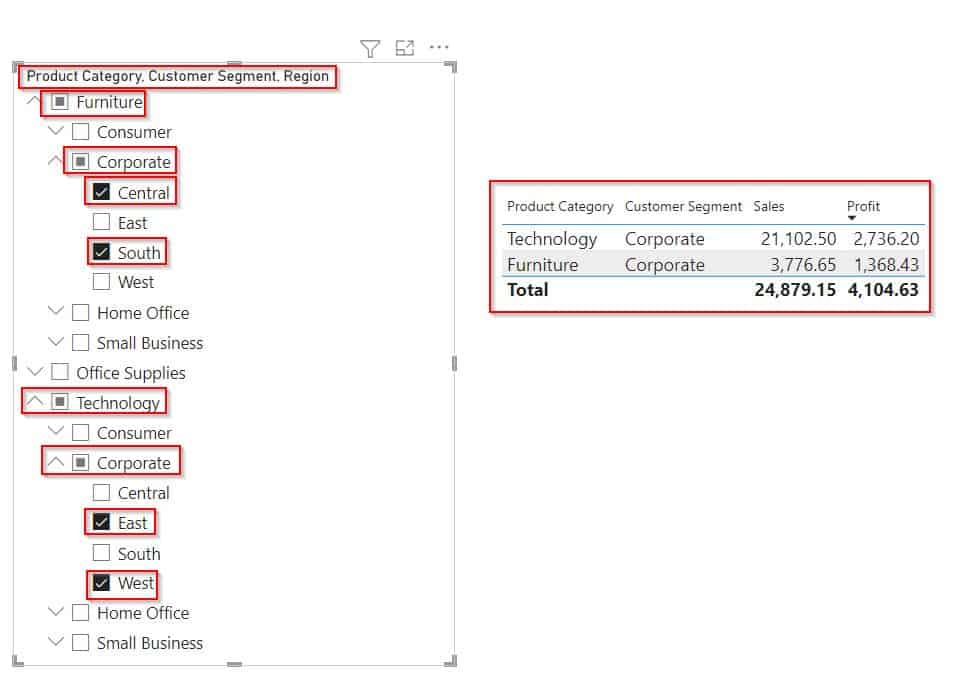
In this example, we will create a hierarchy slicer consisting of Product category, customer segment, and Region, then we will filter the multiple data by applying multiple selections in the hierarchy slicer.
- Load the data to the power bi desktop, and select the slicer and table visual from the visualization.
- In the Fields section, for the slicer visually drag and drop the Product category, customer segment, and Region. In the same way, for the table visual drag and drop the Product category, customer segment, sales, and Profit field as below:
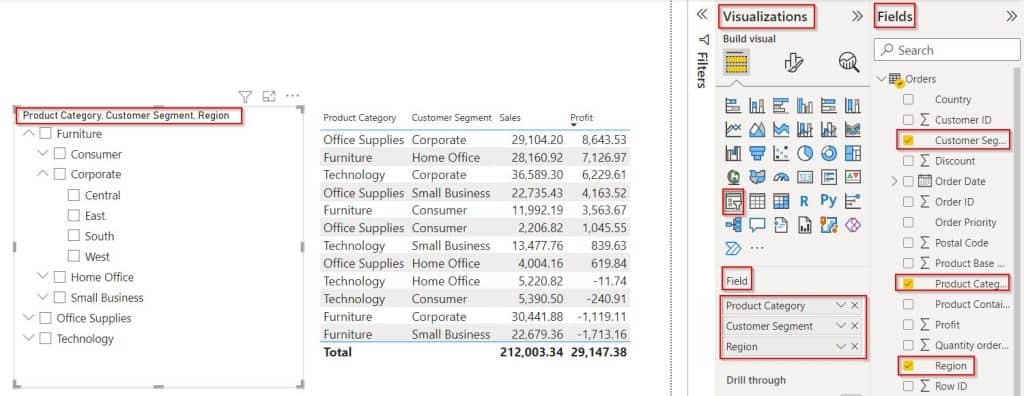
- To select multiple selections, click on the Ctrl key from the Keyboard and select the values that you want to apply a filter from the hierarchy slicer selections.
- In the below screenshot, you can see that multiple options have been selected in the hierarchy slicer visual, and in the table visual we can view the filtered value based on the selection.
This is how to create and use the Power Bi hierarchy slicer with Multiple selections in Power BI.
Power BI slicer disables multiple selections
Here we will see how to disable multiple selections on the Power BI slice in the power bi desktop.
- Select the slicer visual from the power bi report. Go to the formatting section under visualization
- Expand the Selection control, and turn on the single selection, which will turn off the multi-select with ctrl.
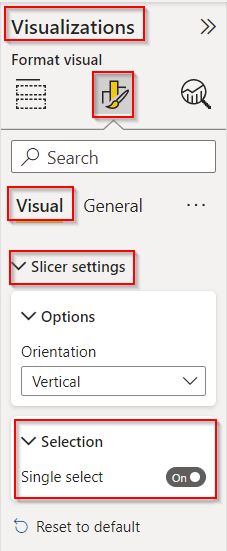
Now we can select only a single value from the power bi-slicer as displayed below:

This is how to disable multiple selections on the Power BI slice in the power bi desktop.
Also Read: Power bi slicer to select multiple measures
Power BI applies the slicer to multiple tables
Let us see how to apply a slicer filter to multiple tables in the Power Bi report,
In this example, we use a single slicer visual to filter and display the data for multiple table values in Power BI.
- In the power bi desktop load the data source using get data and select the slicer and two table visuals from the visualization.
- In the Fields section, for the slicer visually drag and drop the Product category field from the field pane.
- In the same way, for the table visual drag and drop the Product category, customer segment, and sales field from the field pane.
- In another table visual, select the Customer segment and Profit field from the field pane as below:
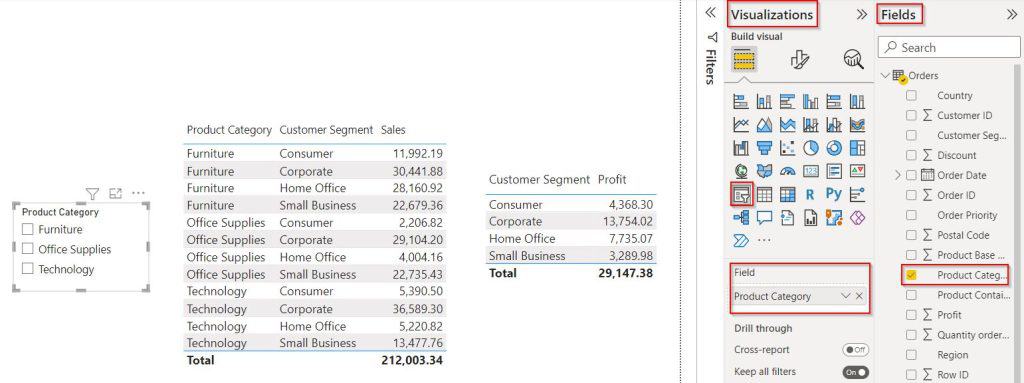
- To select multiple selections, click on the Ctrl key from the Keyboard and select the values that you want to apply a filter from the slicer selections to multiple tables in the Power BI report.
- In the below screenshot, you can see that multiple options have been selected in the slicer visual, and we can view the filtered value in the multiple table visuals.
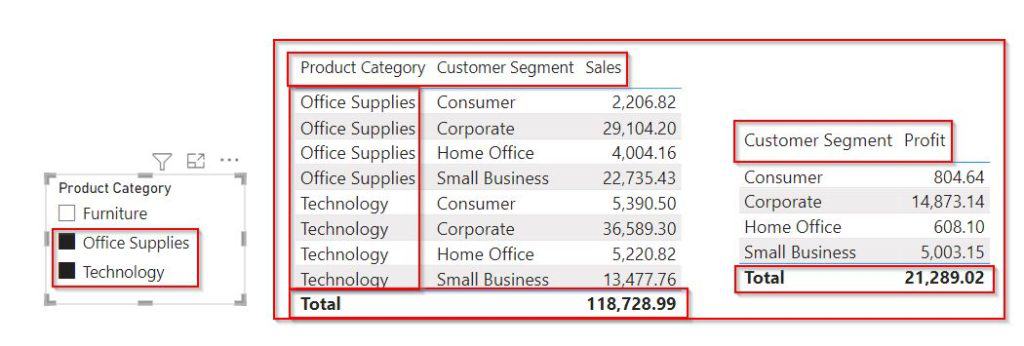
This is how to apply a slicer filter to multiple tables in the Power Bi report.
In this Power BI tutorial we have learned how to create and work with a power bi slicer visual with multiple selections with various examples, It Also covered the below-related headings:
- Power BI slicer multiple select without ctrl
- Power BI hierarchy slicer multiple selections
- Power BI slicer disables multiple selections
- Power BI applies the slicer to multiple tables
You may like the following Power BI tutorials:
- Power BI Merge Two Tables without Duplicates
- Power BI Union Two Tables
- Power BI Group by Measure
- Power BI Multi-row Card
- Power BI Conditional Formatting Based on Measure
- Power BI Count If True
I am Bijay a Microsoft MVP (10 times – My MVP Profile) in SharePoint and have more than 17 years of expertise in SharePoint Online Office 365, SharePoint subscription edition, and SharePoint 2019/2016/2013. Currently working in my own venture TSInfo Technologies a SharePoint development, consulting, and training company. I also run the popular SharePoint website EnjoySharePoint.com