In this Power BI Tutorial, we will discuss, how to create a report in power bi desktop. I will show you, how to create a power bi report from excel as well as we will discuss, how to create a power bi report from the SharePoint list.
Microsoft Provides a platform for Power BI, so we can create different dashboards and reports from the different data sources. The Power BI desktop is free open source that we can freely install in our local system.
Create a Power BI report from Excel using Power BI Desktop
Follow the below steps to create a Power BI report using the Excel data.
At first, I created an Excel sheet in my local system. You can see my Excel sheet in the below screenshot.

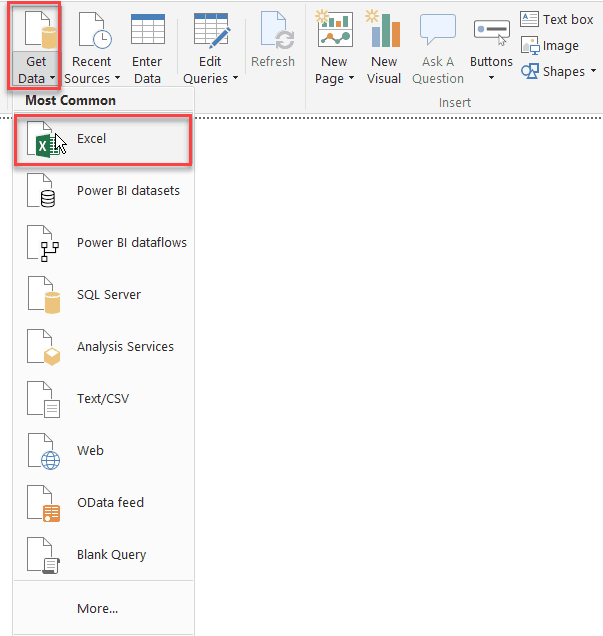
Before creating the Power BI Report, You have to install the Power BI in your local system/desktop. Open this Power BI desktop from your system. Click on Get Data from the ribbon and select the Excel option as shown below.
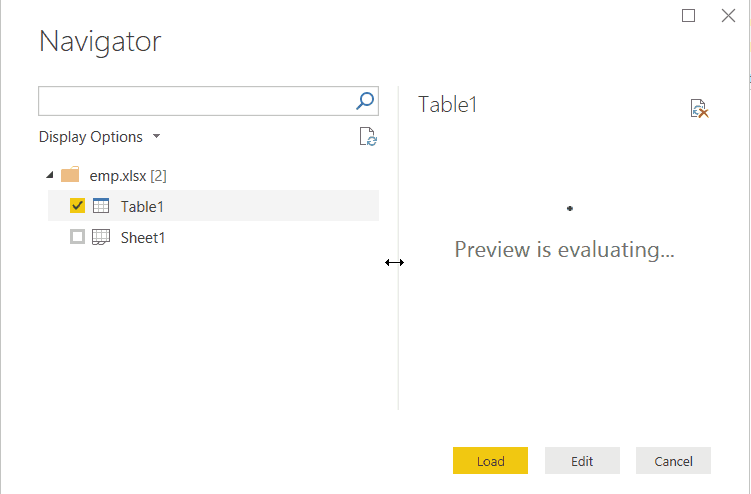
Once you will click on Excel, a Navigator page will come where you need to select the table name which you are created before using the excel sheet. Then click on the Load.
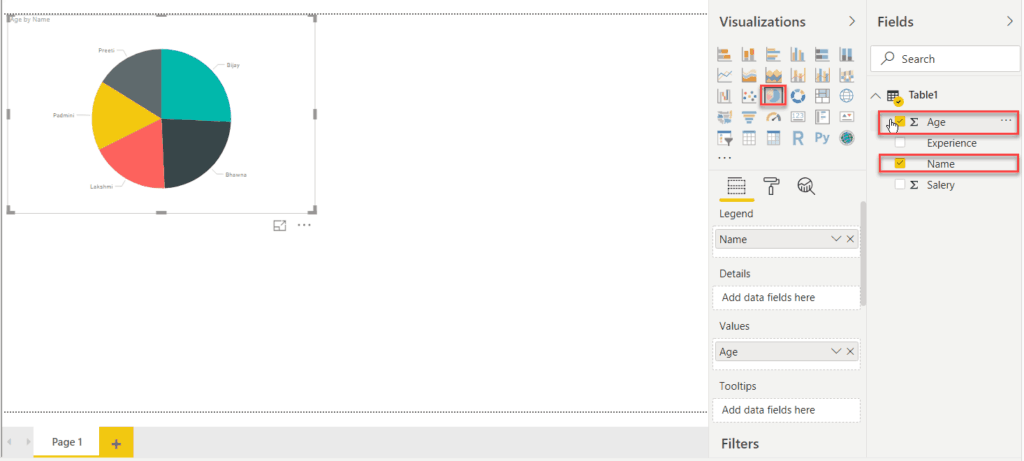
From the Visualizations option, list chooses one in which you want to display your data. From the Fields option, Choose all the field names which data you want to display in the visualization.
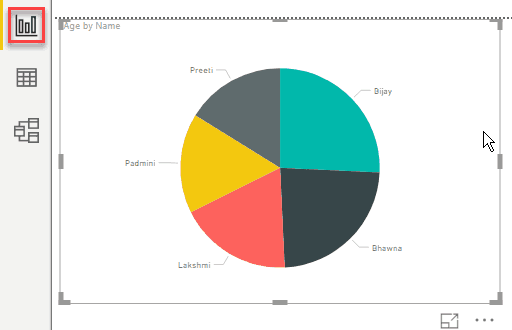
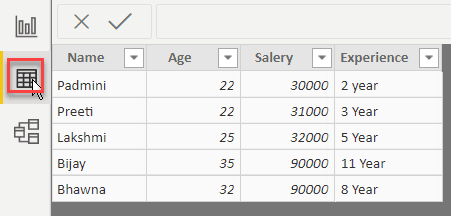
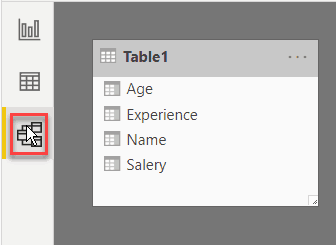
In the PowerBi desktop screen left side, we can see 3 tabs.
Report: The report tab will display the data visualization with the selected shape.
Data: The Data tab is displaying all the data which we have created in Excel.
Model: In the Model, Tab will look like the below.
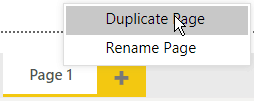
We can create a Duplicate page from the below of the page in the report tab. We can rename our page also.
Publish the Power BI Report
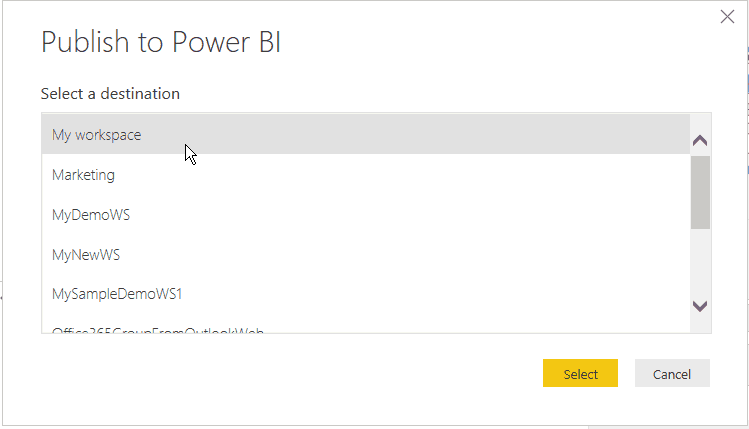
After creating the Power BI report, we can publish the Power BI report.
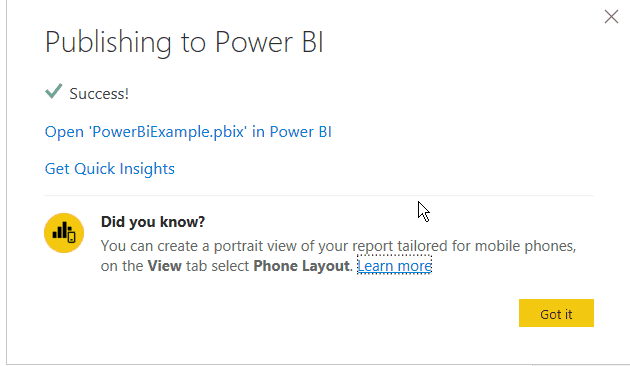
After our report publishing successfully we will get the below message.
This is how to create a power bi report using excel data source.
Read Power BI Date Slicer
How to Create Power bi report from SharePoint Online list
In this Power BI Tutorial, we will discuss how to create a power bi report from SharePoint online list.
Here, I have a SharePoint online list that has a few columns like the below:
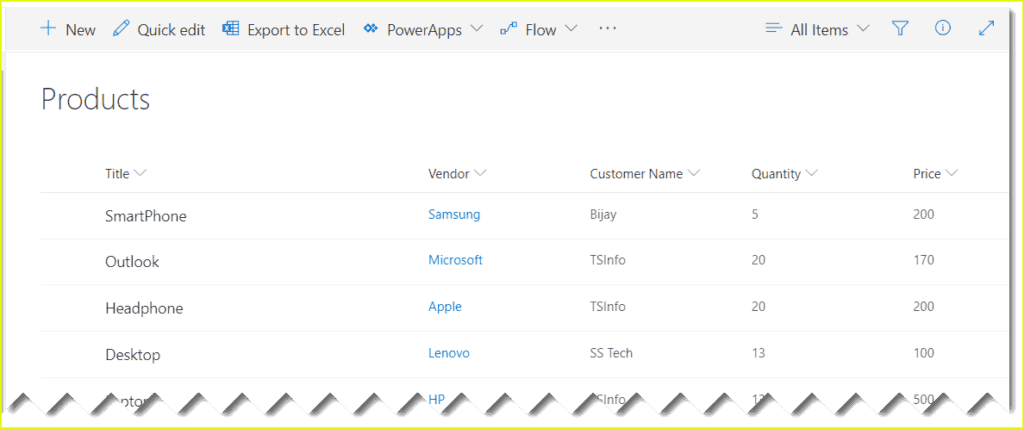
If you are new to power bi check out an article on what is power bi and install power bi desktop in your local machine. We will use a power bi desktop to create the report where we will add some visualizations also.
Create a power bi report from SharePoint online list
Follow the below steps to create a power bi report from SharePoint online list using power bi desktop.
Open power bi desktop. Then, from the Ribbon click on Home tab -> get data, Then from common data sources click on more like below:
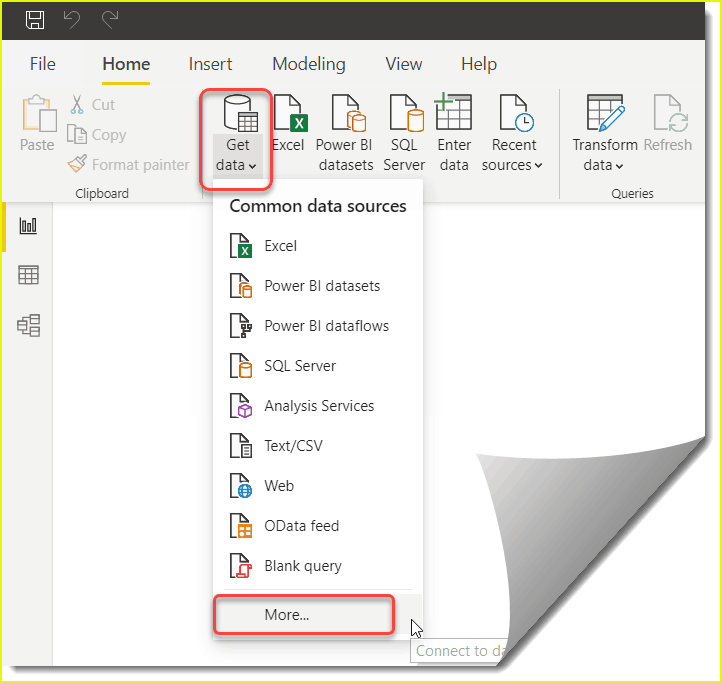
This will open get data dialog box which will display the various data sources.
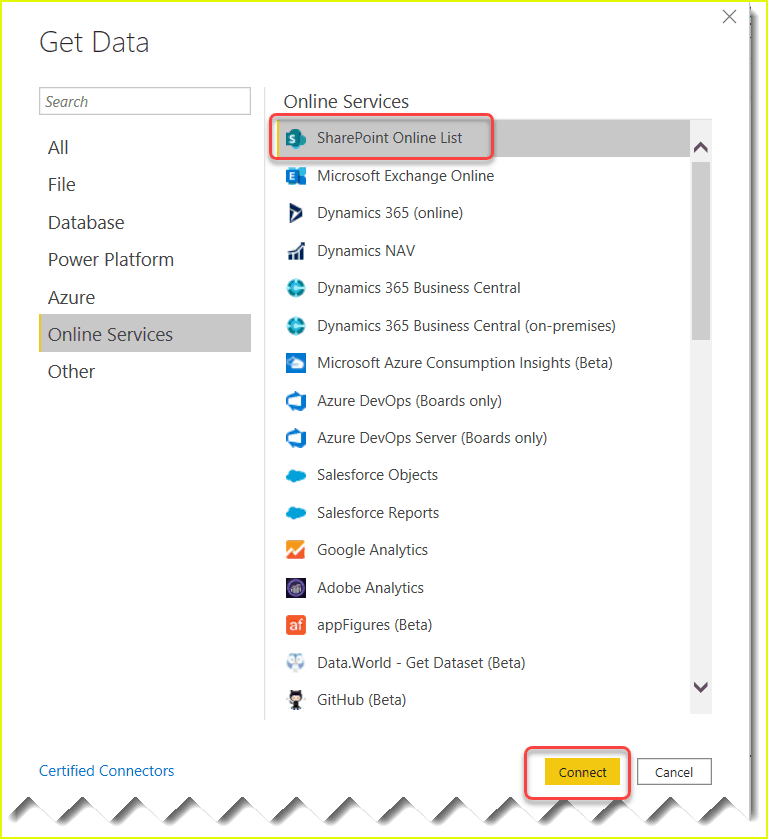
Select online services -> SharePoint online list and click on connect like below:

This will open a dialog box where you can enter the SharePoint site URL and click on Ok like below. If you are creating the report for the first time then it might ask you to enter the credentials which will be having access to the SharePoint online list or the SharePoint site.
In the next dialogue box, it will display all the lists which are presented in the SharePoint site. Select the lists where your data is presented and you want to create the report.
I have selected the product list and the vendors list below:
Share you will see two options Load and Transform Data.
If you will select load then it will load these two list data into the power bi desktop, but if you will select transform data then it will open the Power query editor where we can modify the data like we can select the number of columns we require or we can change the data type also.
Here I will select transform data like the below:
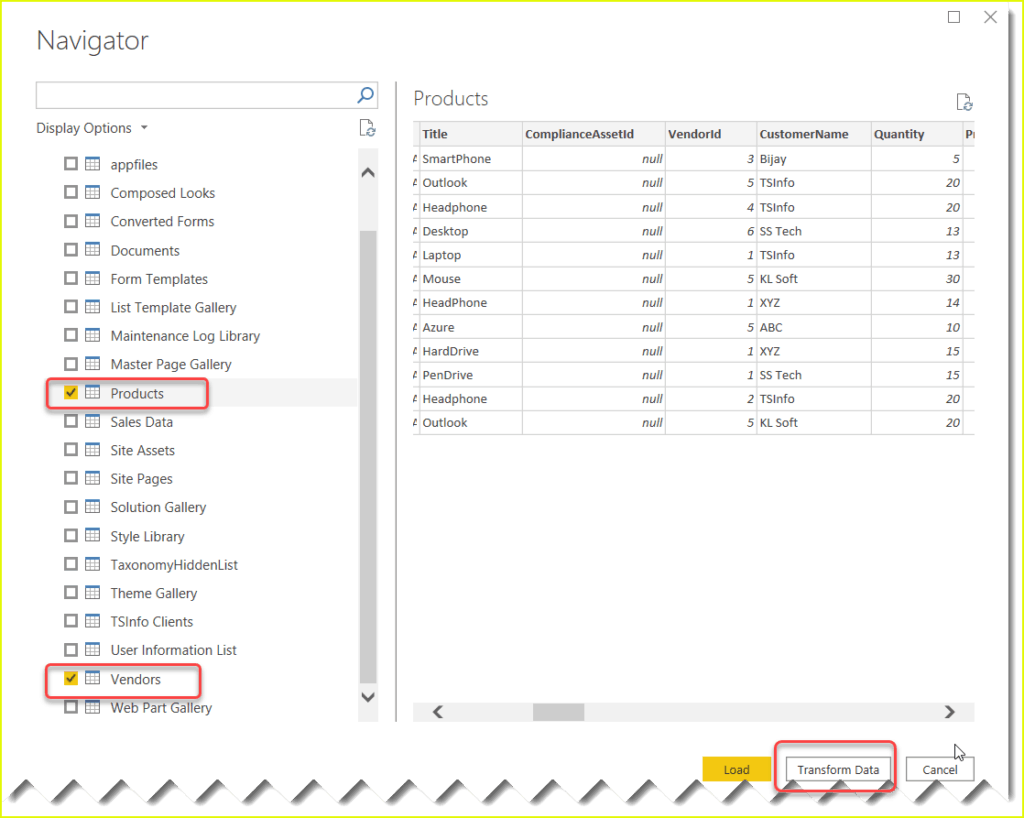
This will open the power query editor from where we can do some formatting of our data.
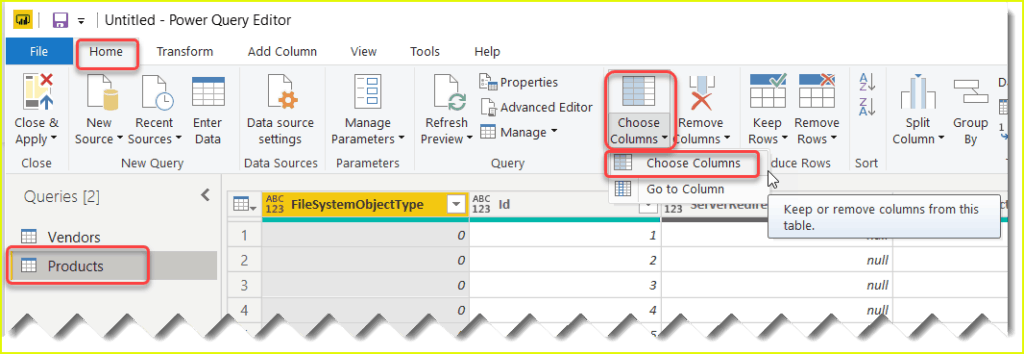
Select the required columns for the power bi report
By default, the Power query editor displays all the default columns from the SharePoint online list, but we might not require all the columns in our power bi report. so here we can select the columns, which you required for the report. from the left side.
From the ribbon. go to home -> Choose Columns like below.
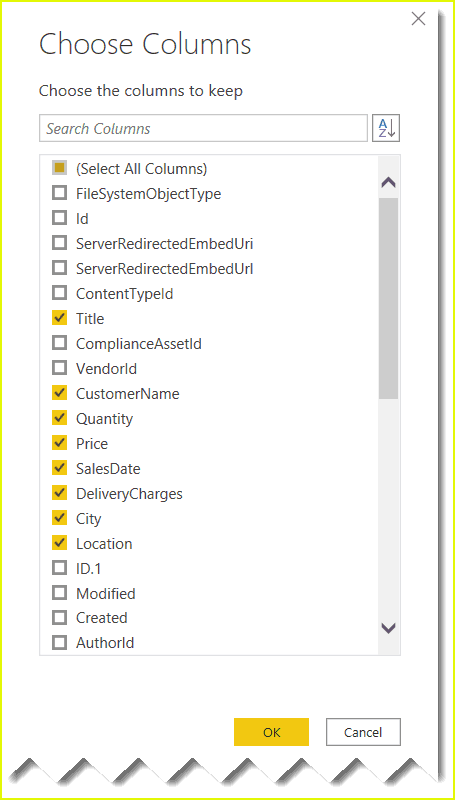
In the choose column dialogue box, it will display all the columns, you can simply uncheck all the columns and check the columns which we require only for our reporting. Here I have selected a few columns like below, Click on Ok.
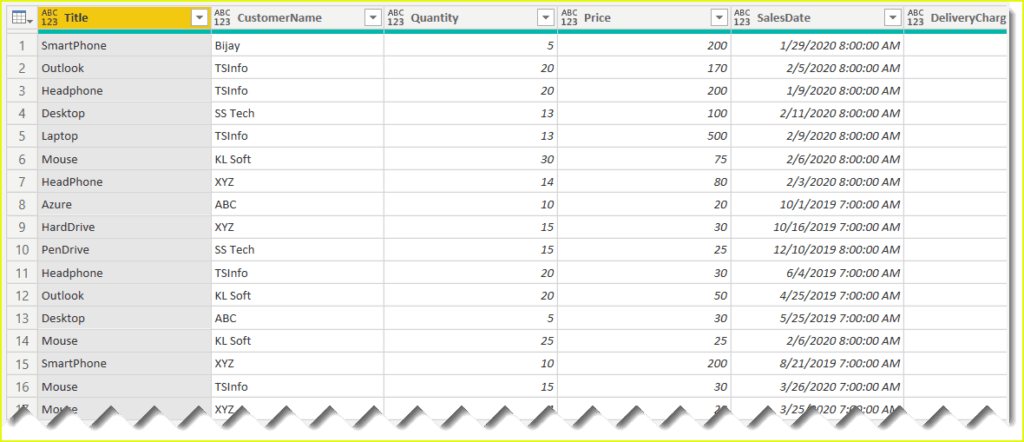
Now you can see the data source looks like below which can have only the selected columns rather displaying all the list columns.
Format SharePoint list lookup column
If you have any lookup column in the SharePoint list, then it will display like Record instead of the column value.
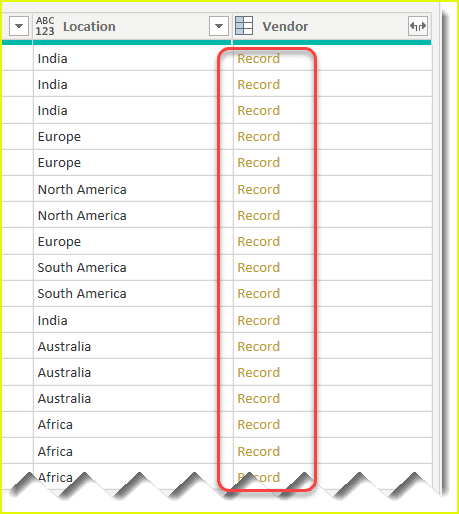
But we can format that so that it will display the values of each row.
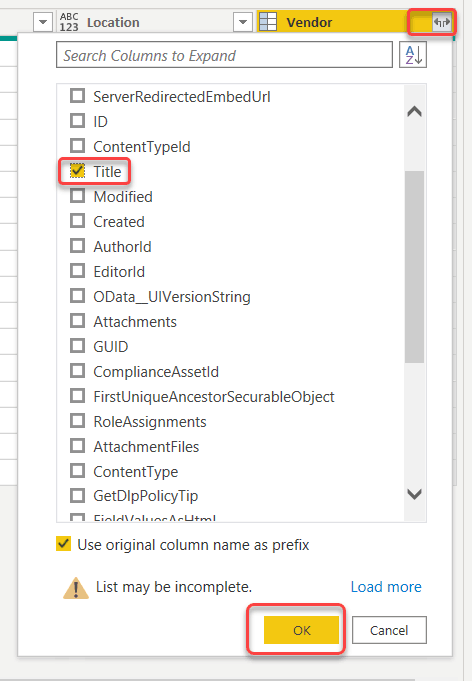
Click on the little icon, then contact all the columns and just uncheck which column you required like below and click on Ok.
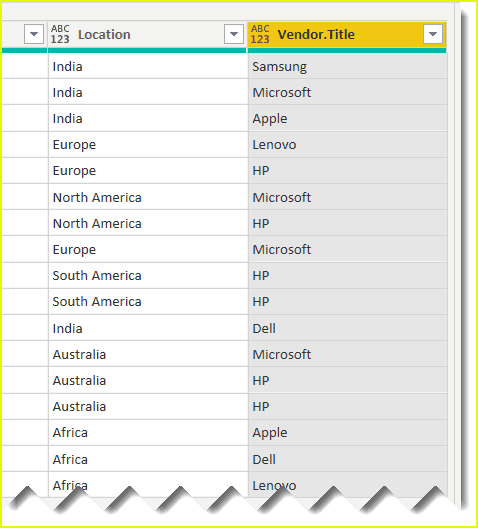
Now you can see it will display proper values in each record like below:
Read Power Query Date
Change data type of column in power bi
Another important thing we have to do for creating a report in power bi is to change the data type of the columns.
Follow the below steps to change the data type of a column in power bi.
Select the column and then from the home tab click on data type, by default it will be of type any, but you can select the proper data type. This is a date column, so I have selected the data type as date.
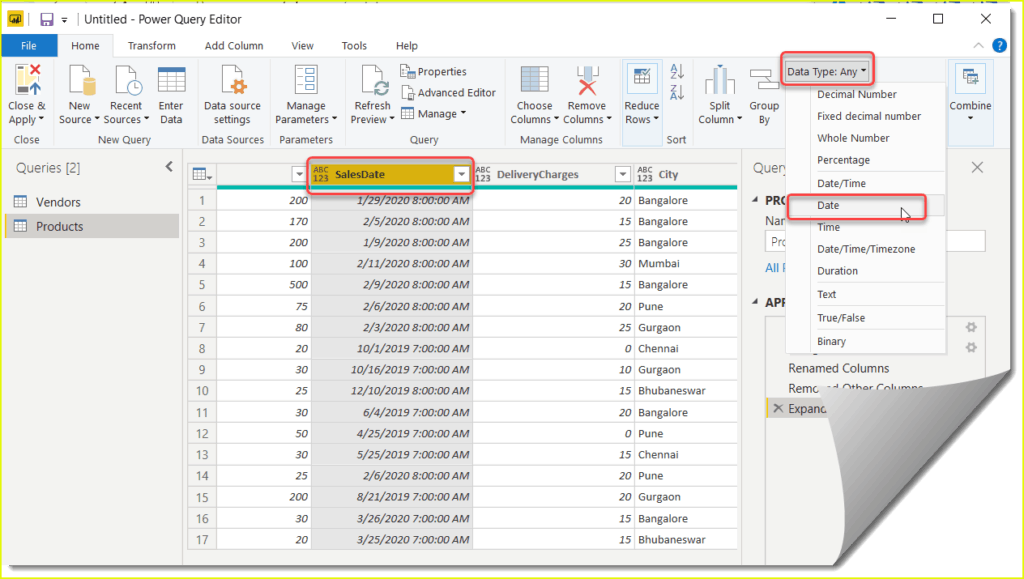
Note: if you are connecting from an excel, mostly water type will come properly. but in the case of SharePoint, it will display data type any which we have to change before creating a report in power bi.
In the same way, you can change the data type for the other columns, for the numeric data type you can select, whole number, for a single line of text you can select the data type as text. and for currency type, you can select the data type as currency.
You can also select multiple columns by pressing the control key and you can change the read attack at once. For example, here I can select all the columns which I want to make numeric and then change the data type to the whole number.
Rename Column Names in Power BI
We can also rename the column names to our requirements. To rename a column in power bi, right-click on the column and click on rename and then you can change the column name.
Or you can also go to the transform tab and then click on the rename button like below. We can also rename a power bi a column from the properties.
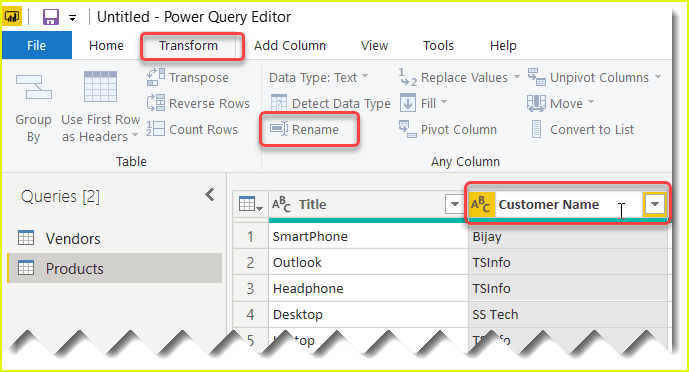
This finishes our data formatting and now we can create our report in power bi.
From the home tab click on close and apply button below:
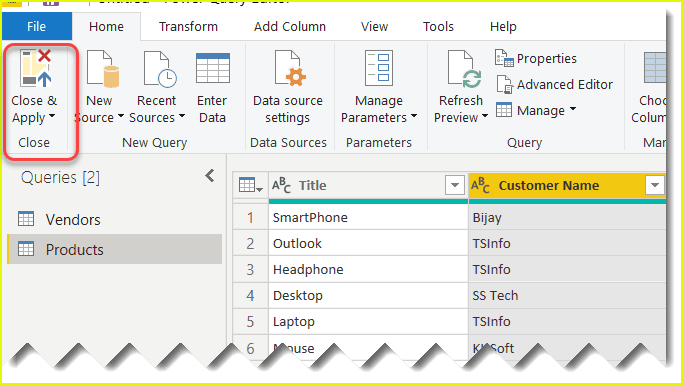
Here, I have also renamed the default Title column to Product Name.
Read Power Query Examples
Add Visualization to Power BI Report
We can add various visualizations from the report tab in power bi
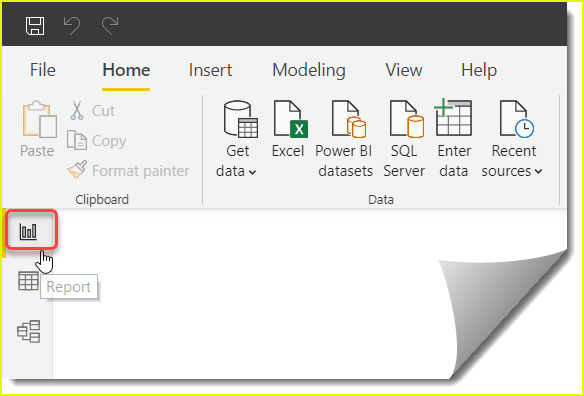
Here I have selected donut chart from the list of visualizations like below:
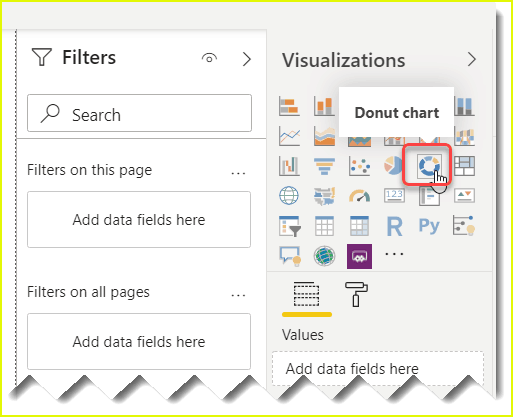
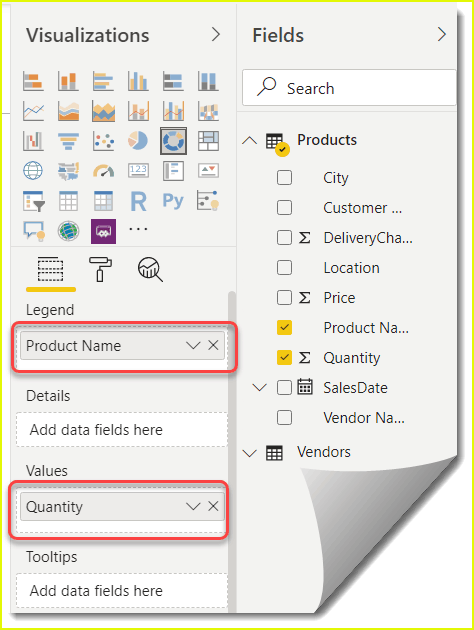
Once we added the donut chart, we can set of the properties so that the chart will appear.
In the legend, I have added the product name.
And in the Values I have added the Quantity like below:
Now, the Power BI chart will appear as below:
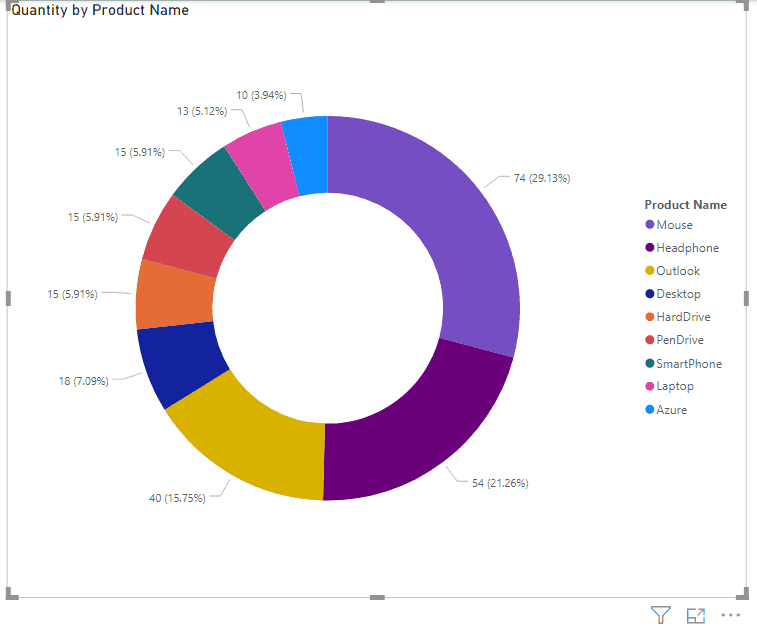
Click on the Save button to Save the Power BI report.
How to change data source in Power Bi
Let us see, how to change the data source in power bi, and what are the different ways to change the data sources in Power BI.
Suppose in your organization, you made a Power BI Report in your local system (Desktop). Now you want to change the Data Source of that report even after it is being created.
Now You may think about why you want to do this after creating the Power BI Report. Let me explain to you briefly so that you can understand easily.
Suppose in case of the Data Source location has changed or you want to jump from one server to another server as like from a development environment to a production environment.
So if these types of scenarios came after you created a Power BI report, then, in that case, you have to change the Power BI Data Sources.
Example:
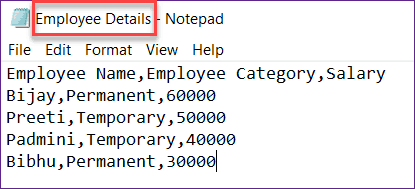
Let’s take an example. In this example, I have a Text Document in my local Desktop. The text document name is Employee Details which contains these below fields about the employees as:
- Employee Name
- Employee Category
- Salary
Now open your Power BI Desktop page and sign in with your existing Microsoft account. Once you signed in, just go to the File tab -> Select Get Data -> Click on Text/CSV as shown below.
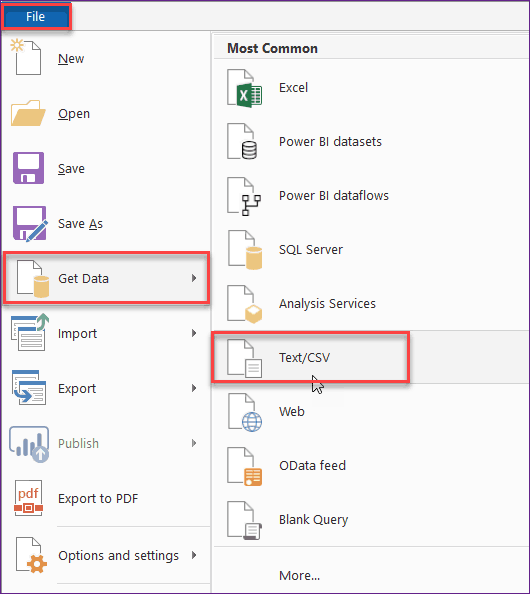
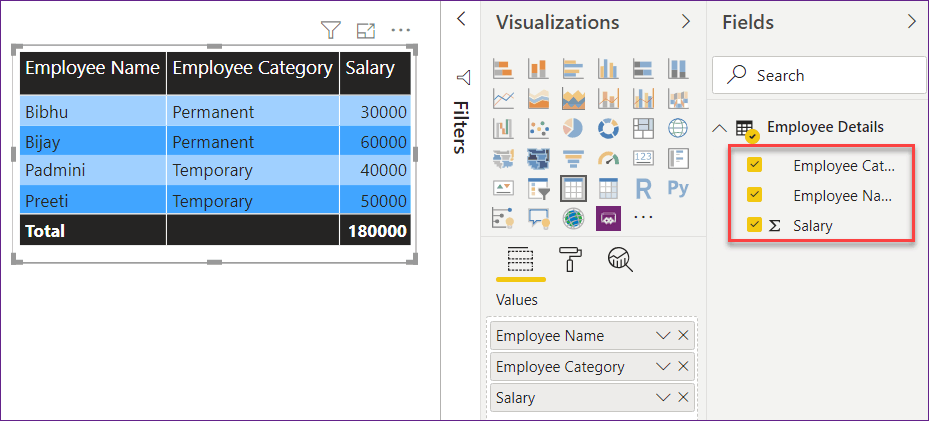
Browse your .txt file (Employee Details) and click on Load. Here, In the below screenshot, I have taken a Table under the Visualization section and shown all the Employee Details data using the table like the below screenshot.
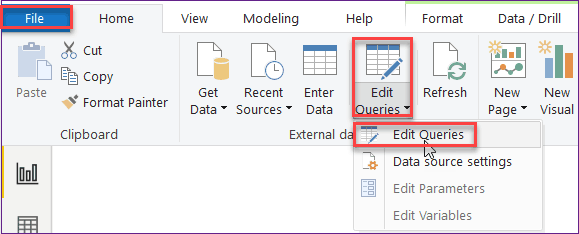
Now go to the Edit Queries button from the File tab and click on Edit Queries option.
After clicking on the Edit Queries option, you can see the below screen. In the ribbon section, Click on the Advanced Editor option from the Query section.

When you will click on the Advanced Editor option, you can see the current folder path as shown below.

Now you just rename a column name. Here, I have renamed my salary column to Employee Salary by double-clicking on the column name.
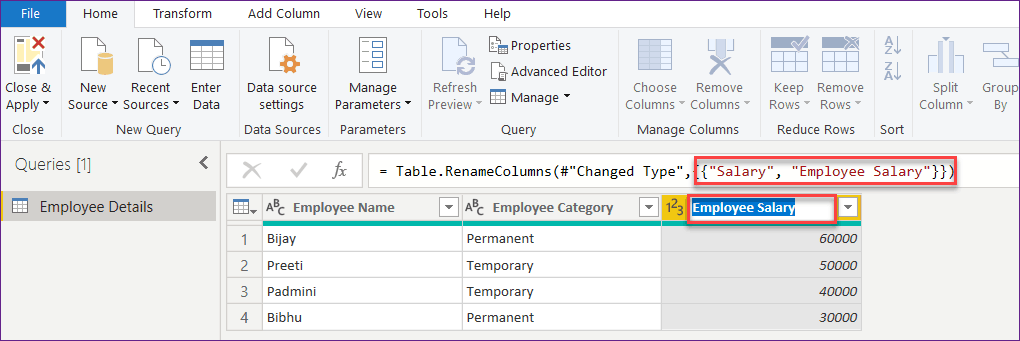
If you will click on again to the Advance Editor option, then you can see the changes screen as like the below screenshot.

Different ways to change Data Source Settings in Power BI
There are various ways present where you can change the Data Source Settings in the Power BI Desktop. Below are those different ways which I have explained below:
- By using Edit Queries:
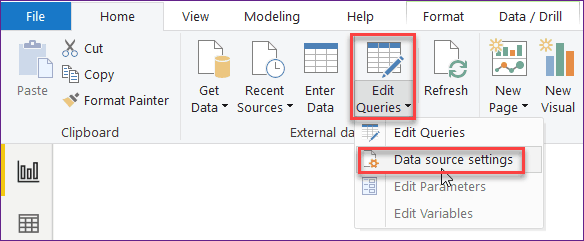
To change the Power BI Data Source, In your Power BI Desktop, Go to the File tab and then click on the Edit Queries button under the External data section. Then select Data source settings as shown below.
2. By using Data source settings:
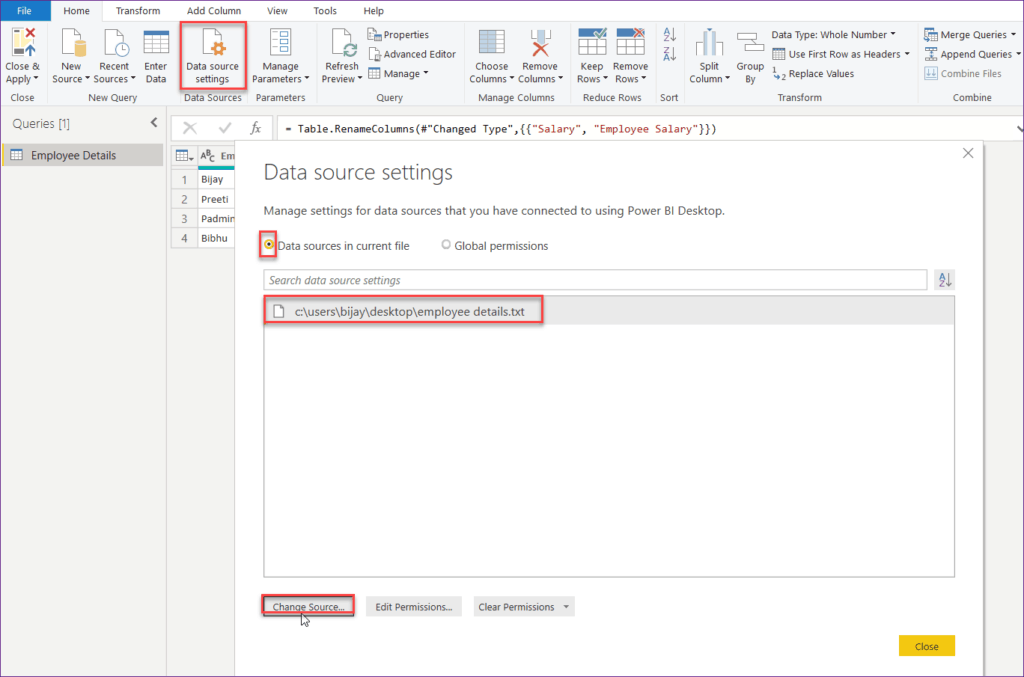
Similarly, In the Query editor page, you can directly click on the Data source settings button from the ribbon. Once you will click this button, then the Data source settings window will appear as shown below.
In the Data source settings window, Enable the Data sources in current file (by default it was enabled), Select the folder path and click on Change Source button as below.
3. By using Advanced Editor:
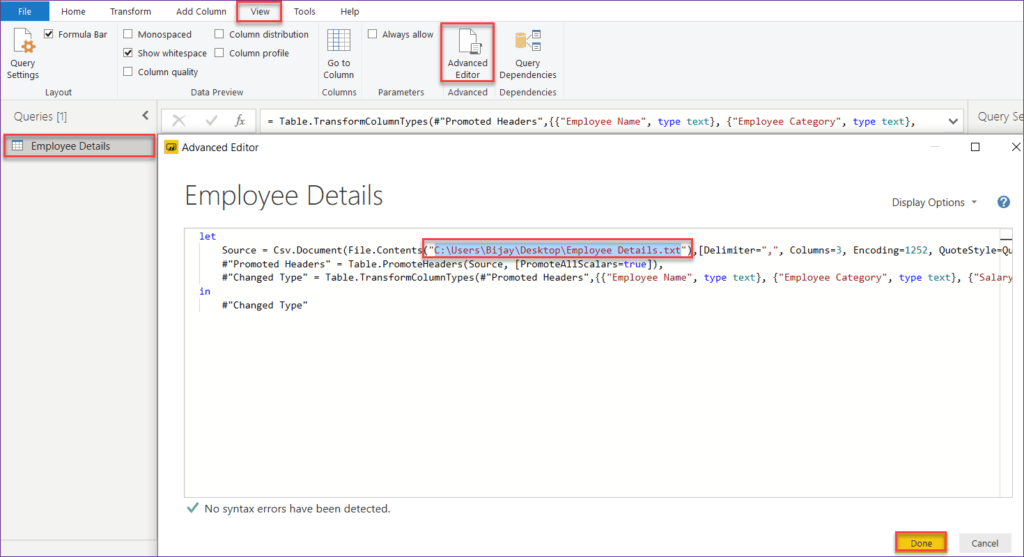
You can also change the Power BI Data Source by using the Advanced Editor button. Go to the View tab and click on the Advanced Editor button under the Advanced section.
Here in this Data Source settings window, you can view the full folder path of the Power BI Table.
If you want to change the data source path of the Power BI Report, then you can directly modify it here. Once it is done, then click on the Done button.
How to change Power BI Data Source Settings
In the Query Editor window, when you will click on the Data source settings button, then the below page will come.
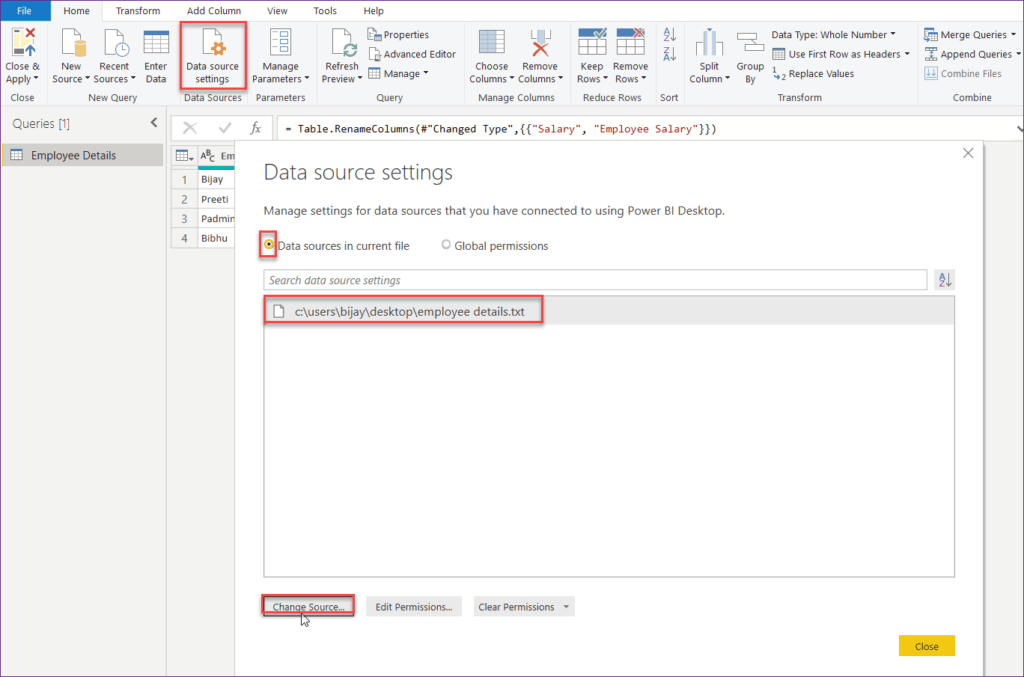
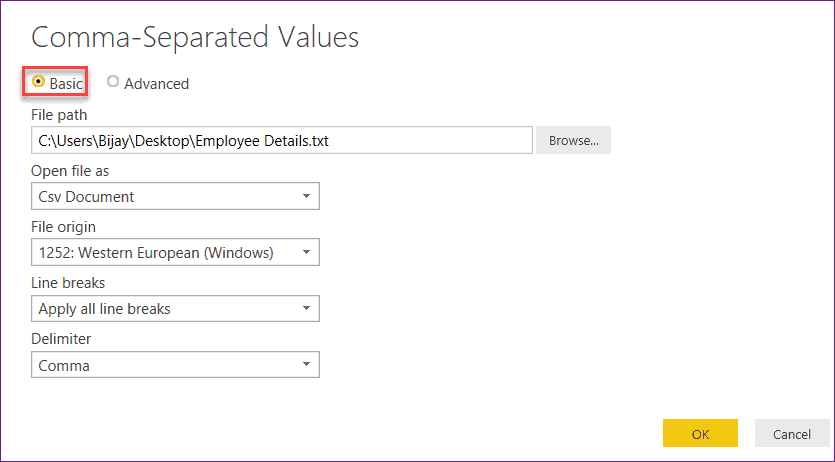
In that Data Source Settings page, when you will click on the Change Source button, then you can view this below page where you can modify your file path.
Enable Basic option (If it was not enabled). Here I will show you how to modify your file path.
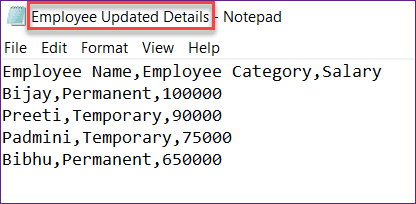
Here, I have another Text Document named as Employee Updated Details. In this text document, you can see all the fields with the same name as the previous document (Employee Details) one.
I have just updated the salary of each employee as below. Now I want to change the data source with this below-updated text document one.
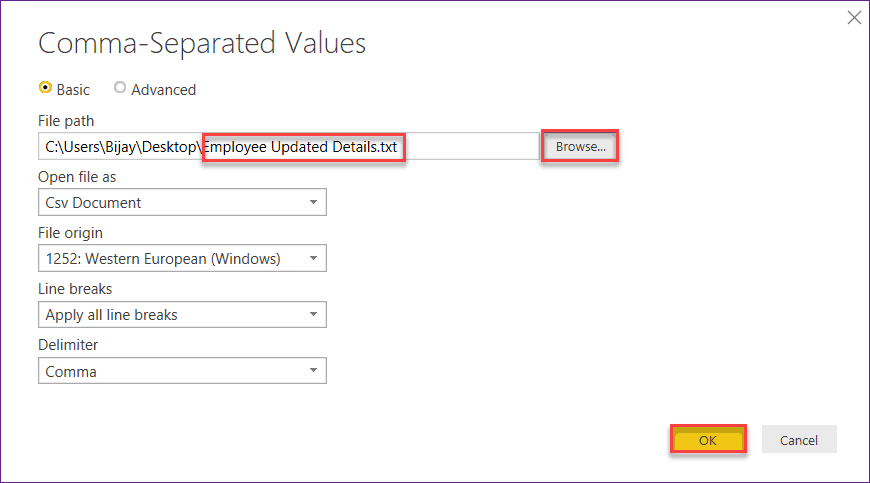
Click on Browse and choose your file from your local system where you have saved. As I have saved this updated file in the same folder path, So I have uploaded from the same location. Once it is done, Just click on OK.
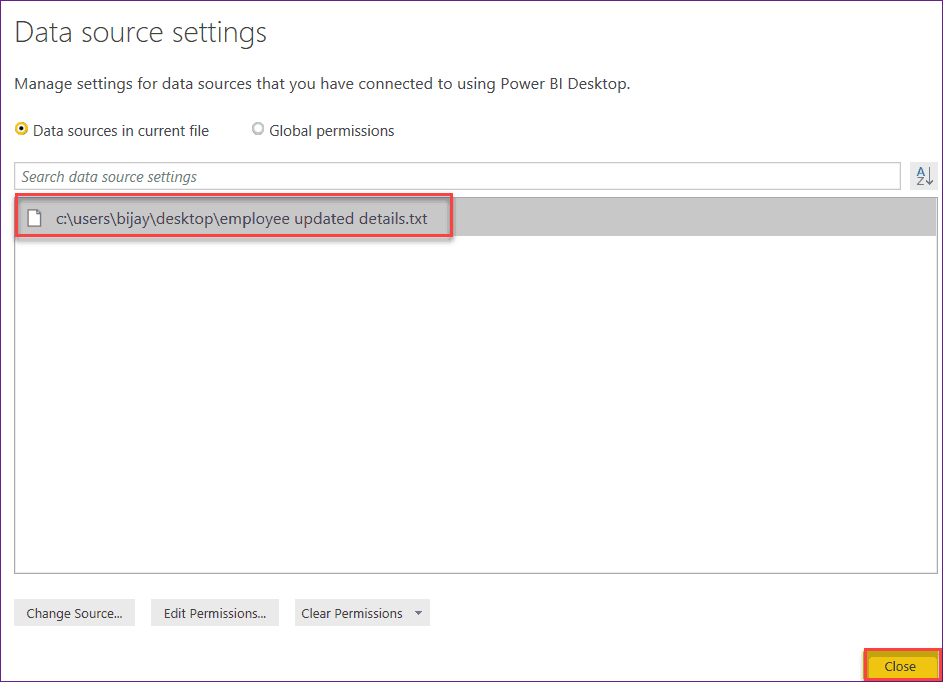
After clicking on OK, You can see your data sources in the current file path have been changed from Employee Details to Employee updated details as shown below. Just Close it.
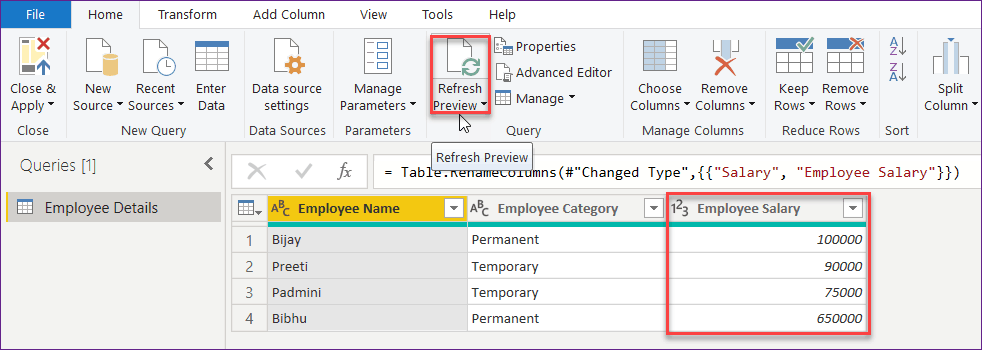
Once everything is done, just Refresh the page to view the updated data. When I have refreshed, then my Salary column is updated with new values as like the below screenshot. Just click on the Close and Apply button from the ribbon.
Now go to the Power BI Desktop page. On that page, you can see my Employee Details report with updated values as shown below.
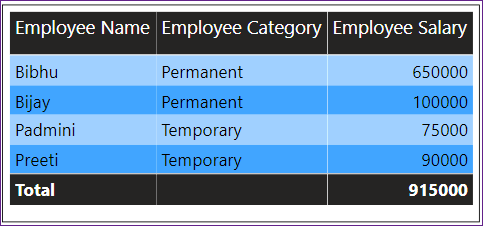
This is how to change a Power BI data source.
Power BI report data refresh
Let us check, how to refresh the Power BI Data automatically on a scheduled basis.
Basically, When we are modifying or updating some new data in the list or in any application, It cannot refresh automatically. For that, We are using the Refresh button every time to update the Power BI Report. But, it usually should not be.
It should be an auto-refresh on a particular time period. That means, At a specific time, the report will update automatically without using the Refresh button. To refresh the data on a scheduled basis, follow these below steps:
Step-1:
In the Power BI Report Server page, Go to My workspace from the left navigation and click on the Datasets tab from the top of the page.
Go to your Power BI Report that you want to make it scheduled. Click on the Schedule refresh icon which is present on the right side of the report.
Also, you can open the Schedule refresh page by using the more (…) option and selecting the Settings option.
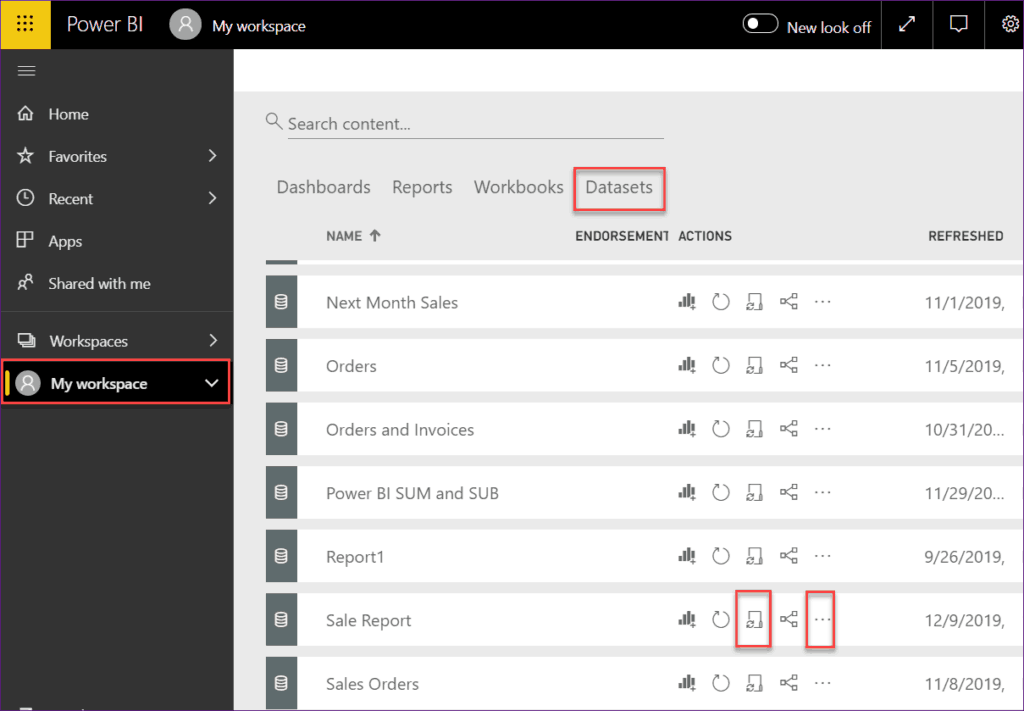
Step-2:
Once you will click on the Schedule refresh icon, the below page will appear. Go to the Datasets tab from the top and then expand the Scheduled refresh option.
When you will expand the Schedules refresh option, you will see there will disable the Keep your data up to date option. Just toggle on this option.
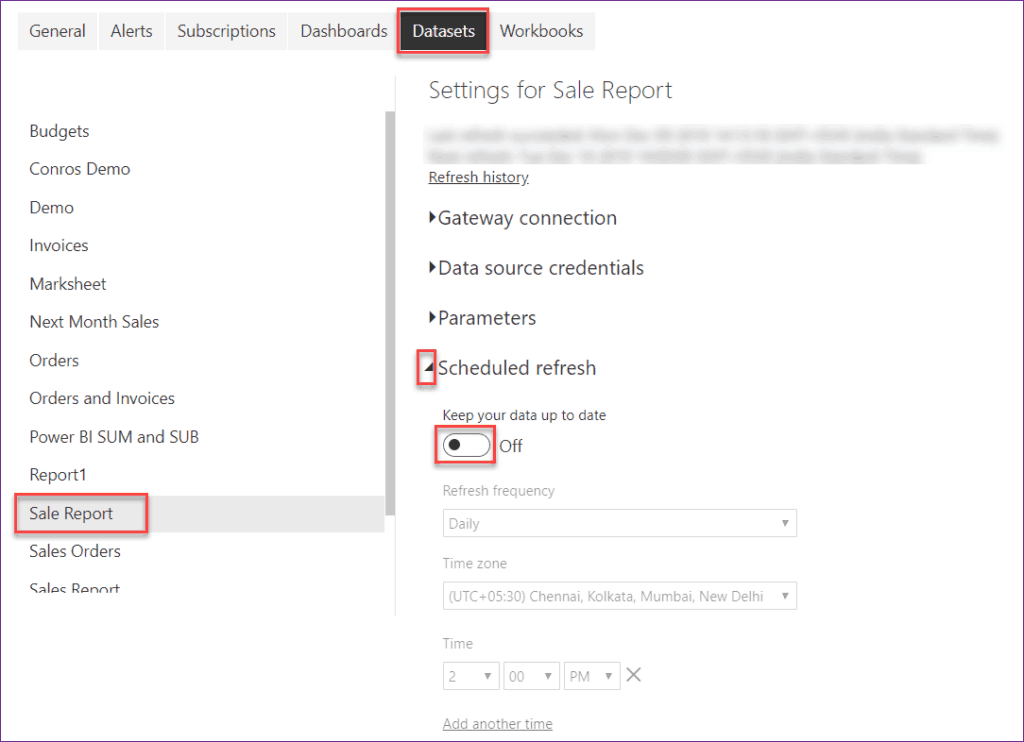
Step-3:
When you will toggle on the switch of Keep your data up to date option, then the rest of the other options will also enable. You need to fill these below options:
- Refresh frequency: Select the refresh frequency whether you want it Daily refresh or Weekly refresh.
- Time zone: Select a time zone from the drop-down that depends upon your area zone.
- Time: Insert a time that helps to refresh the data automatically.
- Add another time: If you want to refresh the data more than one time, then you can select this option and insert the time that you want.
- Send refresh failure notifications to the dataset owner: If you want to get the failure notifications of data refresh, then check this option.
- Email these users when the refresh fails: Enter the Email addresses of those users who will get the failure notifications when the refresh fails.
Once completing all these things, simply click on the Apply button as below screenshot.
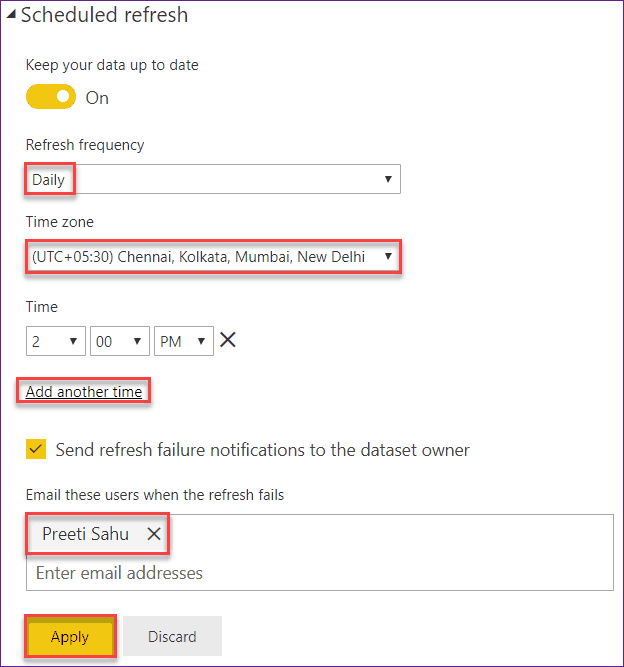
Then the data will refresh automatically at a particular time that you gave. Once the data refresh is done in the Power BI Report Server, then the refresh details will look like the below screen.
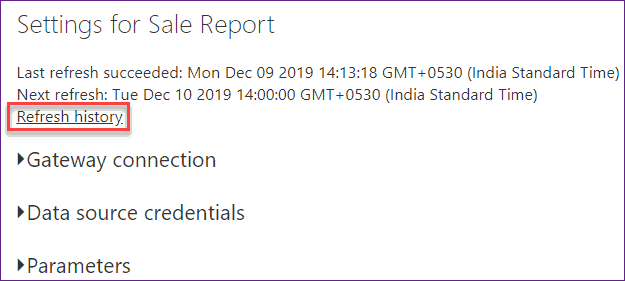
It will show the Last refresh succeeded message as well as the Next refresh when it will happen.
If you want to view the refresh history, then simply click on the Refresh history link as shown below.
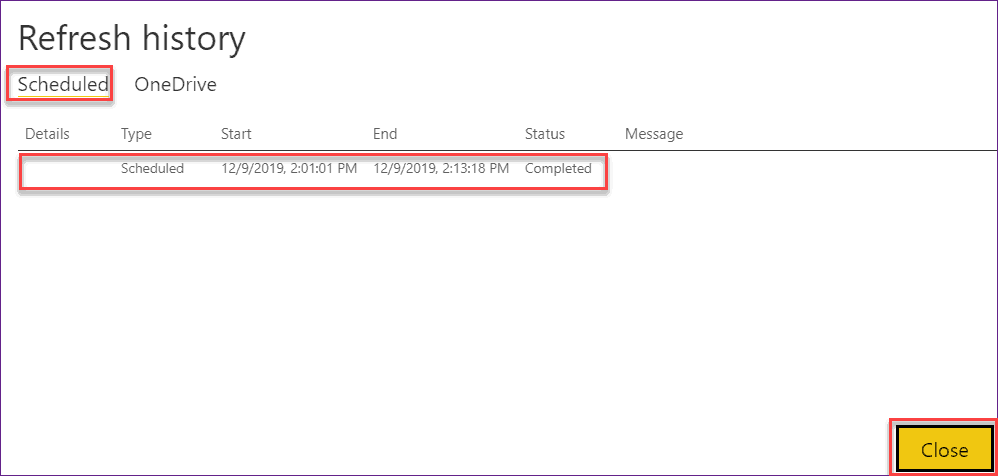
In the Refresh history page, you can view the Scheduled refresh details in the below screenshot.
You may like the following Power BI tutorials:
- Power bi free vs pro vs premium
- What is the difference between calculated column and measure in Power BI
- How to create and use Power BI Bookmarks
- Create table using Power Query in Power BI
- Power BI integration with PowerApps Portals
Conclusion
In this tutorial, we learned the below things:
- How to create a report in Power BI Desktop
- How to create a power bi report from excel
- How to create power bi report from sharepoint online list
- Select the required columns for the power bi report
- How to Format SharePoint list lookup column
- How to Change the data type of column in power bi
- How to Rename Column Names in Power BI
- How to Add Visualization into Power BI Report
I am Bijay a Microsoft MVP (10 times – My MVP Profile) in SharePoint and have more than 17 years of expertise in SharePoint Online Office 365, SharePoint subscription edition, and SharePoint 2019/2016/2013. Currently working in my own venture TSInfo Technologies a SharePoint development, consulting, and training company. I also run the popular SharePoint website EnjoySharePoint.com
