Did you know that you can capture the current state of your report page with the help of Power BI Bookmarks? Yes, that’s right.
In this tutorial, we will talk about what is a bookmark in Power BI, what is the use of bookmark in Power BI, and Power BI Bookmark navigator with examples. Additionally, we will discuss the topics below:
- How to create bookmark in Power BI
- Power BI bookmark current page
- Power BI bookmark navigator
- Power BI button without ctrl
- Power BI bookmark slicer
- Power BI bookmark keeps the filter
Bookmarks in Power BI
Power BI bookmarks are like a digital snapshot or a saved view of your report. It captures the state of your report at a specific moment, including filters, slicers, selections, and the overall layout.
Think of it as a way to bookmark a particular view or analysis so you can easily return to it later without having to set everything up again manually.

Power BI Bookmark Panel
Here, we will learn how to activate the Power BI Bookmark panel.
To enable the Power BI Bookmark panel, open Power BI Desktop, then go to the “View” tab and click the Bookmark icon.

After clicking on the Bookmark icon, the Bookmark pane opens.
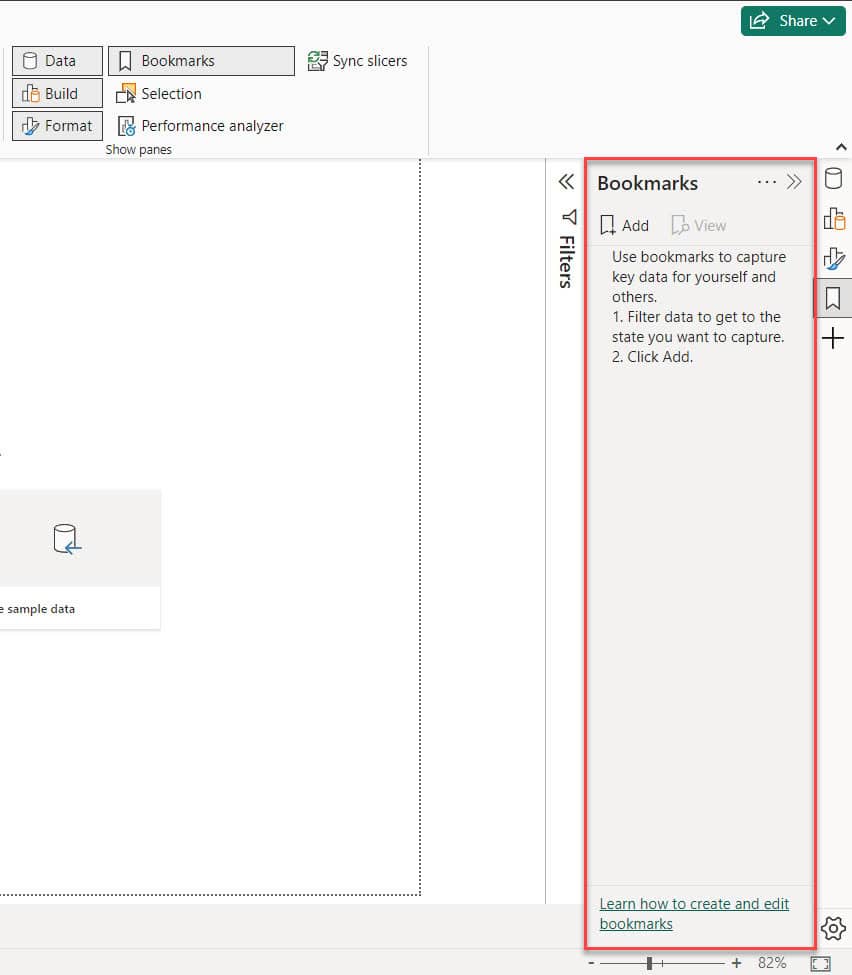
This way, you can open the Power BI Bookmark panel.
How to Create Bookmark in Power BI
Now we see how to create a bookmark in Power BI.
Here, I want to create when a user clicks on the bar chart, a bar chart will appear. And when they click on the donut chart, a donut chart will show up instead.
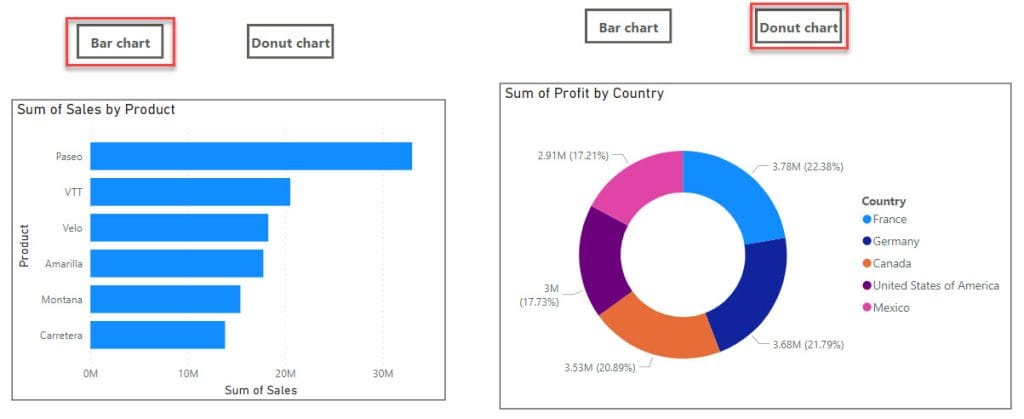
Here, I have already created two Power BI charts, a bar chart and a donut chart, for this example.

Now follow the below steps:
1. Now, under the Insert tab, expand Buttons and click the Blank button.
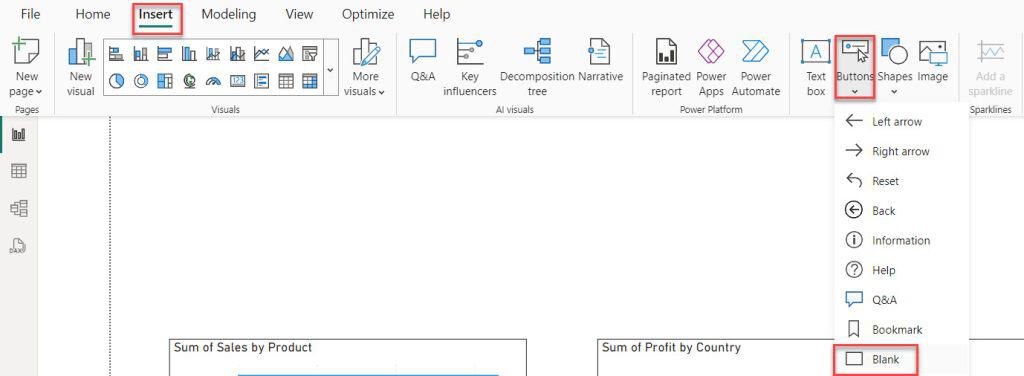
Then, add two blank buttons in the report view.
2. Then, open the Selection pane and Hide the Bar chart(Sum of Sales by Product).

3. After that, you can hide the bar chart. Then, open the Bookmarks pane by clicking on the “+Add” button and add bookmarks. After that, double-click to rename it “Donut chart.”
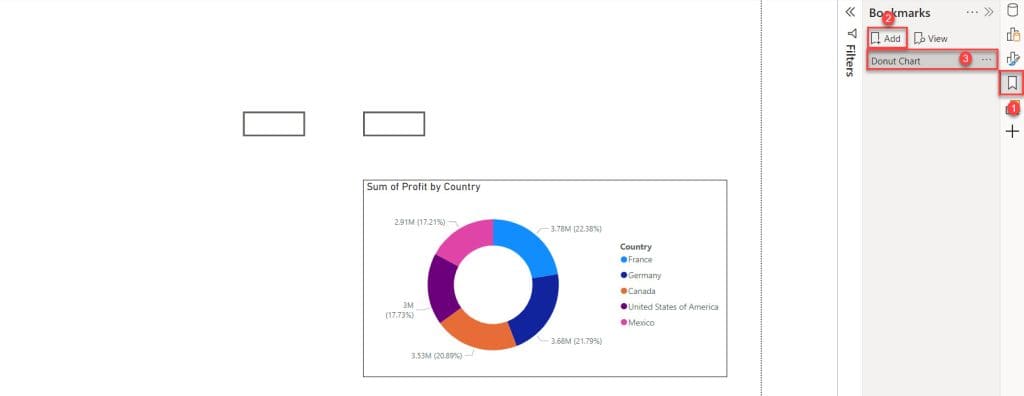
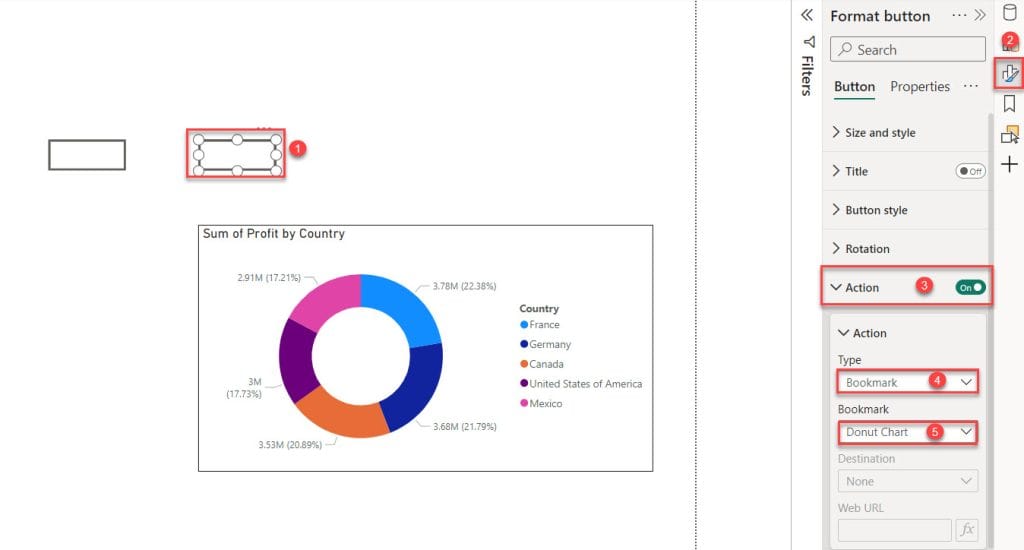
4. First, choose a blank button. Then, click on the “Format” button. After that, go to “Action” and select “Type” as a Bookmark. Select Bookmark as “Donut Chart.”
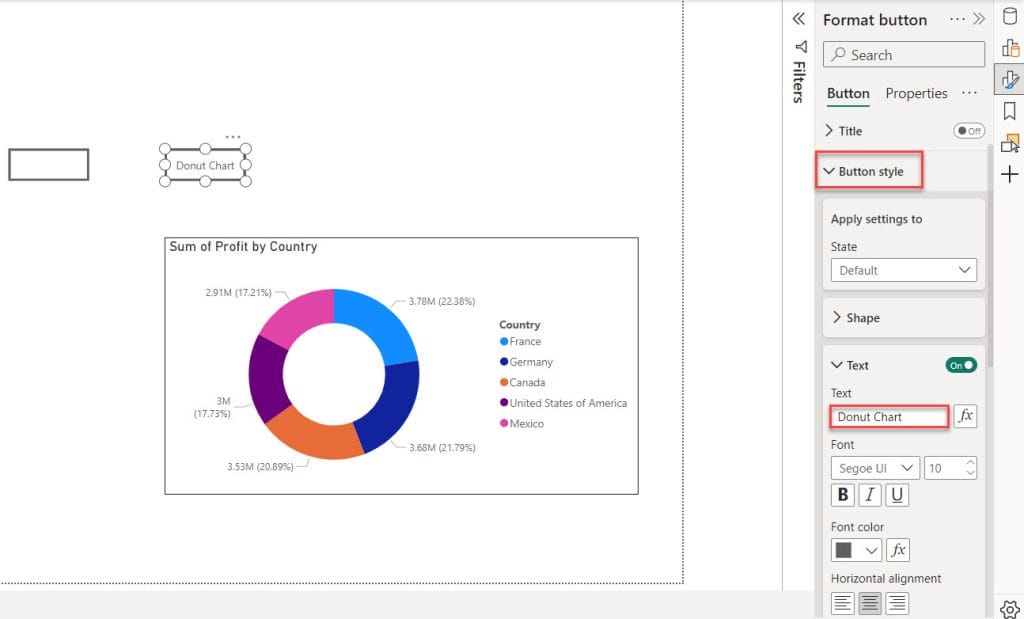
5. Expand the Button style, then expand the Text, then give the name as Donut Chart.
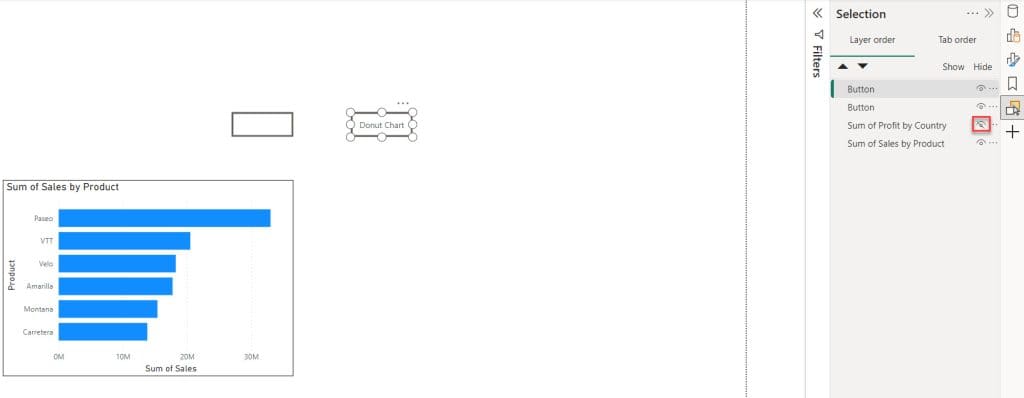
6. Then hide the donut chat and unhide the bar chart.
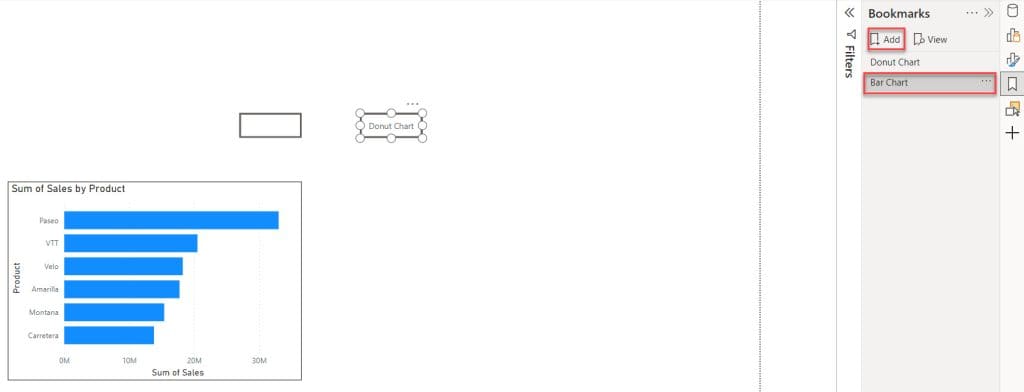
7. Then add another bookmark and name as Bar Chart.
8. Then, choose another blank button. Then, click on the “Format” button. After that, go to “Action” and select “Type” as a Bookmark. Select Bookmark as “Bar Chart.”
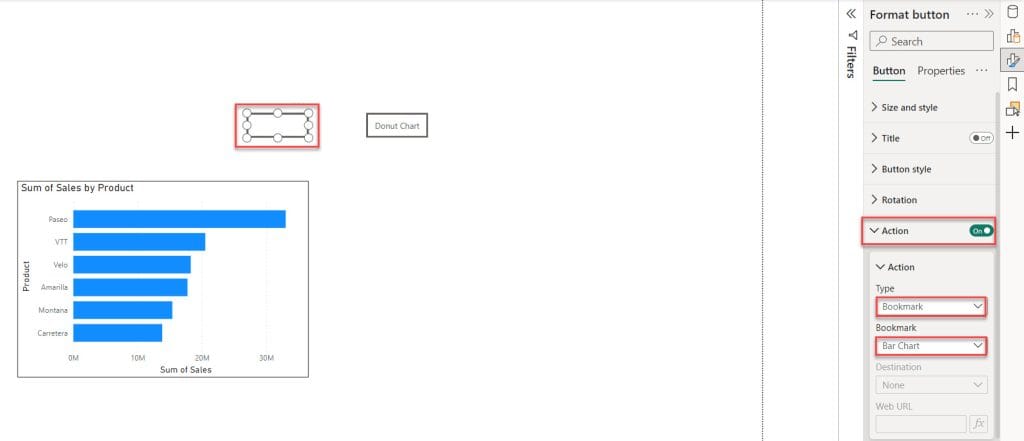
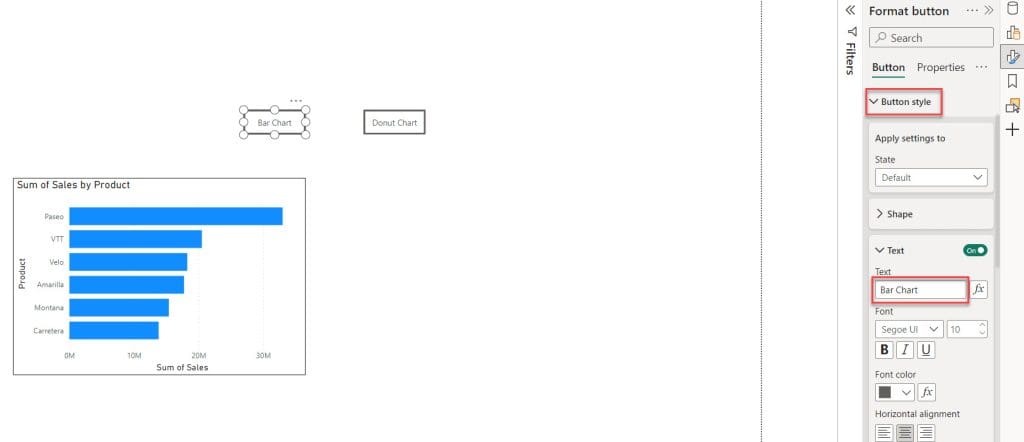
9. Expand the Button style, then expand the Text, then give the name as Bar Chart.
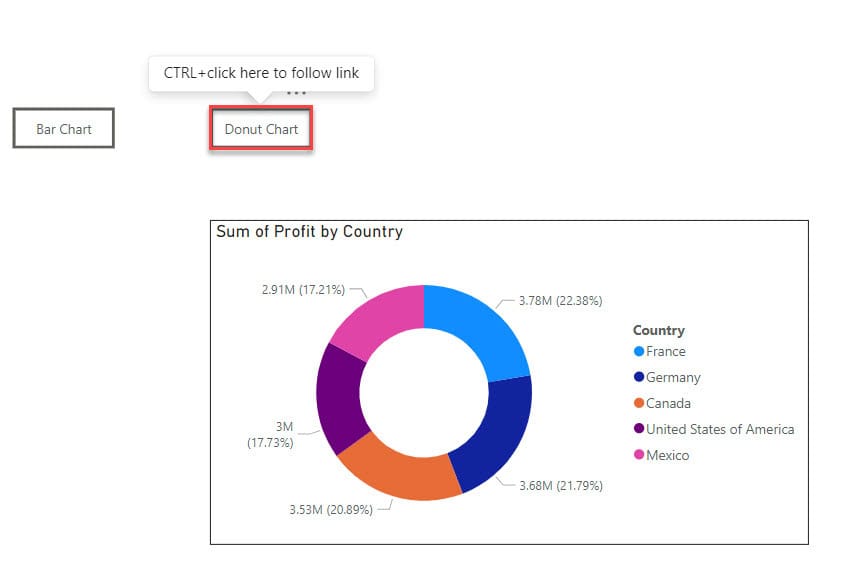
10. Holding the Ctrl key and clicking on the “Donut Chart” button will take you to the “Donut Chart” view.
11. Holding the Ctrl key and clicking on the “Bar Chart” button will take you to the “Bar Chart” view.
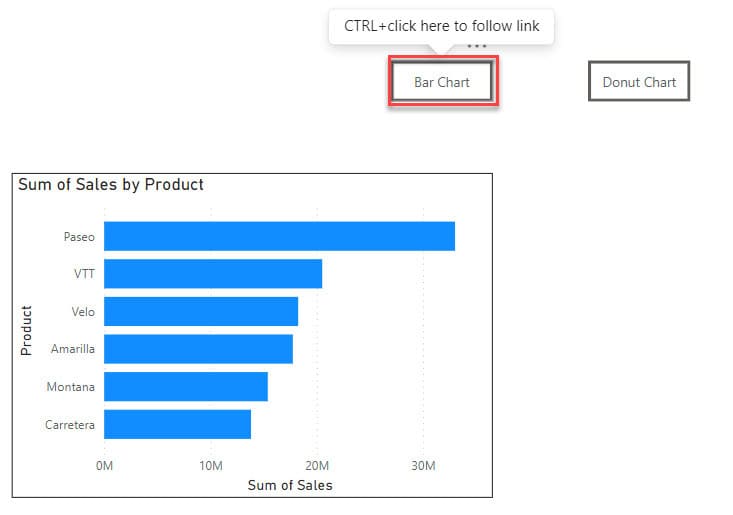
This way, you can use bookmarks in Power BI.
Power BI Bookmark Current Page
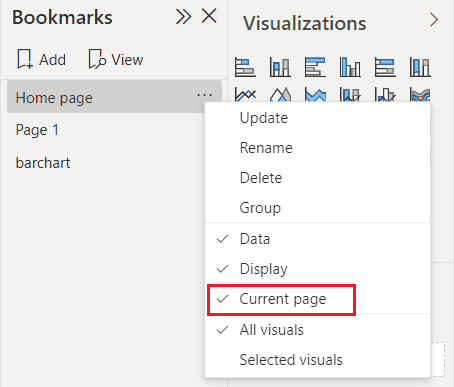
The Power BI bookmark “Current page” option lets users go to the current page’s view even if they apply the bookmark from another page. If you don’t select the “Current page” option, the bookmark will still be applied, but it will keep you on the page where you applied it.
Power BI Button Without Ctrl
Now, let’s see how bookmarks work in Power BI without Ctrl-click.
In Power BI Desktop, we need to use Ctrl-click to activate the bookmark button. However, when we publish the report to Power BI service, we can use the bookmark option without needing to use Ctrl-click.

Power BI Bookmark Slicer
Here, we will see an example of a Power BI Bookmark slicer.
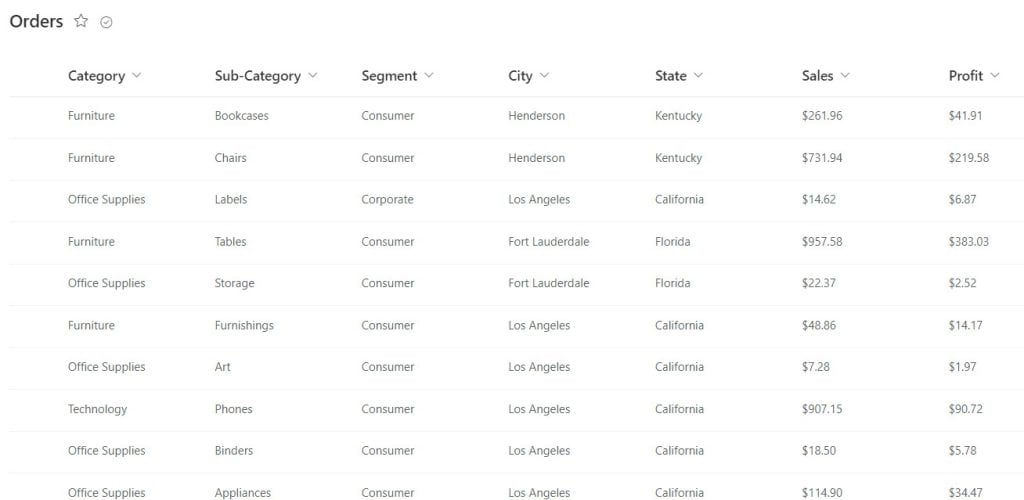
Here, we have a SharePoint list (Orders) that contains below columns with various data types:
| Columns | Data Types |
|---|---|
| Category | Single line of text |
| Sub-Category | Single line of text |
| Segment | Single line of text |
| City | Single line of text |
| State | Single line of text |
| Sales | Currency |
| Profit | Currency |
Now follow the below steps:
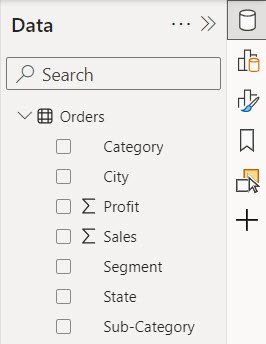
1. Open Power BI Desktop and load the data set. Then, in the Data pane, you can see your data set.
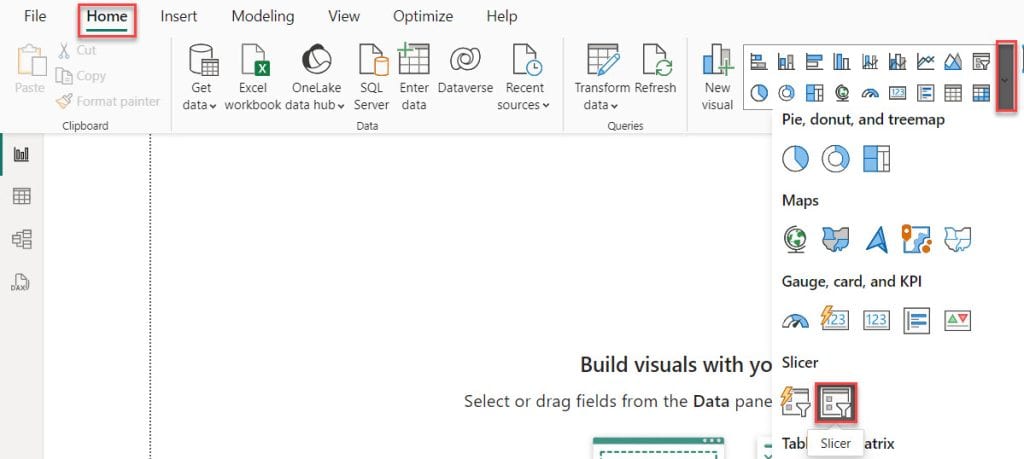
2. Under the Home tab, click “Visual gallery,” then click “Slicer.”
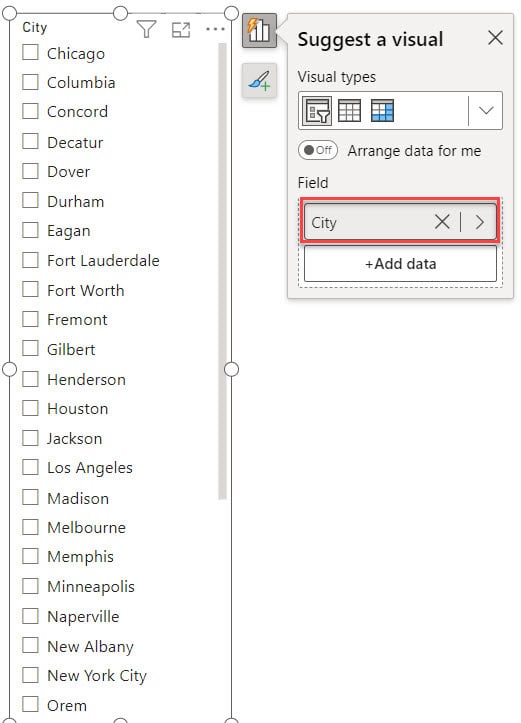
3. Then, using the +Add data option, add City to the Field.
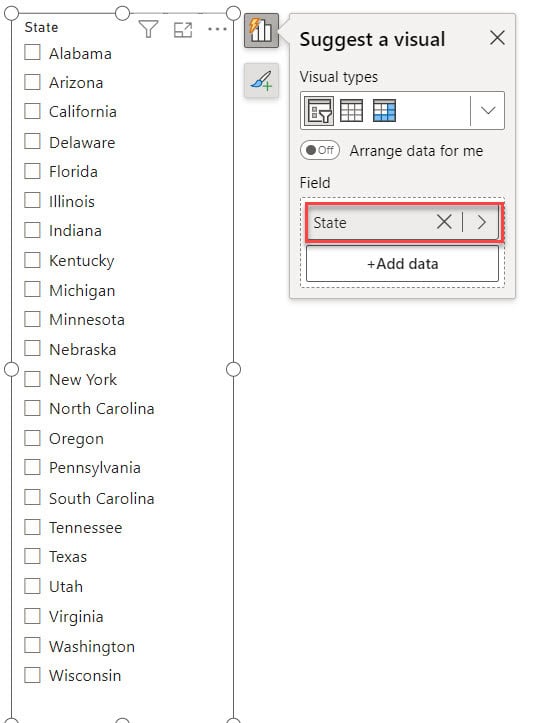
4. Then add another Slicer as state.
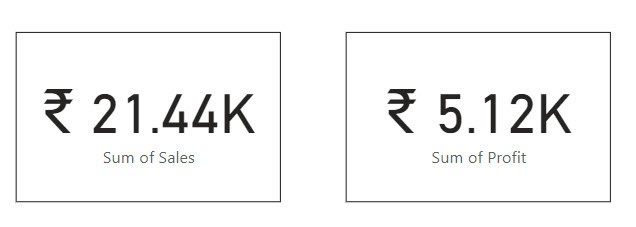
5. Add two card visuals in the Report view.
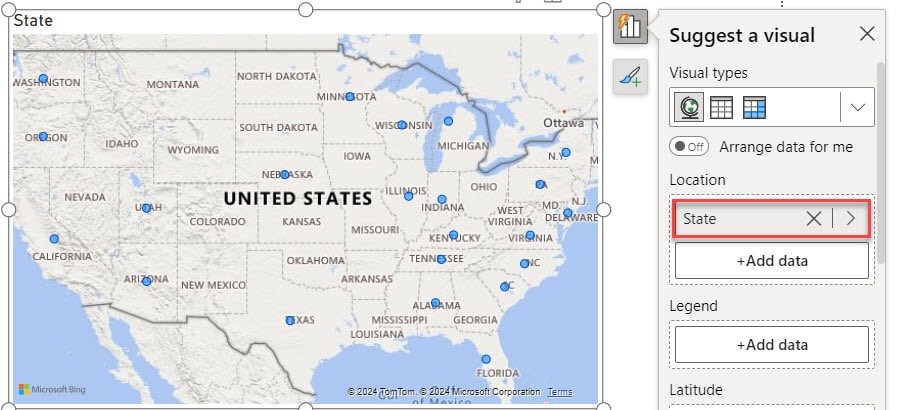
6. Add a map visual in the report view.
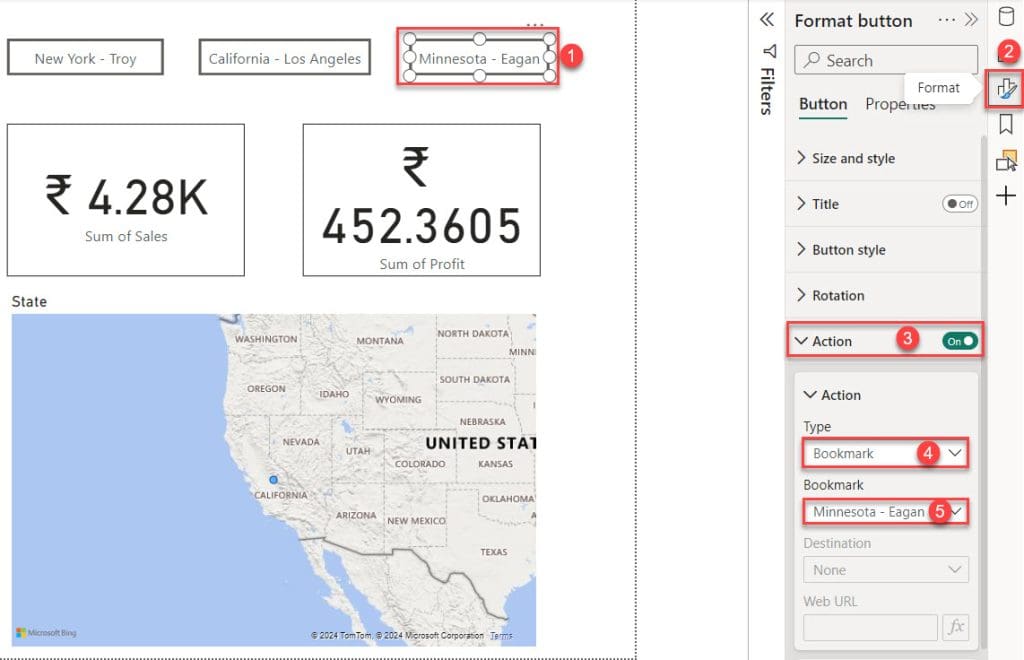
7. Add 3 blank buttons and give the name as New York – Troy, California – Los Angeles, Minnesota – Eagan.
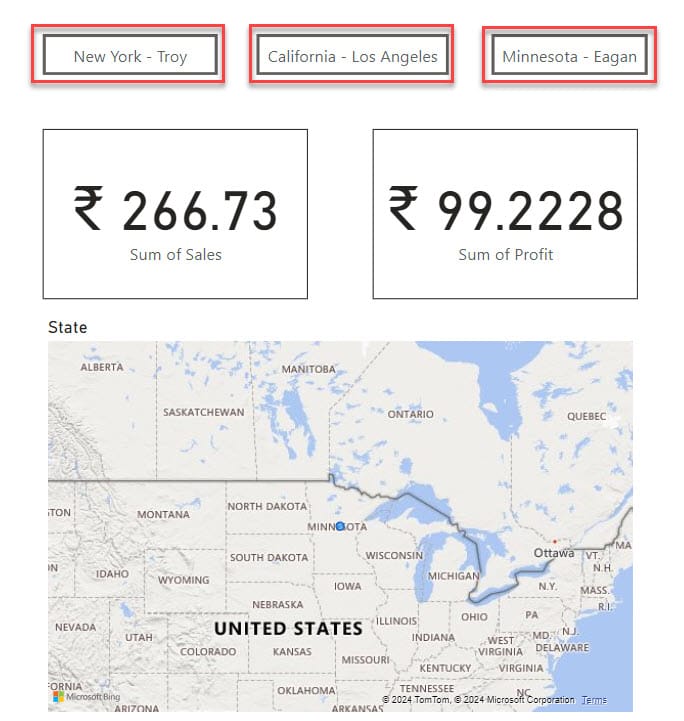
8. First, choose “New York” from the State slicer. Next, select “Troy” from the City slicer. After that, add a bookmark and name it “New York – Troy.”

9. First, choose “California” from the State slicer. Next, select “Los Angeles” from the City slicer. After that, add a bookmark and name it “California – Los Angeles.”

10. First, choose “Minnesota” from the State slicer. Next, select “Eagan” from the City slicer. After that, add a bookmark and name it “Minnesota – Eagan.”
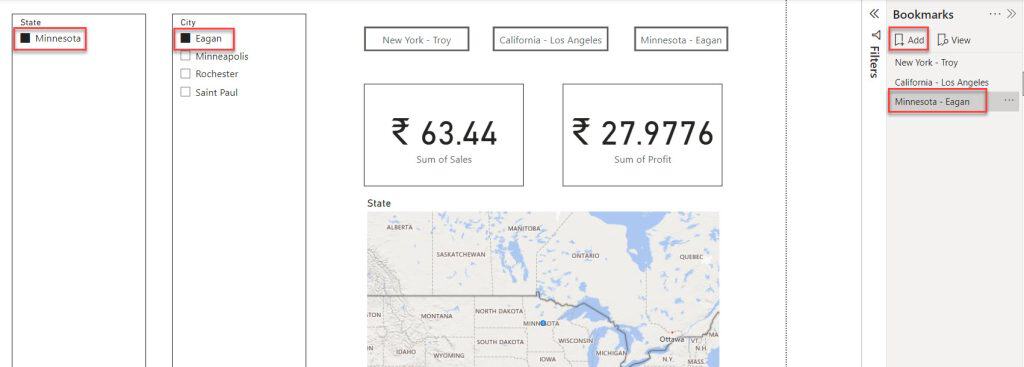
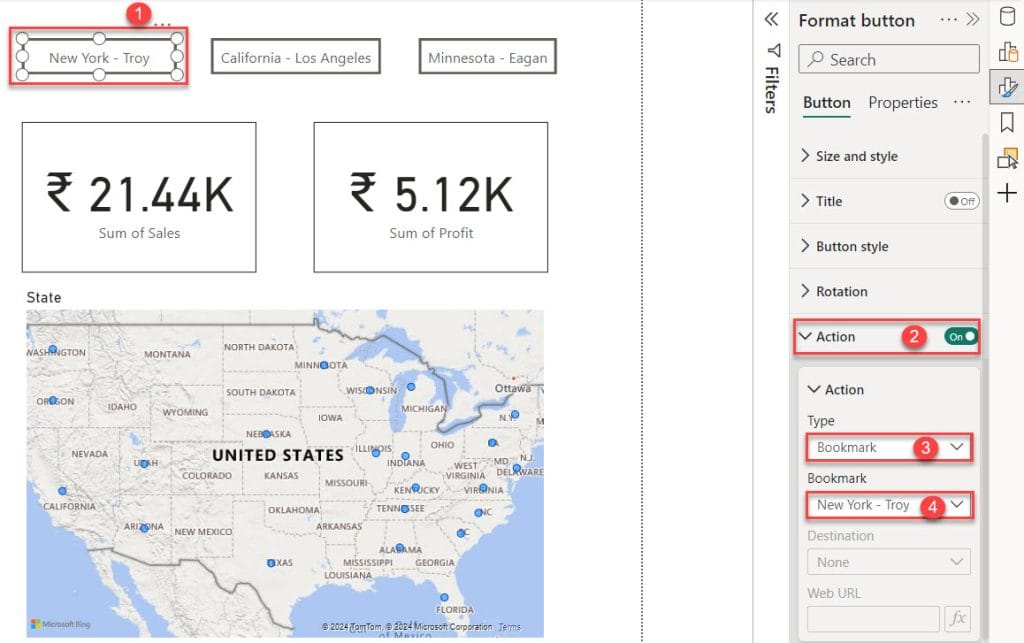
11. Then, choose New York – Troy button. Then, click on the “Format” button. After that, go to “Action” and select “Type” as a Bookmark. Select Bookmark as “New York – Troy.”
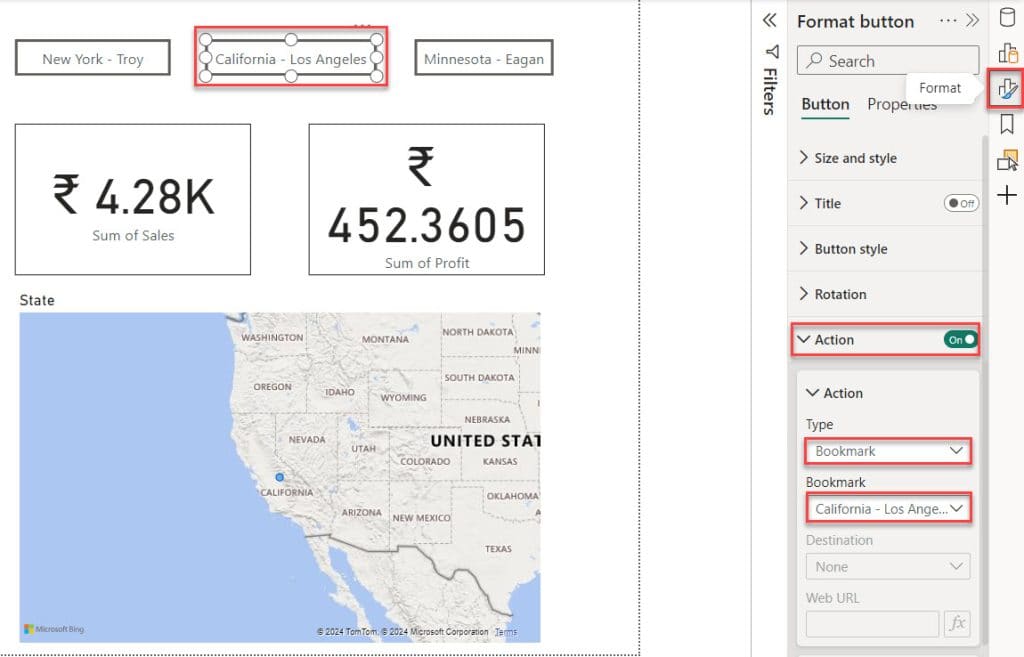
12. Then, choose California – Los Angeles button. Then, click on the “Format” button. After that, go to “Action” and select “Type” as a Bookmark. Select Bookmark as “California – Los Angeles.”
13. Then, choose Minnesota – Eagan button. Then, click on the “Format” button. After that, go to “Action” and select “Type” as a Bookmark. Select Bookmark as “Minnesota – Eagan.”
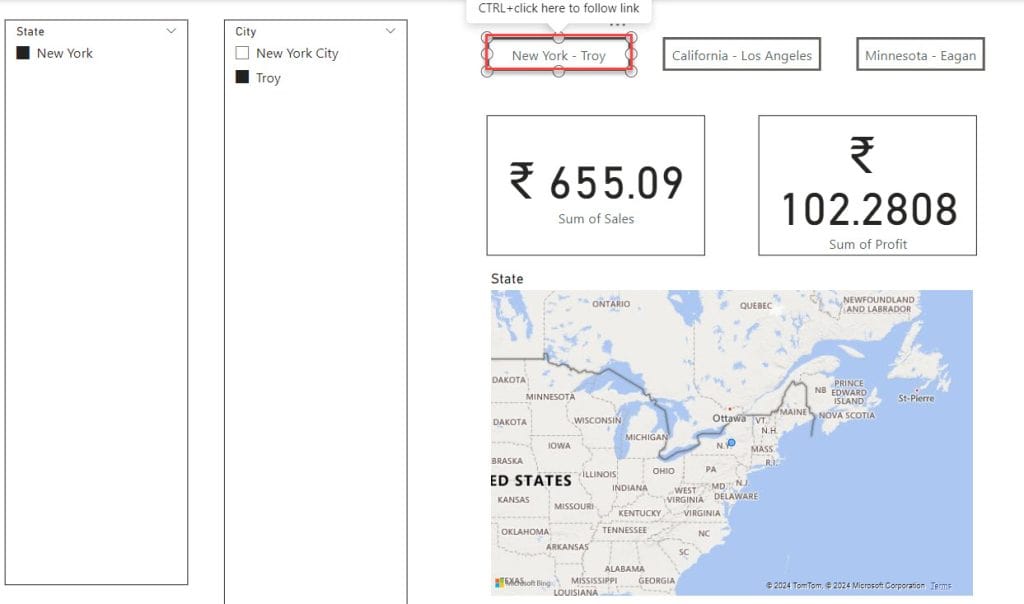
14. Holding the Ctrl key and clicking on the “New York – Troy” button then, you can see it will filter in the report.
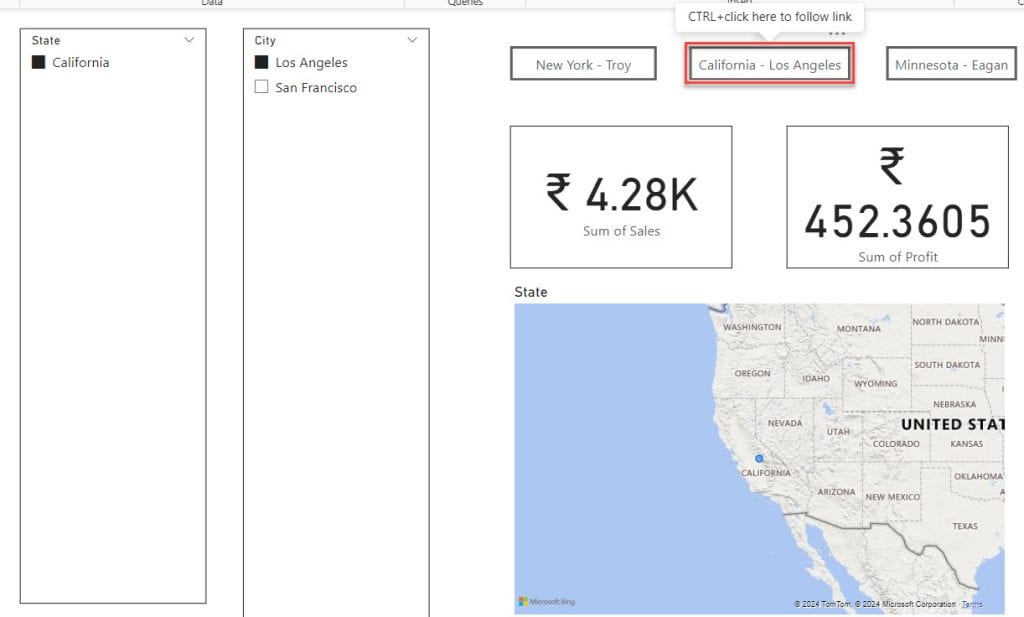
15. Holding the Ctrl key and clicking on the “California – Los Angeles” button then, you can see it will filter in the report.
16. Holding the Ctrl key and clicking on the “Minnesota – Eagan” button then, you can see it will filter in the report.
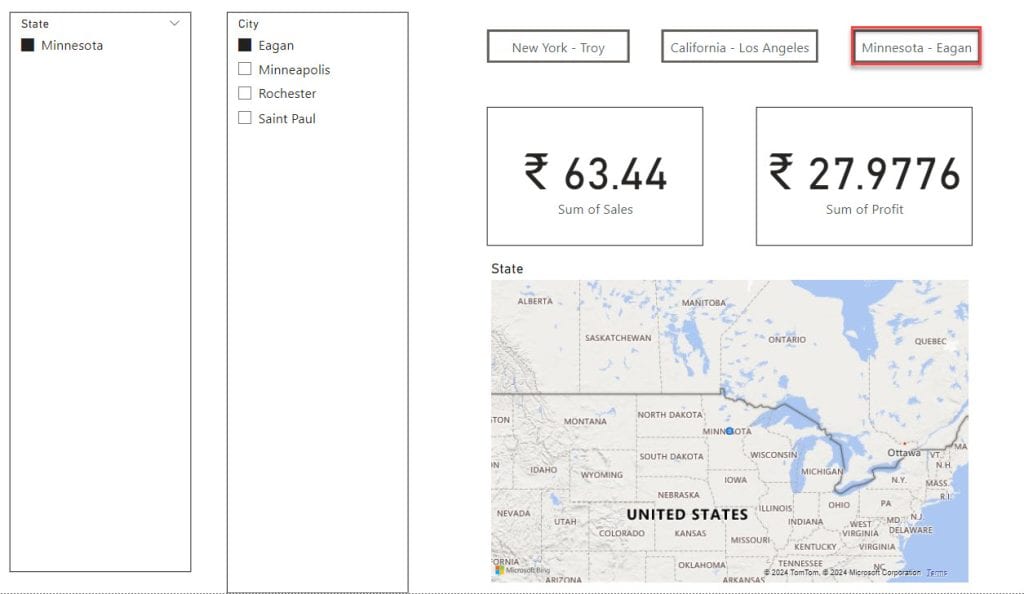
This way, you can use the Power BI bookmark with a slicer.
Power BI Bookmarks Selected Visuals
In this example, we see Power BI bookmarks selected visually.
When you use the “selected visuals” option in Power BI bookmarks, it only saves the bookmarks for the visuals you’ve chosen when you create the bookmark. You can pick multiple visuals by holding down the Ctrl key and clicking on each visual.
In this example, we’ve made two-column charts. With bookmarks’ “selected visual” feature, we can switch between the two charts.
Here, I have already created two Power BI column charts.

Add 2 blank buttons and give the name as Sales and Profit.

Follow the below steps:
1. Then, open the Selection pane and Hide the Column chart(Sum of Profit by Segment).

2. Next, open the Bookmarks pane by clicking on the “+Add” button and create bookmarks. Then, double-click to rename it “Sales.” After that, in the selection pane, select the four visuals. Click on the three dots (…) in the “Sales” bookmark and choose “Selected Visuals.”

3. Click on the three dots (…) in the “Sales” bookmark and choose Update.

3. Select a Sales button. Then, click on the “Format” button. After that, go to “Action” and select “Type” as a Bookmark. Select Bookmark as “Sales.”
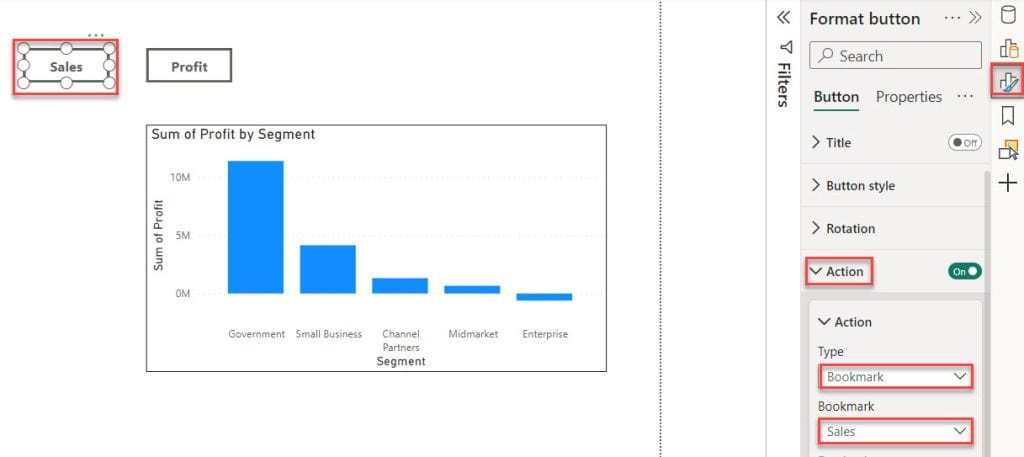
4. Then, open the Selection pane and Hide the Column chart(Sum of Sales by Segment).
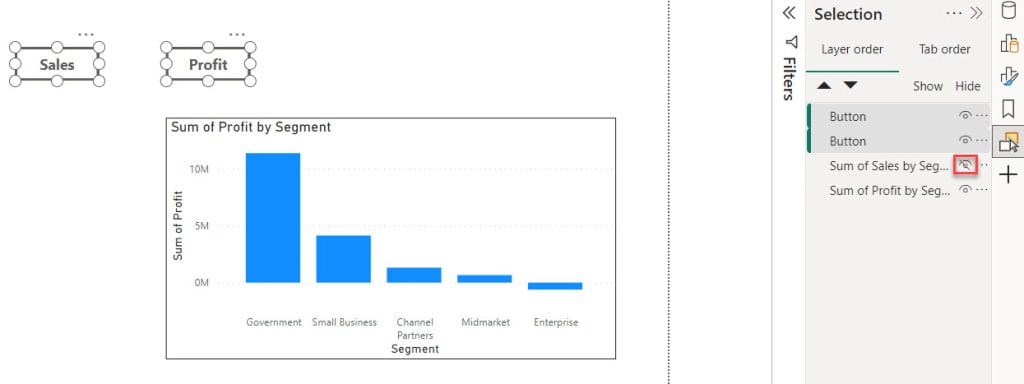
5. Next, open the Bookmarks pane by clicking on the “+Add” button and create bookmarks. Then, double-click to rename it “Profit.” After that, in the selection pane, select the four visuals. Click on the three dots (…) in the “Profit” bookmark and choose “Selected Visuals.”
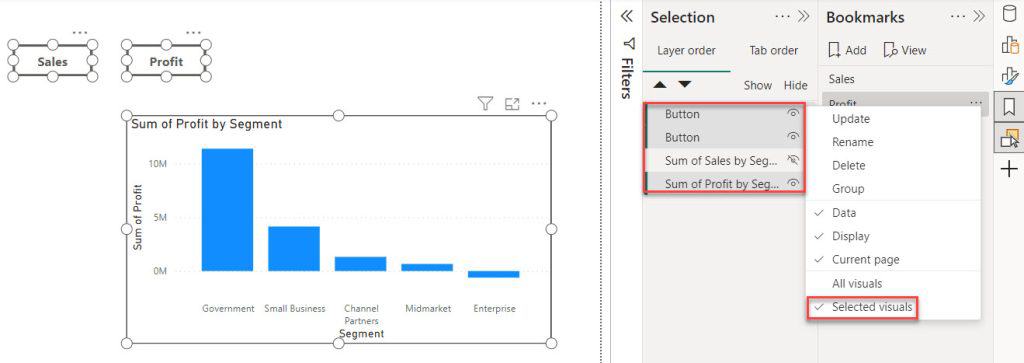
6. Click on the three dots (…) in the “Profit” bookmark and choose Update.
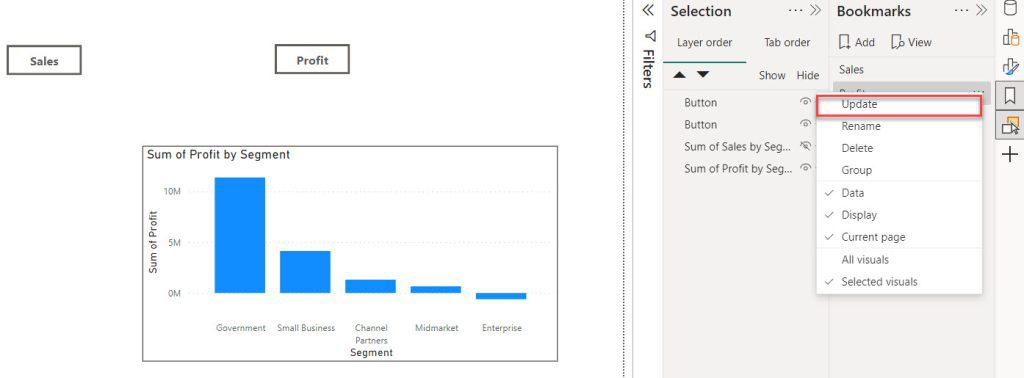
7. Select a Profit button. Then, click on the “Format” button. After that, go to “Action” and select “Type” as a Bookmark. Select Bookmark as “Profit.”
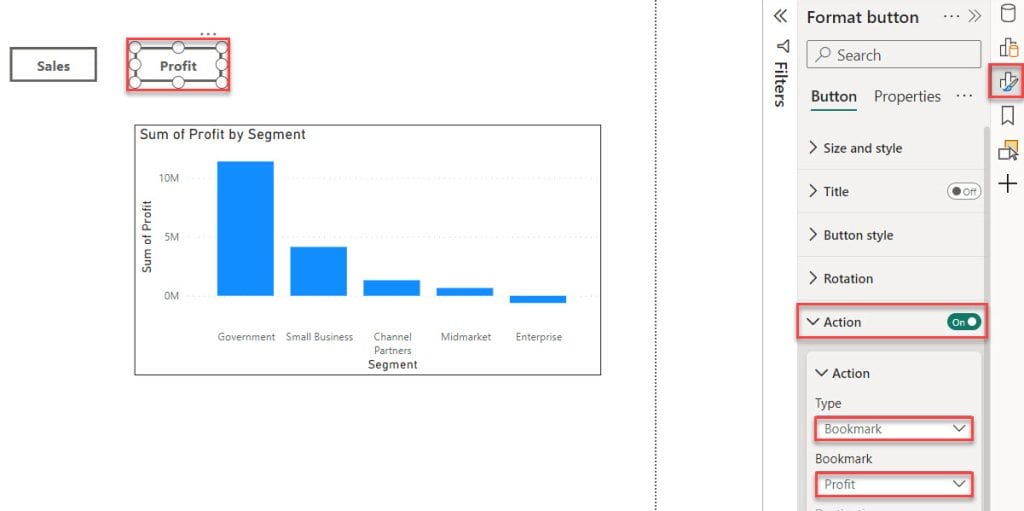
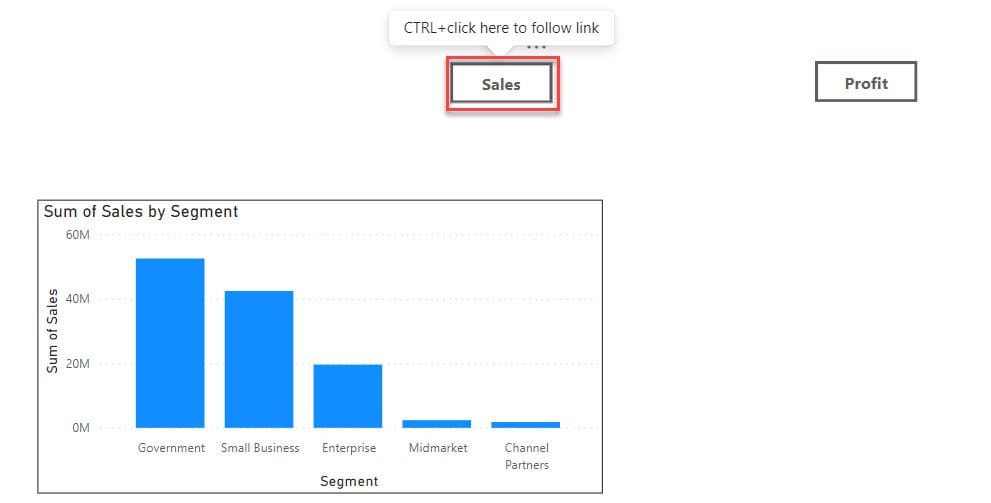
8. Hold the Ctrl key and click on the “Sales” button. Then you can see Sales by Segment in the column chart.
9. Hold the Ctrl key and click on the “Profit” button. Then, you can see Profit by Segment in the column chart.
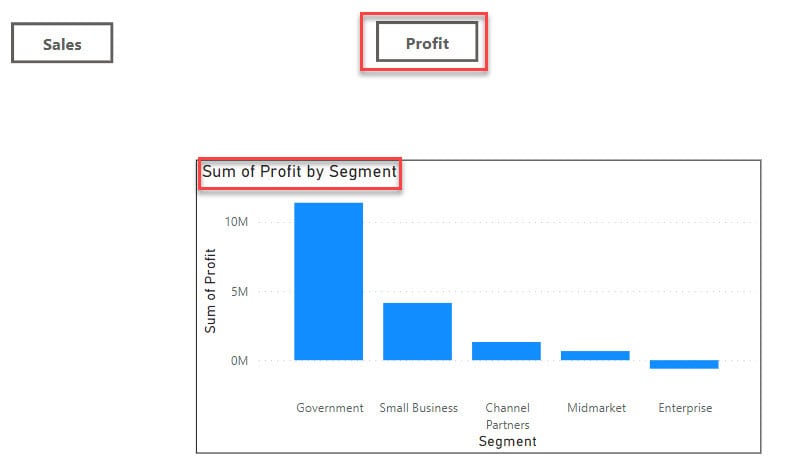
This is an example of Power BI Bookmark selected visual.
Power BI Bookmark Navigator
Here, we will see an example of a Power BI Bookmark navigator.
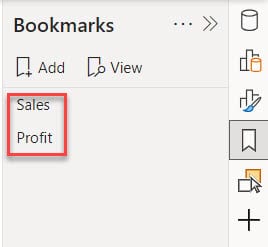
To create a bookmark navigator, we need first create a bookmark in the Bookmarks Pane.
In the previous example (Power BI Bookmarks Selected Visuals), we created two bookmarks: Sales and Profit. I hope you created it.
Now follow the below steps:
1. Click Insert tab -> expand Buttons -> expand Navigator -> click Bookmark navigator.
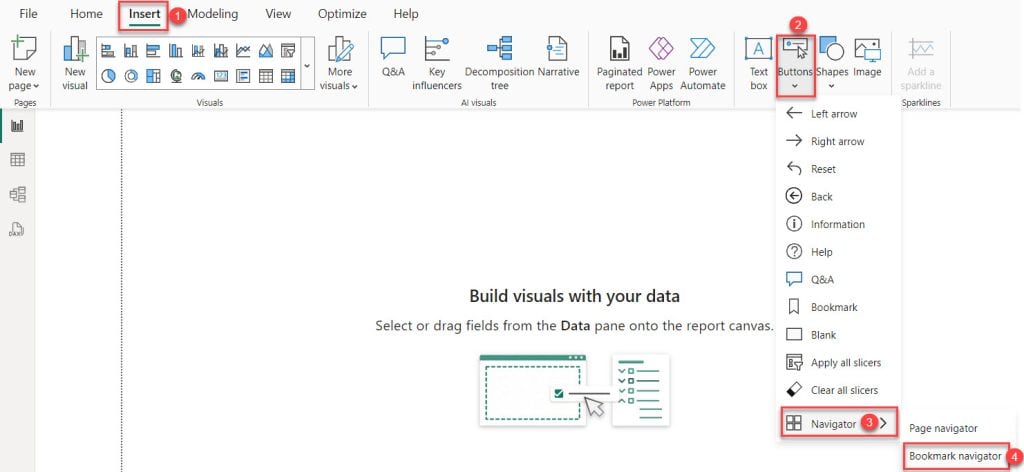
2. Then, you can see two buttons (Sales and Profit) automatically created in the report view.

This way, you can create a Power BI Bookmark Navigator.
Power BI Bookmark Keeps the Filter
Here, we will see an example of the Power BI Bookmark keeping the filter.
Here’s how we can set it up: When a user clicks the “First quarter” button, the column chart should display the sales data for January, February, and March. Similarly, clicking on buttons for other quarters should show sales data for their respective months in the visual.
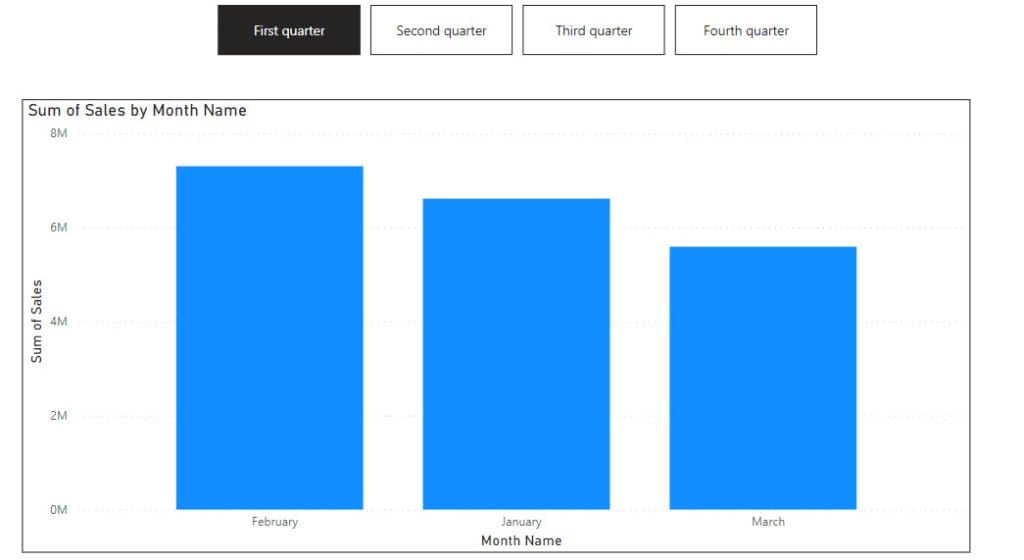
For this example, I have already created column charts that display Sales by Month Name.
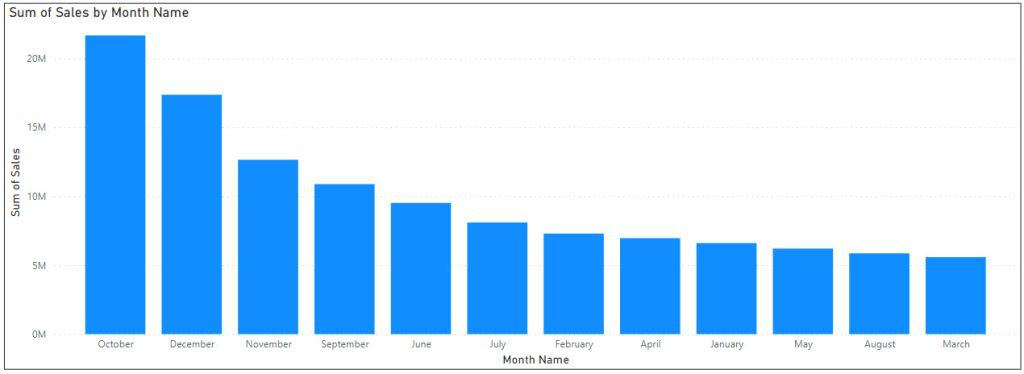
Now follow the below steps:
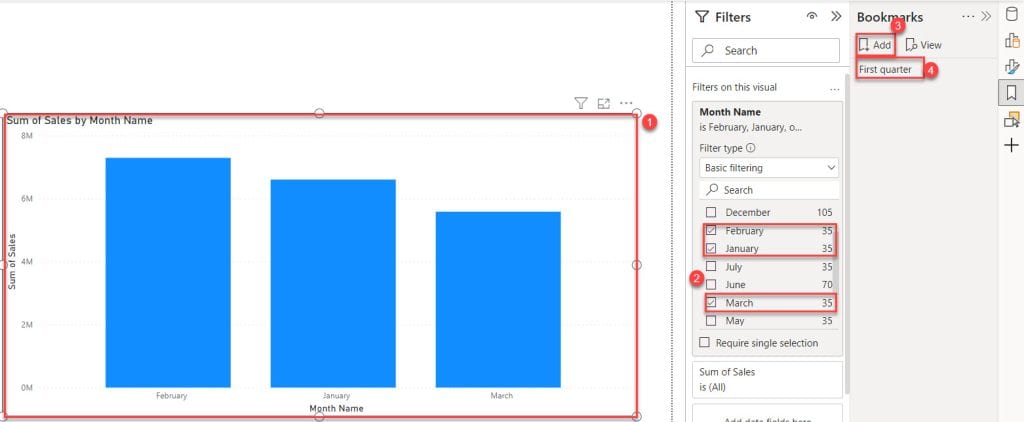
1. First, select the visual (Column Chart). Then, under the Filters pane, apply a filter for January, February, and March. This will make the column chart show only data for these three months. After that, in the Bookmarks pane, add a bookmark and rename it “First Quarter.”
2. Next, select the visual (Column Chart). Then, under the Filters pane, apply a filter for April, May, and June. This will make the column chart show only data for these three months. After that, in the Bookmarks pane, add a bookmark and rename it “Second quarter.”
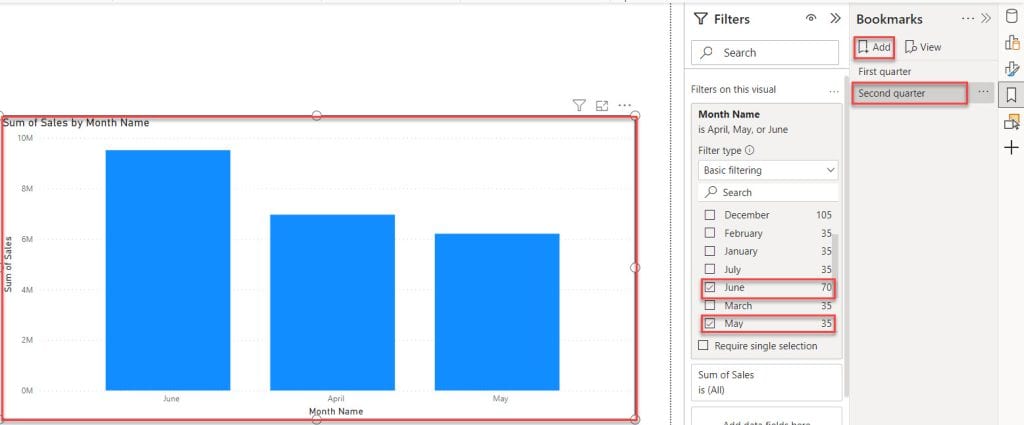
3. In the same way, apply a filter for July, August, and September for the Third quarter bookmark and for October, November, and December for the Fourth quarter bookmark.

4. Click Insert tab -> expand Buttons -> expand Navigator -> click Bookmark navigator.
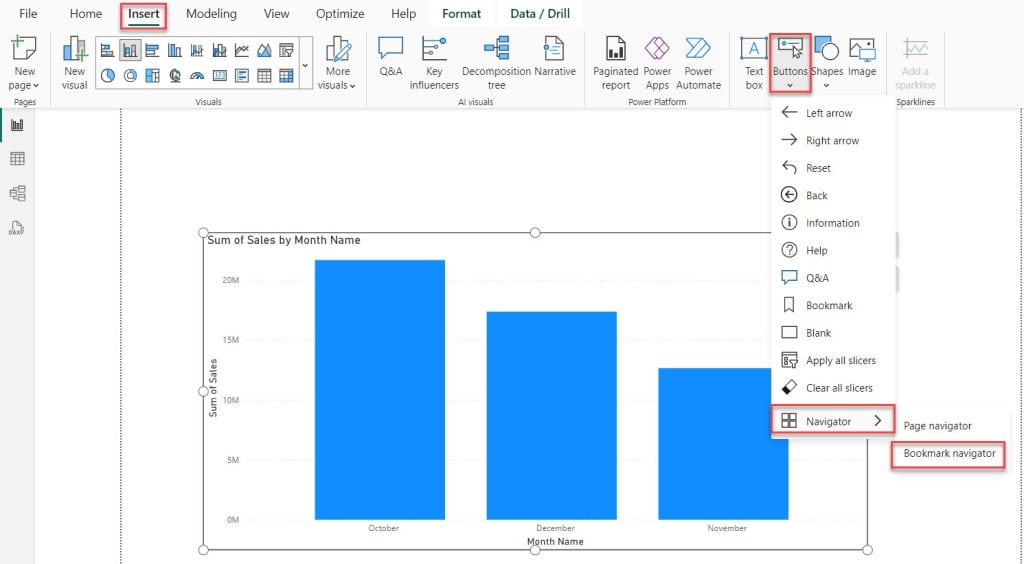
5. Then, bookmark buttons (First quarter, Second quarter, Third quarter, and Fourth quarter) are automatically created in the report view.
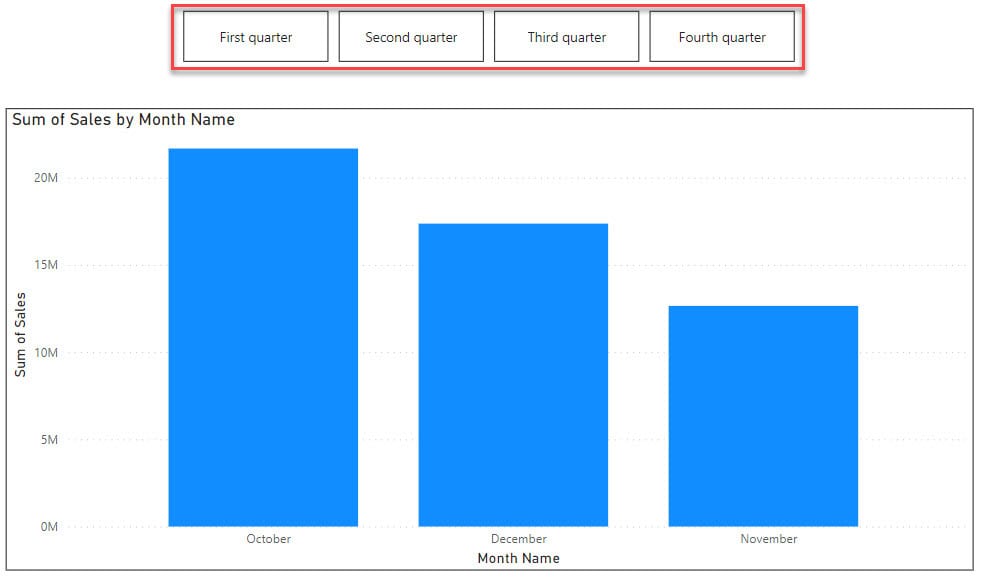
6. When a user clicks the “First quarter” button by Ctrl+ click, the column chart displays the sales data for January, February, and March.

7. Holding the Ctrl key and clicking on the “Second quarter” button then, you can see it will filter in the report.
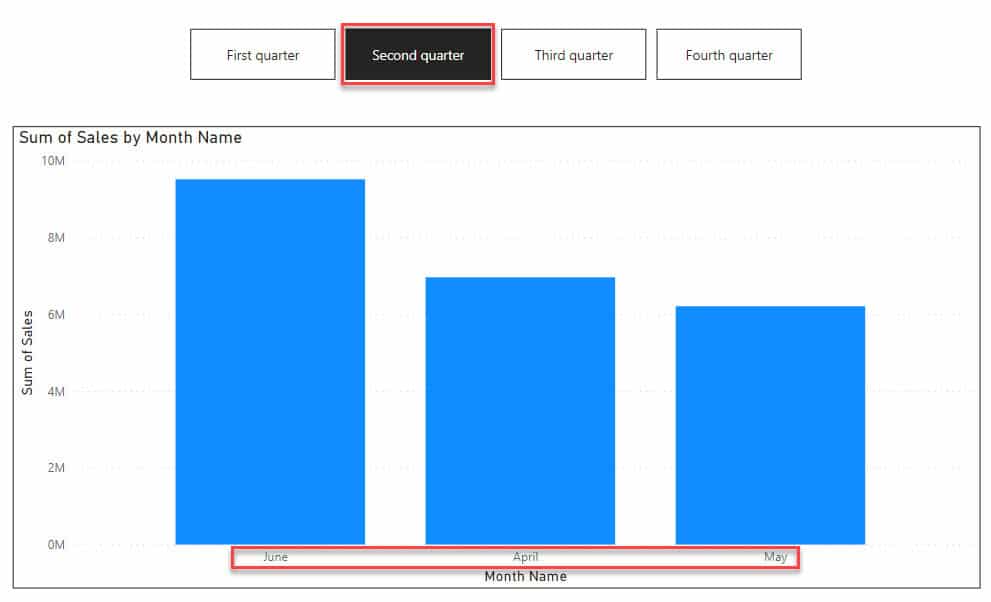
You can check for Third quarter and Fourth quarter.
Some more Power BI articles you may also like:
- Stacked Bar Chart in Power BI
- Power BI Change Color Based On Value
- Power BI Count Group by
- Power BI If Date is Greater than Specific Date
- Switch in Power BI
- Power BI Divide Two Columns
In this tutorial, we’ve explored the concept of bookmarks in Power BI and how they’re used with the Bookmark panel. We’ve covered:
- Understanding what a bookmark is in Power BI
- Creating bookmarks in Power BI
- Bookmarking the current page in Power BI
- Power BI bookmark navigator
- Example of Power BI bookmark keep filters
- Implementing Power BI buttons without using the Ctrl key
- Using bookmarks to interact with slicers in Power BI
I am Bijay a Microsoft MVP (10 times – My MVP Profile) in SharePoint and have more than 17 years of expertise in SharePoint Online Office 365, SharePoint subscription edition, and SharePoint 2019/2016/2013. Currently working in my own venture TSInfo Technologies a SharePoint development, consulting, and training company. I also run the popular SharePoint website EnjoySharePoint.com