Did you know you can divide in Power BI using several different techniques? The fastest is to use the DIVIDE DAX function.
In this Power BI Tutorial, we will learn how to divide two columns using Power BI DAX and Power BI measure divide two columns.
Additionally, we will discuss the topics below:
- DAX divide two columns
- Power BI divide two columns
- Power BI measure divide two columns
- Power BI divide two columns from different tables
- Power query divide two columns
- Power BI divide two columns with filter
- Power BI measure divide one column by another
- Power Query Divide Column by 100
DAX Divide Two Columns
In Power BI, if you want to divide two columns in DAX (Data Analysis Expressions), it means you are creating a new calculation that takes the values in one column and divides them by the values in another column.
Syntax:
DIVIDE(<numerator>, <denominator> [,<alternateresult>])Where:
- DIVIDE = This is a function in DAX (Data Analysis Expressions) used for division operations.
- <numerator> = This is the number you want to divide.
- <denominator> = This is the number you’re dividing by.
- [<alternateresult>] = This is an optional parameter. If the denominator is zero, it returns this alternate result instead of an error message.
Example:
Let’s say you have a table with two columns: “Total Sales” and “Number of Products Sold.” To find the average sales per product, you would divide the total sales by the number of products sold for each row in the table.
To find average sales, we can use the below expression.
Average Sales per Product = DIVIDE('financials'[Total Sales],'financials'[Number of Products Sold])Where:
- Average Sales per Product = This is the result we want, which is the average amount of sales for each product.
- DIVIDE = This is the function we’re using to perform division.
- ‘financials'[Total Sales] = This is the total sales amount from our financial data.
- ‘financials'[Number of Products Sold] = This is the count of products sold from our financial data.
Power BI Divide Two Columns
In this example, we see how we can divide two columns in Power BI.
Imagine you want to calculate the profit margin for each product you sell. To do this, you need to divide the profit made from selling each product by the cost of producing or purchasing that product.
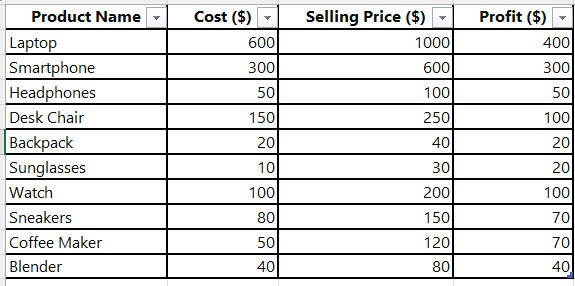
Here, we have an Excel file with Product Name, Cost, Selling Price, and Profit columns.
Now follow the below steps:
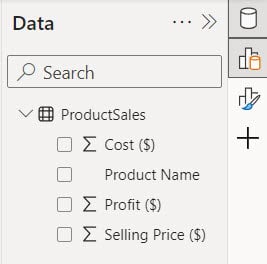
1. Open Power BI Desktop and load data using the Get data option. Then, you can see data in the Data pane.
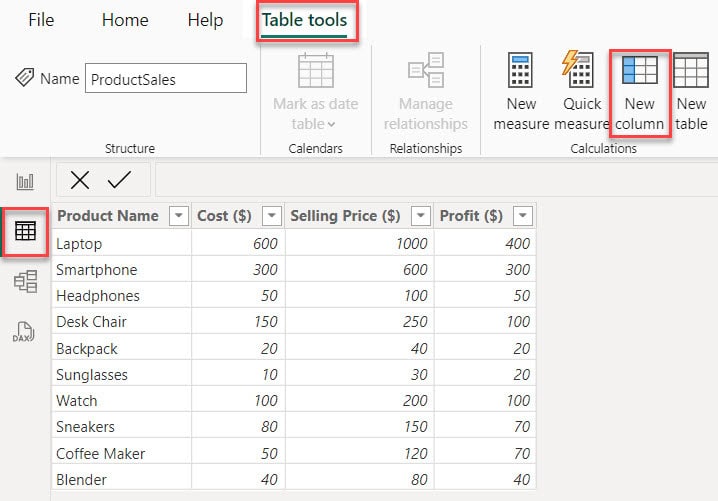
2. Go to the Table view and click the New column under the Table tools.
3. In the formula bar, put the below expression. Then click Commit.
Profit Margin = DIVIDE([Profit ($)], [Cost ($)]) * 100Where:
- Profit Margin = This is the result we’re calculating, which represents the percentage of profit earned from sales.
- DIVIDE = This function divides one value from another.
- [Profit ($)] = This is the total profit earned from sales.
- [Cost ($)] = This is the total cost incurred for those sales.

4. After that, one column is created in the Table view.
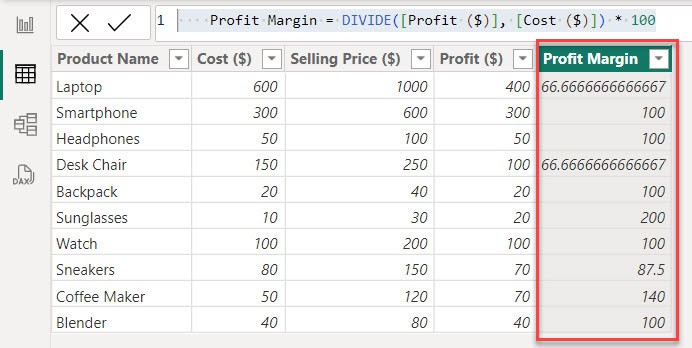
This way, you can divide the two columns using the Power BI Divide function.
Power BI Measure Divide Two Columns
Imagine you are managing a small restaurant and want to track the efficiency of your kitchen staff. One way to measure this is by calculating the average time it takes them to prepare each dish compared to the target time for each dish.
Here, we have a SharePoint list (Kitchen Efficiency) that contains below columns with various data types:
| Columns | Data Types |
|---|---|
| Dish Name | Single line of text |
| Actual Time (minutes) | Number |
| Target Time (minutes) | Number |
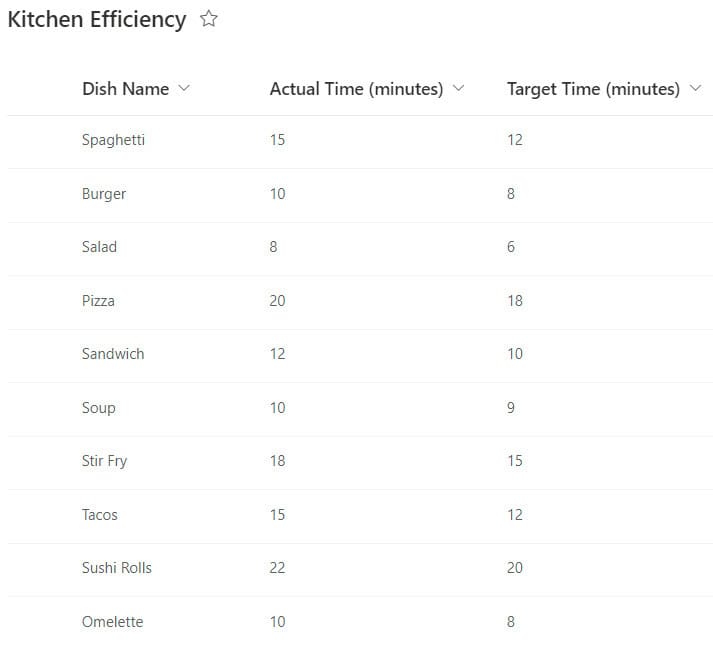
Now follow the below steps:
1. Open Power BI Desktop and load data using the Get data option. Then, you can see data in the Data pane.
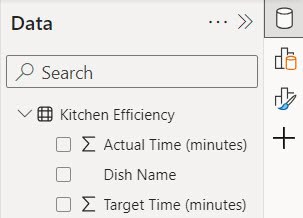
2. under the Home tab, click “New measure.”

3. In the formula bar, put the below expression. Then click Commit.
Efficiency Ratio = AVERAGE('Kitchen Efficiency'[Actual Time (minutes)]) / AVERAGE('Kitchen Efficiency'[Target Time (minutes)])Where:
- Efficiency Ratio = This is the result we’re calculating, indicating how well the kitchen is performing compared to its target time.
- AVERAGE = This function calculates the average of a set of values.
- ‘Kitchen Efficiency'[Actual Time (minutes)] = This is the actual time taken for kitchen tasks.
- ‘Kitchen Efficiency'[Target Time (minutes)] = This is the target time set for those tasks.

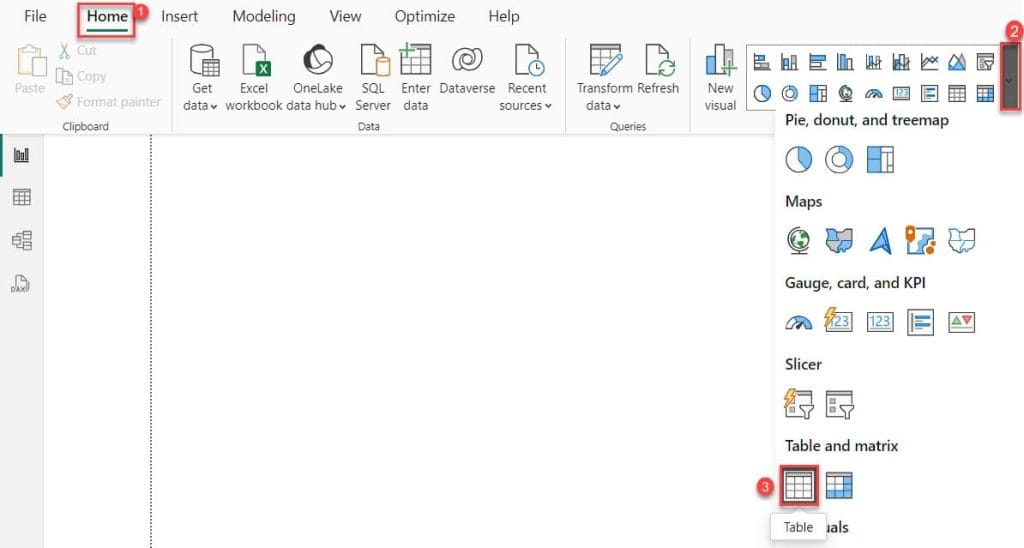
4. After that, Under the Home tab, expand Visual gallery(black box) -> Click the Table visual.
5. Then, using the +Add data option, add the Dish Name, Actual Time (minutes), Target Time (minutes), and Efficiency Ratio into the Columns field.
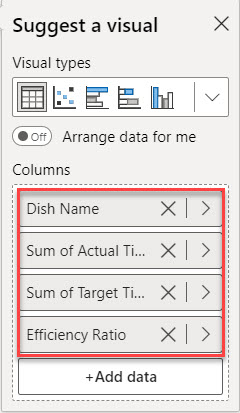
6. you can see the table visual in the report view.
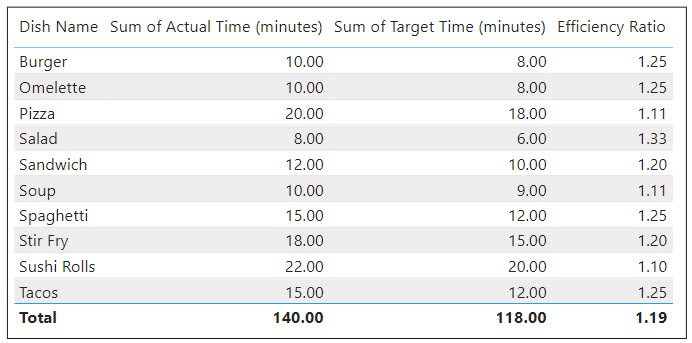
This way, you can create Power BI measure divide two columns.
Power BI Divide Two Columns From Different Tables
Imagine you have a small e-commerce business that sells products online. You want to analyze the effectiveness of your marketing campaigns by comparing the number of website visitors to the number of product purchases.
For this, we have two tables:
- Visitors Table = This table contains data on the number of visitors to your website over time.
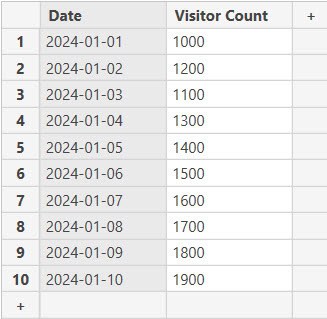
- Purchases Table = This table contains data on the number of product purchases made on your website over time.
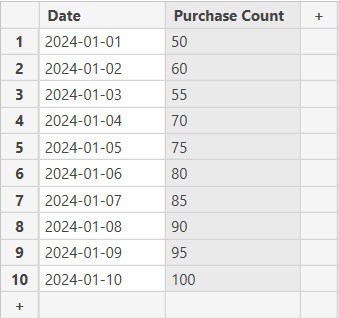
Now Follow the below steps:
1. Open Power BI Desktop and load the above data into Power BI. Then, you can see data in the Data pane.
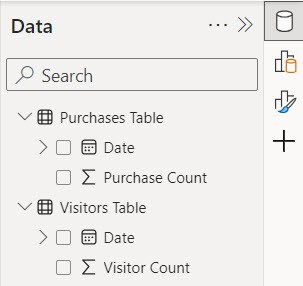
2. Now, we calculate the total number of purchases. To do this, select the Purchases Table. Under the “Table tools” tab, click “New measure.”

3. In the formula bar, Put the below expression. Then click Commit.
Number of Purchases = SUM('Purchases Table'[Purchase Count])Where:
- Number of Purchases = This is what we’re figuring out, the total count of purchases.
- SUM = This function adds up all the values in a specified column.
- ‘Purchases Table'[Purchase Count] = This is the column in the “Purchases Table” that holds the count of each purchase.

4. Now, we calculate the number of visitors. To do this, select the Visitors Table. Under the “Table tools” tab, click “New measure.”

5. In the formula bar, Put the below expression. Then click Commit.
Number of Visitors = SUM('Visitors Table'[Visitor Count])Where:
- Number of Visitors = This is what we’re calculating, the total count of visitors.
- SUM = This function adds up all the values in a specified column.
- ‘Visitors Table'[Visitor Count] = This is the column in the “Visitors Table” that holds the count of each visitor.

6. Now, we calculate the Conversion Rate. To do this, under the Home tab, click “New measure.”

7. In the formula bar, Put the below expression. Then click Commit.
Conversion Rate = DIVIDE([Number of Purchases],[Number of Visitors])Where:
- Conversion Rate = This is what we’re figuring out, the percentage of visitors who make a purchase.
- DIVIDE = This function divides one value by another.
- [Number of Purchases] = This is the total count of purchases.
- [Number of Visitors] = This is the total count of visitors to the store.

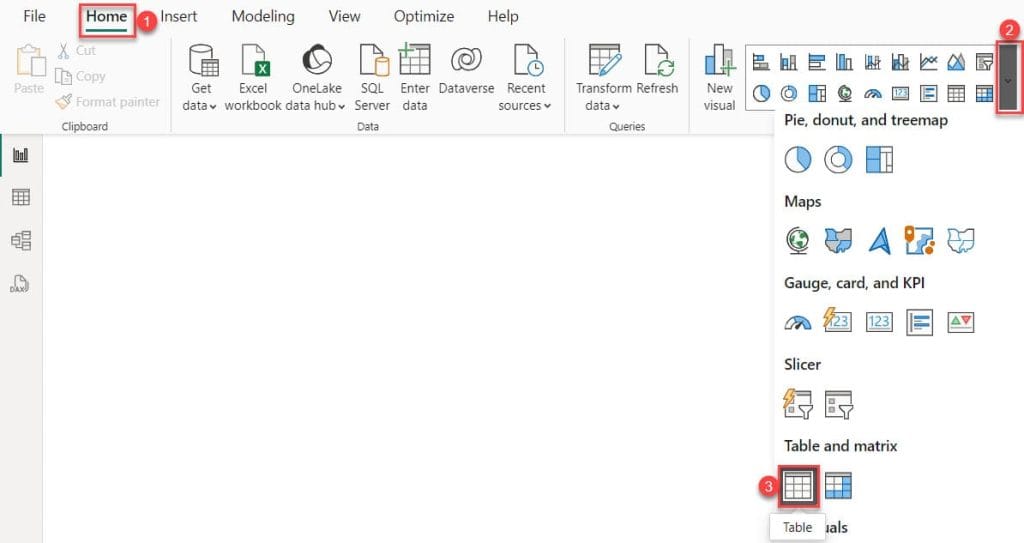
8. After that, Under the Home tab, expand Visual gallery(black box) -> Click the Table visual.
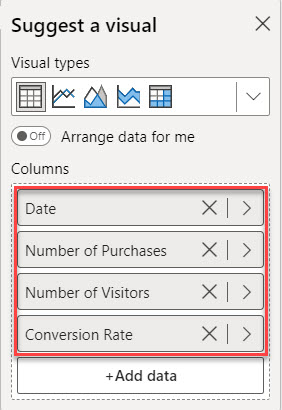
9. Then, using the +Add data option, add Date, Number of Purchases, Number of Visitors, and Conversion Rate into the Columns field.
10. After that you can see in the table visual.
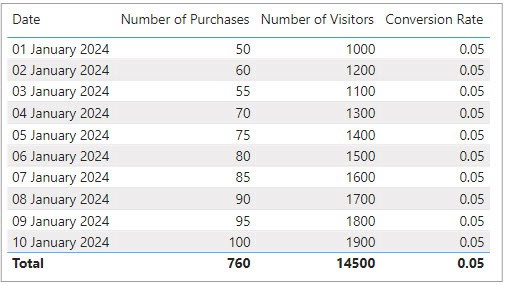
This is how to use Power BI Measure to divide two columns from a different table.
Power Query Divide Two Columns
Here, we see how we can divide two columns in the Power BI Power Query editor.
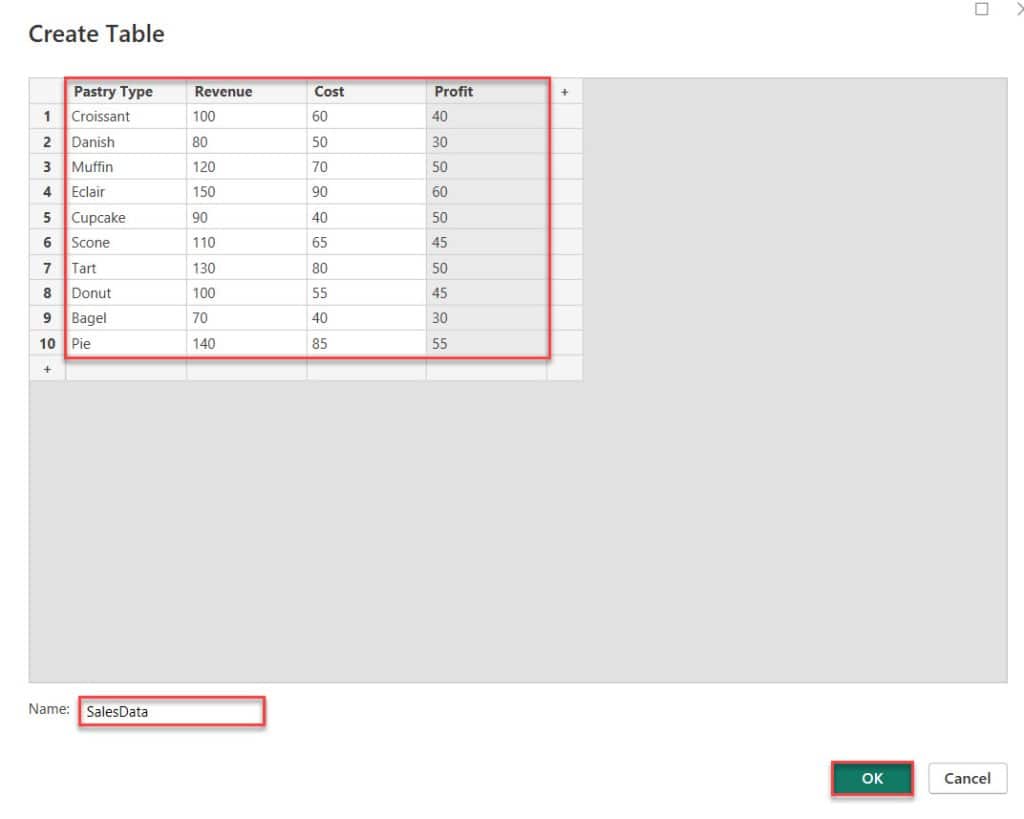
Imagine you want to calculate the profit margin for each type of pastry you sell. To do this, you need to divide the profit by the revenue for each pastry.
Now follow the below steps to do this:
1. Open Power BI Desktop. Then, under the Home tab, click Transform data.

2. In the Power Query Editor, under the Home tab, click Enter Data.

3. Then the below Create Table dialog box will appear. We use the ‘+‘ symbols to add new columns and rows.
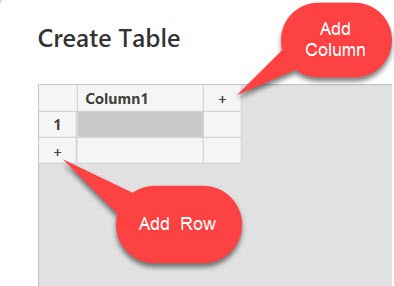
4. We can add data to the table by typing it into the grid. Then, specify the table name under the Name field and Click OK.
5. In the Power Query Editor, click on “Add Column” in the menu and select “Custom Column.”

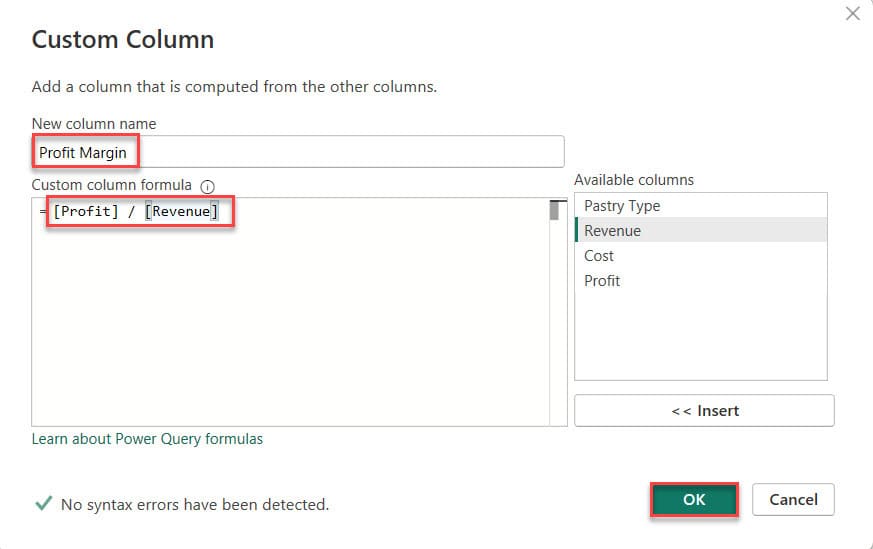
6. In the “Custom Column” dialog box, name your new column “Profit Margin.” Then, use the formula box to divide the “Profit” column by the “Revenue” column. Like the below expression:
=[Profit] / [Revenue]After entering your formula, click “OK” to create the custom column.
7. Then, you can see a new column added in the Power query editor.

This way, you can divide two columns in the Power BI Power Query editor.
Power BI Measure Divide One Column by Another
In this example, see how we can divide one measure by another in Power BI.
Let’s say you want to analyze your sales performance. To do this, you want to calculate a new measure called “Average Revenue per Customer.
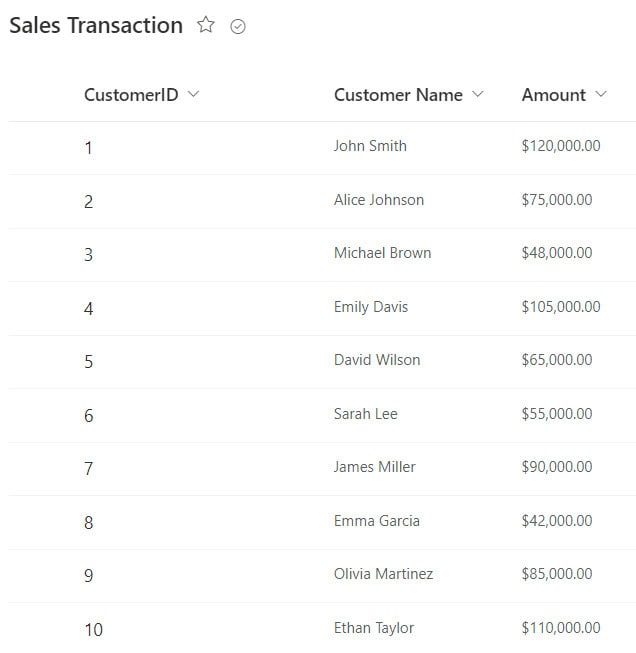
Here, we have a SharePoint list (Sales Transaction) that contains below columns with various data types:
| Columns | Data Types |
|---|---|
| CustomerID | Single line of text(Title) |
| Customer Name | Single line of text |
| Amount | Currency |
Now follow the below steps:
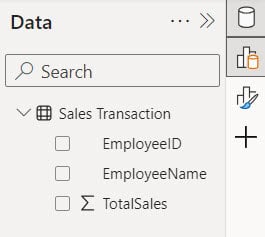
1. Open Power BI Desktop and load the above data into Power BI. Then, you can see data in the Data pane.
2. Under the Home tab, click “New measure.”

3. In the formula bar, Put the below expression. Then click Commit.
Total Sales Revenue = SUM('Sales Transaction'[TotalSales])Where:
- Total Sales Revenue = This is the result we want to achieve, which is the sum of all sales revenue.
- SUM = This is a function in DAX that adds up all the values specified.
- (‘Sales Transaction'[TotalSales]) = This specifies the column of data we want to sum up, which is the TotalSales column in the Sales Transaction table.

4. Under the Home tab, click “New measure.”

5. In the formula bar, Put the below expression. Then click Commit.
Number of Customers = DISTINCTCOUNT('Sales Transaction'[EmployeeID])Where:
- Number of Customers = This is the result we want to achieve, which is the count of unique customers.
- DISTINCTCOUNT = This is a function in DAX that counts the number of distinct (unique) values in a column.
- (‘Sales Transaction'[EmployeeID]) = This specifies the column of data we want to count unique values for, which is the EmployeeID column in the Sales Transaction table.

6. Now we calculate the Average Revenue per Customer. To do this again, click “New measure”. Then in the formula bar, Put the below expression. Then click Commit.
Average Revenue per Customer = [Total Sales Revenue] / [Number of Customers]Where:
- Average Revenue per Customer = This is the outcome we want, which tells us how much revenue each customer contributes on average.
- [Total Sales Revenue] = This refers to the total revenue earned from all sales transactions.
- [Number of Customers] = This refers to the count of unique customers.

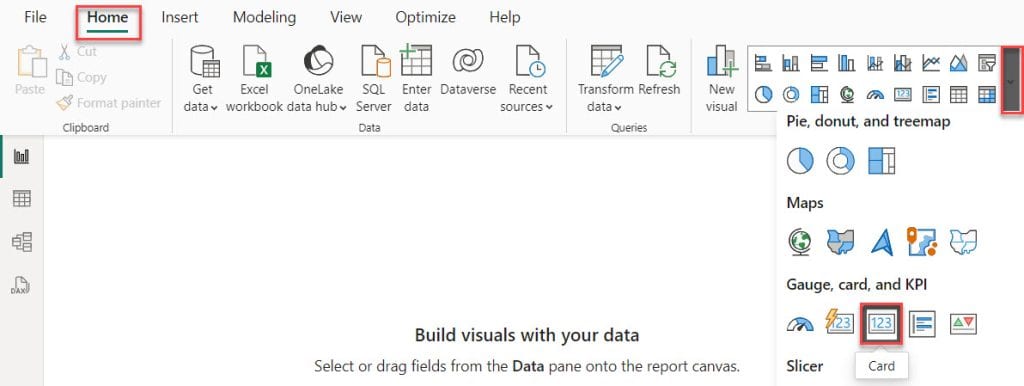
7. After that, Under the Home tab, expand Visual gallery(black box) -> Click the Card visual.
8. Then, using the +Add data option, add Average Revenue per Customer into Fields. After that, you can see the average revenue per customer in the card visual.
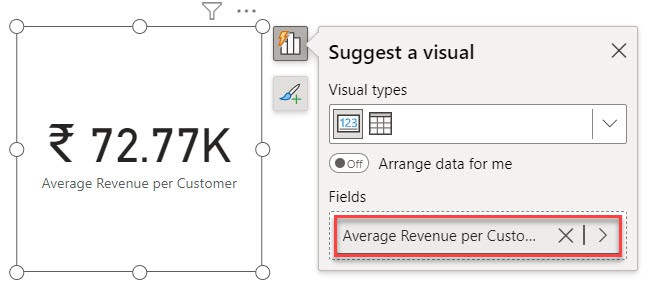
It helps you understand your customer’s purchasing behavior and can inform your marketing and sales strategies.
Power BI Divide Two Columns with Filter
Imagine you’re managing a manufacturing plant that produces different products, and you want to track the production efficiency of each production line.
You have data on the total number of units produced and the total number of defective units for each production line.
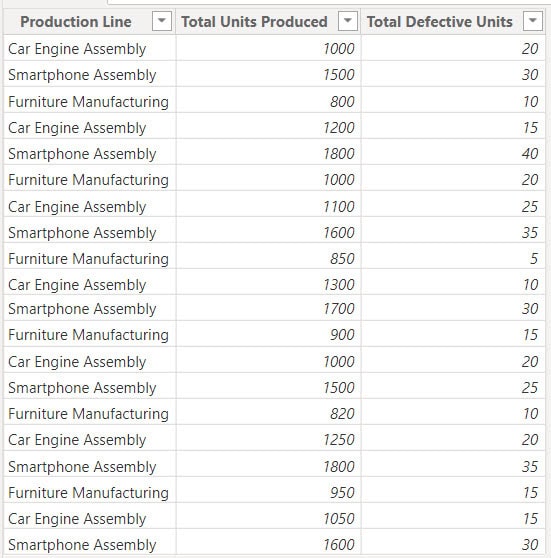
You want to create a measure to calculate the defect rate for each production line. To do this, follow the below steps:
1. Open Power BI Desktop and load the above data into Power BI. Then, you can see data in the Data pane.
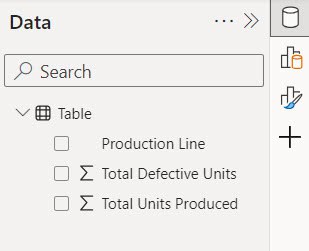
2. Under the Home tab, click “New measure.”

3. In the formula bar, Put the below expression. Then click Commit.
Defect Rate = DIVIDE(
                 SUMX(
                     FILTER('Table', 'Table'[Production Line] = SELECTEDVALUE('Table'[Production Line])),
                     'Table'[Total Defective Units]
                 ),
                 SUMX(
                     FILTER('Table', 'Table'[Production Line] = SELECTEDVALUE('Table'[Production Line])),
                     'Table'[Total Units Produced]
                 )
             )
Where:
- DEFECT RATE = It calculates the percentage of defective units.
- SUMX = It adds up a specified column for each row in a table.
- FILTER = It selects only the rows in a table that meet certain criteria.
- Table = Name of the table.
- ‘Table'[Production Line] = SELECTEDVALUE(‘Table'[Production Line]) = This filters the table to include only rows where the production line’s value matches the currently selected value.
- ‘Table'[Total Defective Units] = The column containing the number of defective units for each row.
- ‘Table'[Total Units Produced] = The column containing the total number of units produced for each row.
- DIVIDE = divides the sum of defective units by the sum of total units produced to get the defect rate percentage.

4. After that, Under the Home tab, expand Visual gallery(black box) -> Click the Card visual.
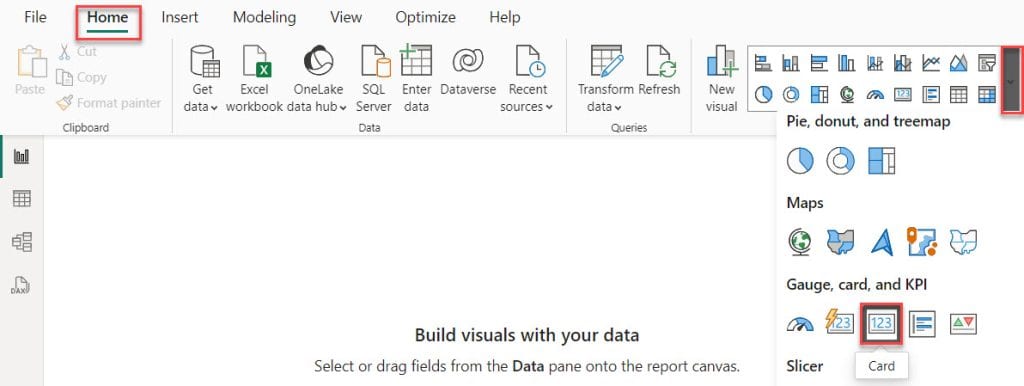
5. Then, using the +Add data option, add DEFECT RATE into Fields. After that, you can see the Defect Rate in the card visual.
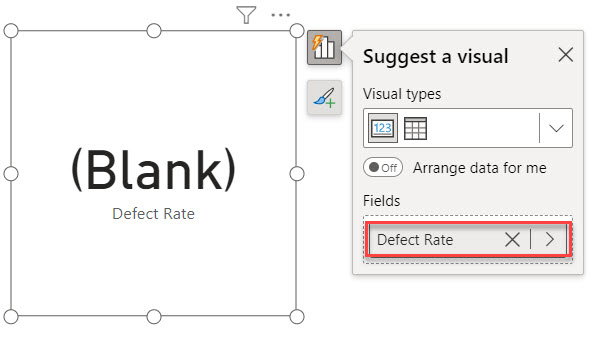
6. You might be wondering why it’s blank. That’s because you need to choose a production line. I’ve added a slicer for production lines to make it easier.
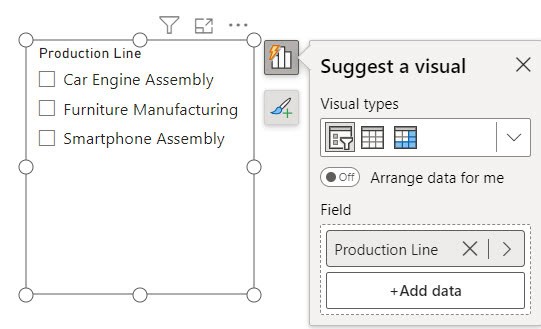
7. When you select any production line, you can see the Defect Rate in the Card visual.

This is how to divide two columns and filter the context using the filter function measure in Power BI.
Power Query Divide Column by 100
Suppose your company receives data from various suppliers about the prices of products. However, the prices are recorded in cents instead of dollars, which makes it inconvenient for analysis and reporting.
To convert cents to dollars, you need to divide the price column by 100.
Here, we have an Excel file that contains the Product ID, Product Name, and Price(in cents) columns.
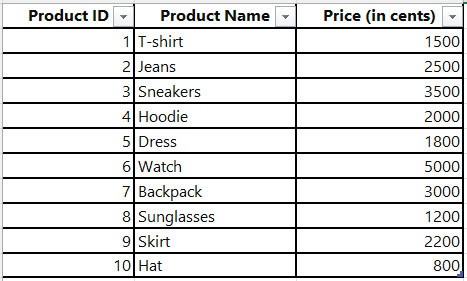
Now follow the below steps:
1. Open Power BI Desktop. Then, under the Home tab, click Transform data.

2. In the Power Query Editor, expand New Source under the Home tab, then click Excel workbook.
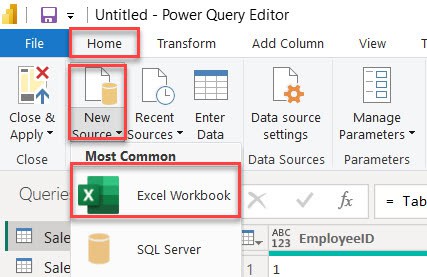
3. Then, choose the Excel file you want to load. Then, you’ll see the table you need loaded in the Power Query Editor.
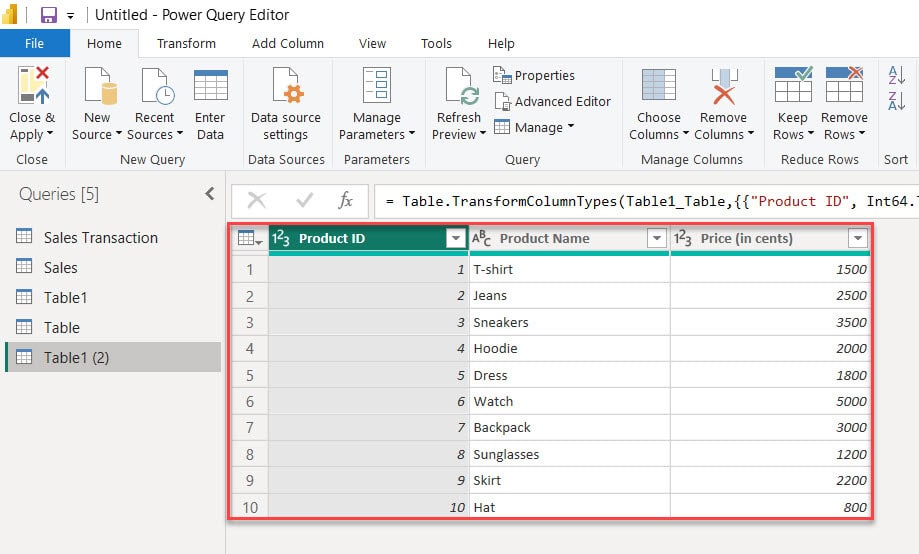
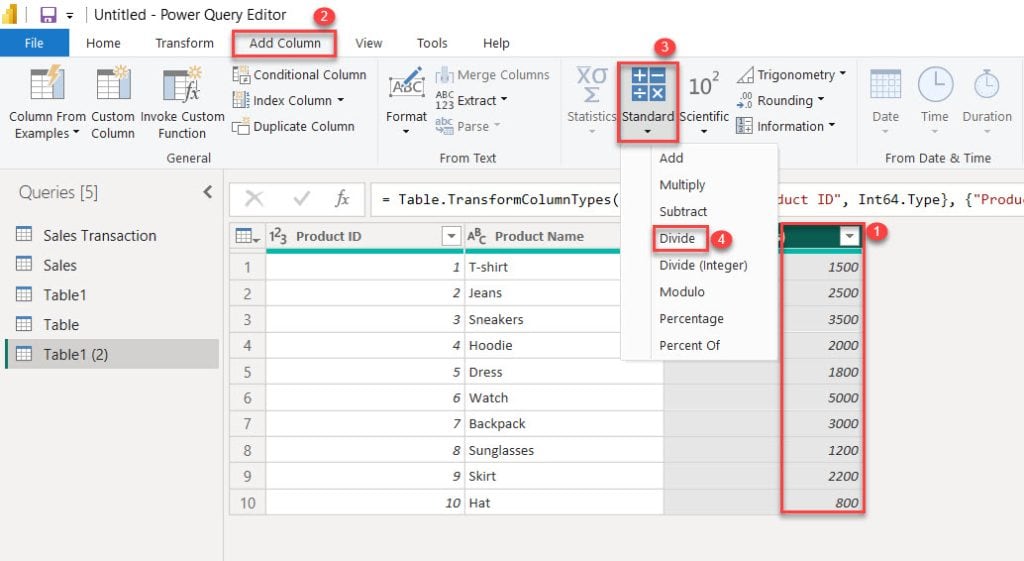
4. First, select the column you want to divide. Then, under the “Add Column” tab, expand “Standard” and click on “Divide.”
5. In the “Divide” dialog box, put 100 in the “Value” field, then click “OK.”

6. After dividing the column values by 100, you can see one column created.
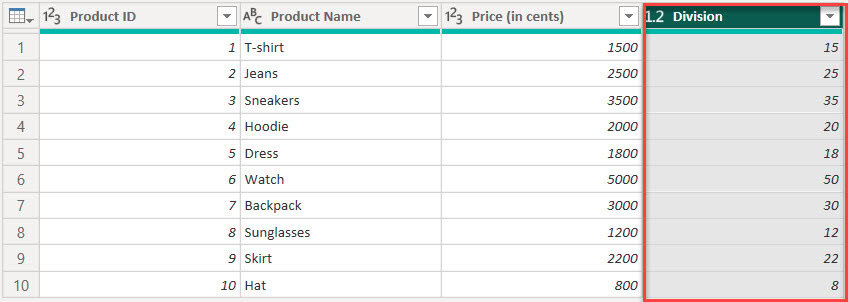
By following these steps, you’ve successfully divided the price column by 100 using Power Query, making the data more suitable for analysis.
This way can divide any number in the Power BI.
Some more Power BI articles you may also like:
- Bookmarks in Power BI
- Power BI Clustered Bar Chart
- Power BI Sum Multiple Columns
- Power BI Group by
- Power BI If Date is Greater than Specific Date
Conclusion
In this guide, we examined how to divide two columns using Power BI. We learned about dividing two columns in Power BI, creating a new measure to divide two columns, dividing columns from different tables in Power BI, and how we can divide two columns in the Power BI Power Query editor.
Additionally, we covered Power BI dividing two columns with a filter, Power BI measure dividing one column by another, and Power Query dividing column by 100.
I am Bijay a Microsoft MVP (10 times – My MVP Profile) in SharePoint and have more than 17 years of expertise in SharePoint Online Office 365, SharePoint subscription edition, and SharePoint 2019/2016/2013. Currently working in my own venture TSInfo Technologies a SharePoint development, consulting, and training company. I also run the popular SharePoint website EnjoySharePoint.com