In this Power BI Tutorial, we will learn about the Power BI SUM multiple columns and how to sum 2 columns in Power BI.
Additionally, we will discuss the topics below:
- Power BI sum multiple columns
- Power BI sum group by multiple columns
- Power BI sum two columns from different tables
- Power BI measure sum multiple columns
- Power BI add two columns together
- Power BI sum columns by row
- Power BI dax sum multiple columns with filter
- Power query sum multiple columns
Power BI Sum Multiple Columns
Sum multiple columns Power BI functionality allows you to add up the values in several columns of your dataset to create a new total column.
To calculate the sum of multiple columns, we can use the SUMX function in Power BI. The syntax for the Power BI Dax SUMX() function is shown below:
SUMX(<table>, <expression>)Where:
- SUMX = This function calculates the sum of a series of values.
- <table> = It specifies the table from which to retrieve the values for calculation.
- <expression> = It represents the expression to be evaluated for each row of the table, with its results summed up.
How to Sum 2 Columns in Power BI?
Let’s say you’re managing sales data in Power BI for your company. You have two columns, “Online Sales” and “Offline Sales,” each containing the total sales figures for your products. Now, you want to analyze the total sales regardless of whether they occurred online or offline.
Here, we have an Excel file that contains the Online Sales and Offline Sales columns.
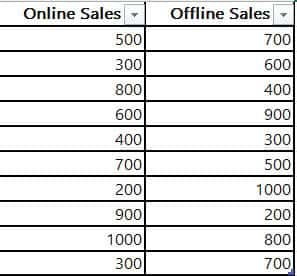
Now follow the below steps:
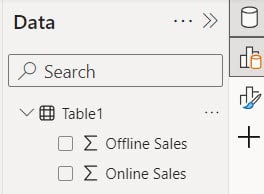
1. Open Power BI Desktop and load data using the Get data option. Then, you can see data in the Data pane.
2. Under the Modeling tab, click “New column.”

3. In the formula bar, put the below expression. Then click Commit.
Total Sales = 'Table1'[Offline Sales] + 'Table1'[Online Sales]Where:
- Total Sales = This is the name of the new column.
- Table1′[Offline Sales] = This part says, “Get the value of the Offline Sales column from Table1.”
- ‘Table1′[Online Sales] = Similarly, this part means “get the value of Online Sales column from Table1.”

4. First, switch to the Table view. Then, you’ll see the total sales column that was created.
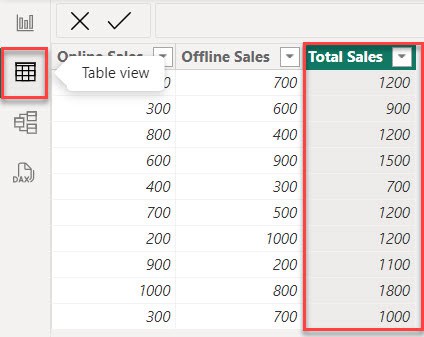
This way, we can sum 2 columns in Power BI.
Power BI Sum Multiple Columns
Here, in this example, we calculated the sum of multiple columns using the SUMX function in Power BI.
Let’s imagine you want to track your daily sales of different product categories using Power BI.
You have a dataset with columns like “Fruits Sales,” “Vegetables Sales,” and “Dairy Sales,” each representing the sales amount for that category on a given day.
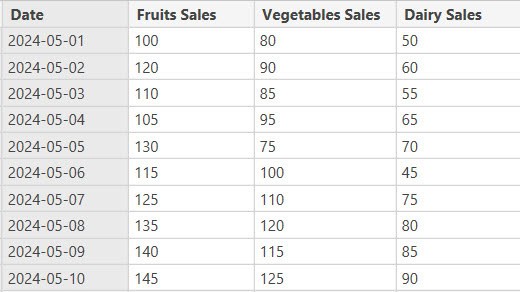
Now follow the below steps:
1. Open Power BI Desktop and load data using the Get data option. Then, you can see data in the Data pane.
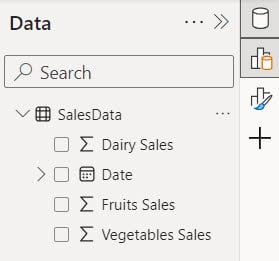
2. In the “Home” tab, click on “New measure.”

3. In the formula bar, type the below formula:
TotalSales = SUMX('SalesData', 'SalesData'[Fruits Sales] + 'SalesData'[Vegetables Sales] + 'SalesData'[Dairy Sales])Where:
- TotalSales = This is the name we’re giving to the result of our calculation, which is the total sales.
- SalesData = This line defines a table or data source named “SalesData.”
- ‘SalesData'[Fruits Sales] = This assigns a column within the “SalesData” table called “Fruits Sales,” which likely contains sales data for fruits.
- ‘SalesData'[Vegetables Sales] = This assigns another column in the “SalesData” table called “Vegetables Sales,” probably containing sales data for vegetables.
- ‘SalesData'[Dairy Sales] = Again, this assigns a column in the “SalesData” table named “Dairy Sales,” presumably containing sales data for dairy products.

4. Under the Home tab, expand Visual gallery(black box) -> Click the Table visual.
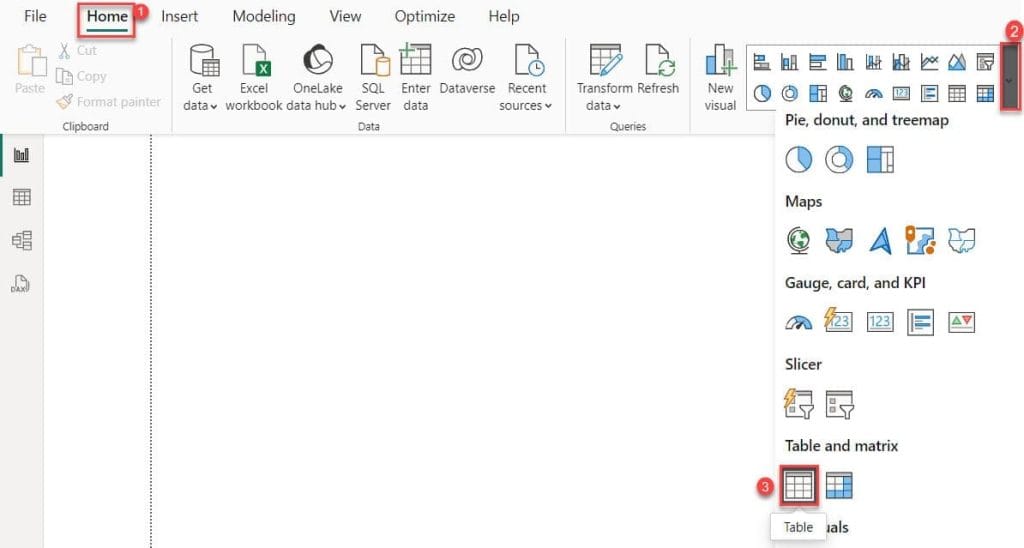
5. Then, using the +Add data option, add the Date, Dairy Sales, Fruits Sales, Vegetables Sales, and TotalSales into the Columns.
You should now see the total sales for each day represented in the table visual.
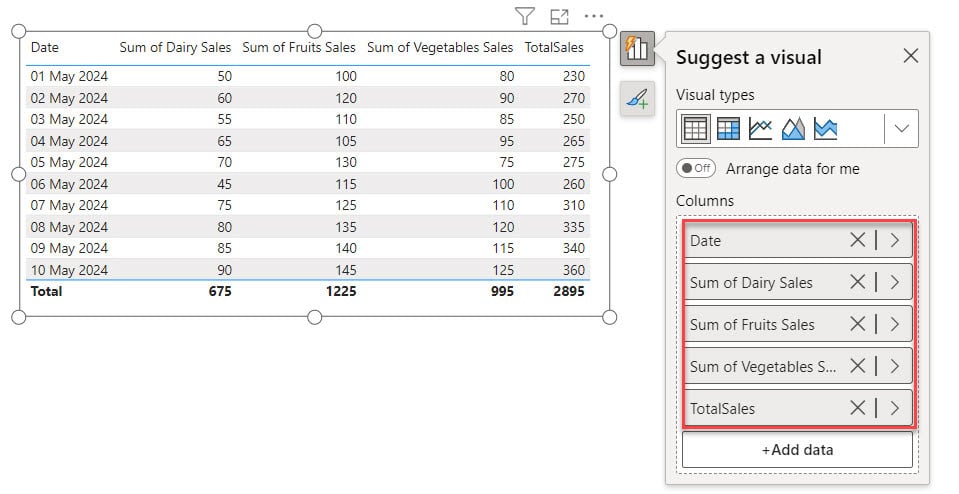
This way, you can create sum multiple columns in Power BI.
Power BI Sum Group by Multiple Columns
Let’s see how we can sum and group by Multiple columns in Power BI.
Let’s imagine you want to use Power BI to track your monthly earnings from each category.
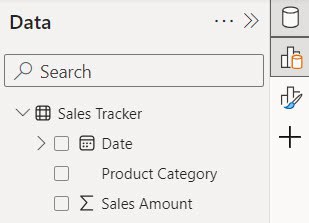
Here, we have a SharePoint list (Sales Tracker) that contains below columns with various data types:
| Columns | Data Types |
|---|---|
| Product Category | Single line of text |
| Date | Date and time |
| Sales Amount | Currency |
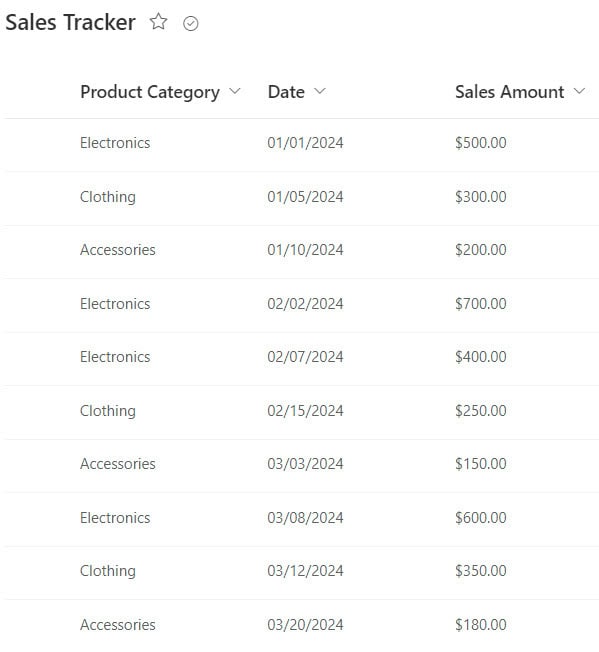
Now follow the below steps:
1. Open Power BI Desktop and load the above SharePoint List data using the Get data option. Then, you can see data in the Data pane.
2. Under the Home tab, click Transform data.

3. In the Power Query Editor, under the Home tab, click Group BY.

4. Once the Group By window opens, choose the “Basic” option. After that, select the “Product Category” columns. Next, name the column and choose “Sum” as the operation. Finally, select the “Sales Amount” column. Then click OK.
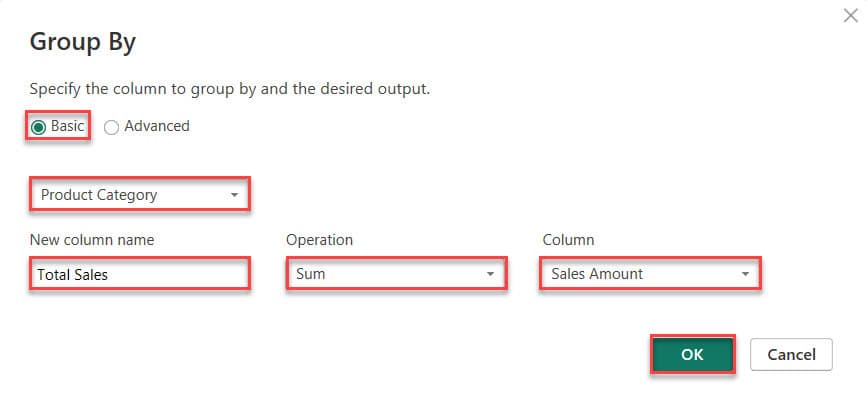
5. Now, we can see the original table getting replaced with a Group By table with two columns: Product Category and Total Sales.

This is how to sum and group by Multiple columns in Power BI.
Power BI Sum Two Columns From Different Tables
Let’s see how we can sum up multiple columns from different tables and display the value in Power BI.
Imagine you want to track your sales revenue and expenses separately to understand your profit.
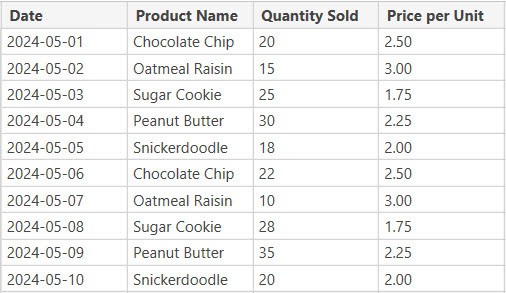
You have two tables: one for sales and another for expenses.
Sales Table:
Expenses Table:
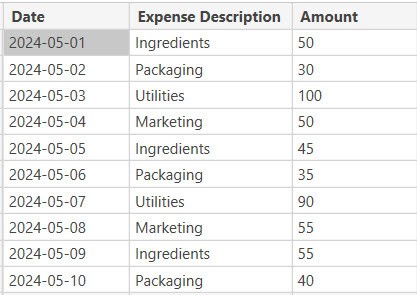
Now follow the below steps:
1. Open Power BI Desktop and load data using the Get data option. Then, you can see data in the Data pane.
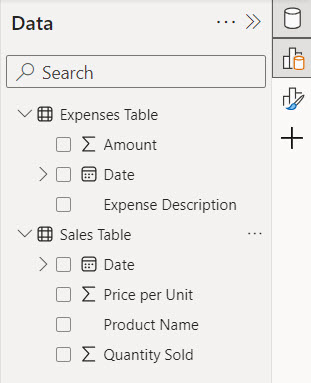
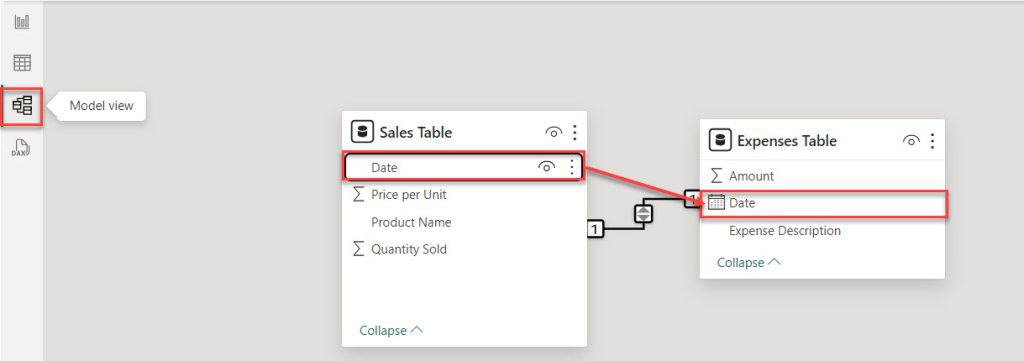
2. Go to “Model view.” Then, Sales Table, drag the Date column and drop it into the Expenses Table in the Date columns.
3. Under the “Home” tab click “New measure“.

4. In the formula bar, Put the below expression. Then click Commit.
Total Sales Revenue = SUMX('Sales Table', 'Sales Table'[Quantity Sold] * 'Sales Table'[Price per Unit])Where:
- Total Sales Revenue = This indicates that the calculation will result in the total revenue generated from sales.
- SUMX = This SUMX function adds up the results of a calculation for each row in a table.
- ‘Sales Table'[Quantity Sold] = This assigns the column ‘Quantity Sold’ from the table ‘Sales Table’, which likely contains the number of items sold.
- ‘Sales Table'[Price per Unit] = This assigns the column ‘Price per Unit’ from the table ‘Sales Table’, which likely contains the price of each item sold.

5. Under the “Home” tab, click “New measure“.

6. In the formula bar, Put the below expression. Then click Commit.
Total Expenses = SUM('Expenses Table'[Amount])Where:
- Total Expenses = This labels the outcome of our calculation, which is the total amount of expenses.
SUM() = This indicates that we’re using the SUM function, which adds together all the values within a specified column or expression.- ‘Expenses Table'[Amount] = Within the SUM function, we’re specifying the column ‘Amount’ from the table ‘Expenses Table’, which likely contains the individual expense amounts.

7. At this point, we have total sales revenue and total expenses. Now, we can create profit using the below expression.
Profit = [Total Sales Revenue] - [Total Expenses]Where:
- Profit = Name of the Measure
- [Total Sales Revenue] = Existing Measure
- [Total Expenses] = Existing Measure

Add a visual to display your profit over time or by product. This will give you insights into your business’s financial performance.
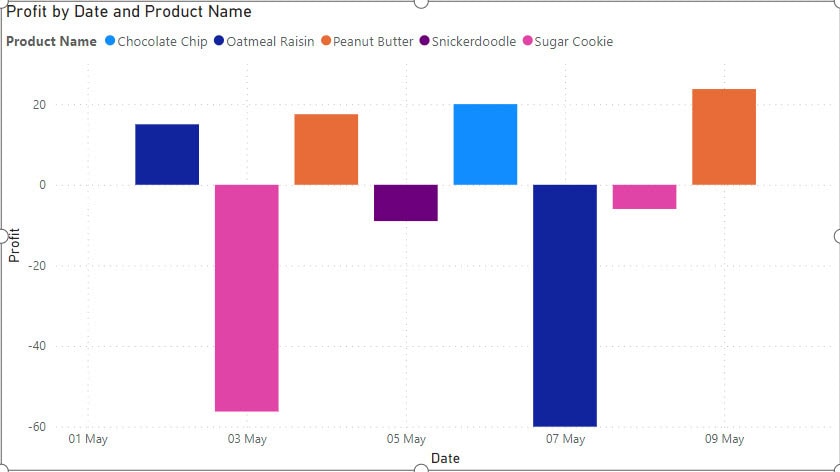
By following these steps, you can effectively manage and analyze your sales and expense data in Power BI, helping you make informed decisions to grow your business.
Power BI Measure Sum Multiple Columns
Suppose you want to track employee productivity by measuring the number of calls made, emails sent, and meetings attended.
You have a SharePoint List containing data for each employee’s activities.
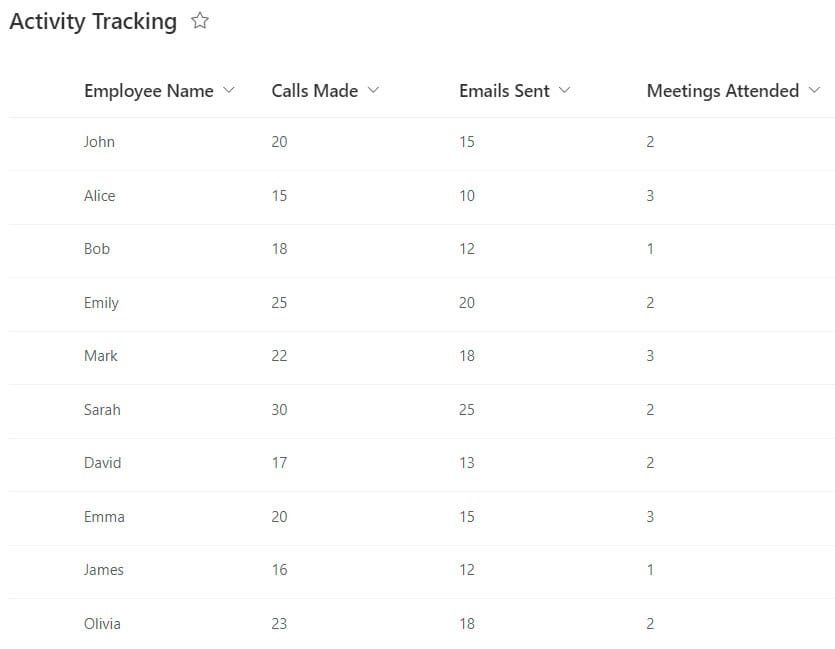
Now follow the below steps:
1. Open Power BI Desktop and load the above SharePoint List. Then, you can see data in the Data pane.
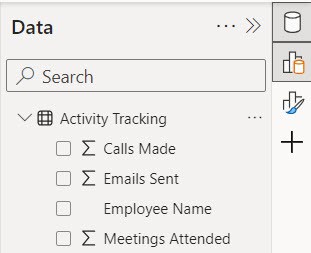
2. Under the “Home” tab, click “New measure“.

3. In the formula bar, Put the below expression. Then click Commit.
Total Activities = SUMX('Activity Tracking', 'Activity Tracking'[Calls Made] + 'Activity Tracking'[Emails Sent] +'Activity Tracking'[Meetings Attended])Where:
- Total Activities = This names the result we’re aiming for, which is the total count of activities.
- SUMX() = This suggests we’re using the SUMX function, which iterates over each row in a table and performs a calculation.
- ‘Activity Tracking'[Calls Made] = This specifies the column ‘Calls Made’ from the table ‘Activity Tracking’, likely containing the count of calls made.
- ‘Activity Tracking'[Emails Sent] = This specifies the column ‘Emails Sent’ from the table ‘Activity Tracking’, likely containing the count of emails sent.
- ‘Activity Tracking'[Meetings Attended] = This specifies the column ‘Meetings Attended’ from the table ‘Activity Tracking’, likely containing the count of meetings attended.

4. Using the Total Activities measure, we can use visuals to display the total activities for each employee.
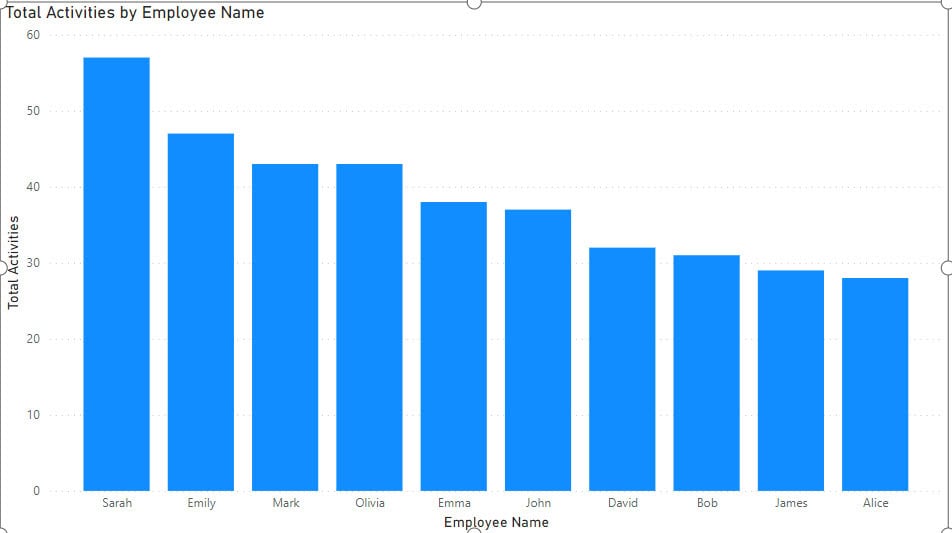
By following these steps, you can effectively track and analyze employee productivity using Power BI, helping you optimize your team’s performance and achieve your business goals.
Power BI Add Two Columns Together
Let’s see how we can add the values of two columns together in Power BI.
Let’s imagine you’re managing a sports team, and you want to analyze the performance of your team based on the number of times they’ve won and lost matches.
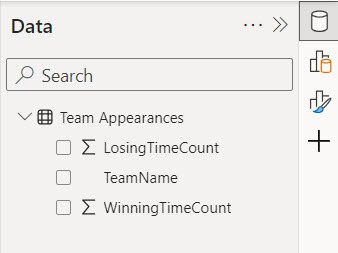
You have a dataset (SharePoint List) called ‘Team Appearances’, which includes the counts of winning and losing times for each match your team has played.

Now follow the below steps:
1. Open the Power BI Desktop and Load your dataset into Power BI. Make sure it includes columns for ‘Winning Time Count‘ and ‘Losing Time Count‘.
2. Then go to “Table view.” Under the Table tools, click “New column.”
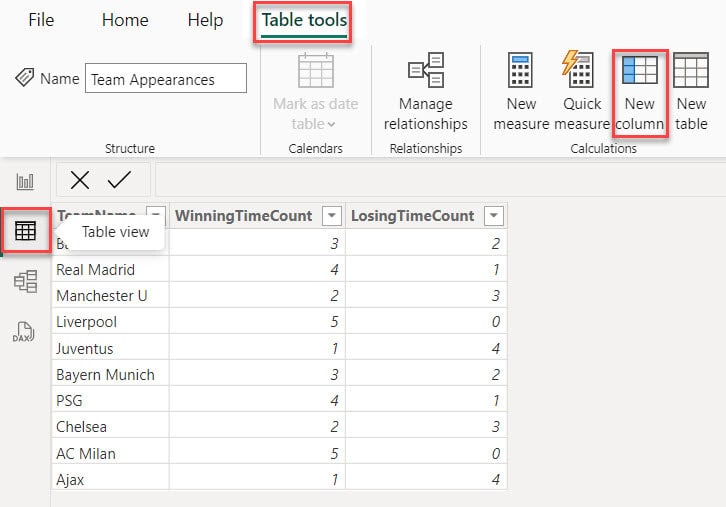
3. This will open the formula bar, where you can write below the DAX expression.
Percentage = CALCULATE(
                SUM('Team Appearances'[WinningTimeCount]) /
                (SUM('Team Appearances'[LosingTimeCount]) + SUM('Team Appearances'[WinningTimeCount]))
            )
Where:
- Percentage = This is the name given to the result of the calculation.
- CALCULATE = This function is used to modify the context in which other functions or expressions are evaluated, often by applying filters or conditions.
- SUM(‘Team Appearances'[WinningTimeCount]) = This part calculates the total sum of the ‘WinningTimeCount’ column in the ‘Team Appearances’ table, which represents the number of times a team has won.
- SUM(‘Team Appearances'[LosingTimeCount]) = This part calculates the total sum of the ‘LosingTimeCount’ column in the ‘Team Appearances’ table, which represents the number of times a team has lost.

4. Then you can see in the Table view the Percentage column created.
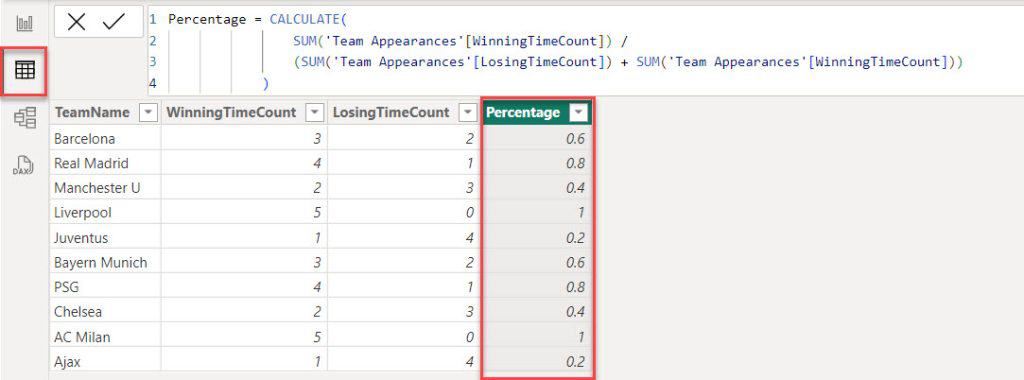
This is how to add values of two columns together and display the result in the newly calculated column in Power BI.
Power BI Sum Columns by Row
Now we see Power BI sum values of multiple columns per row
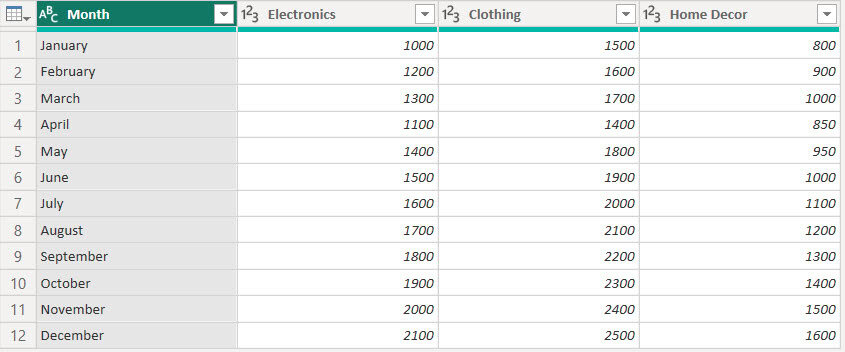
Let’s say you want to track your monthly sales for different products. You have a dataset with columns for each product and rows for each month.
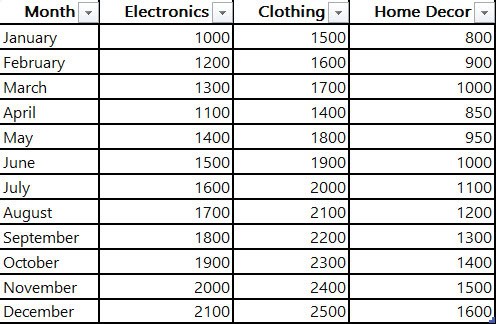
Now follow the below steps:
1. Open the Power query editor in Power BI Desktop and load the above table in the Power query editor.
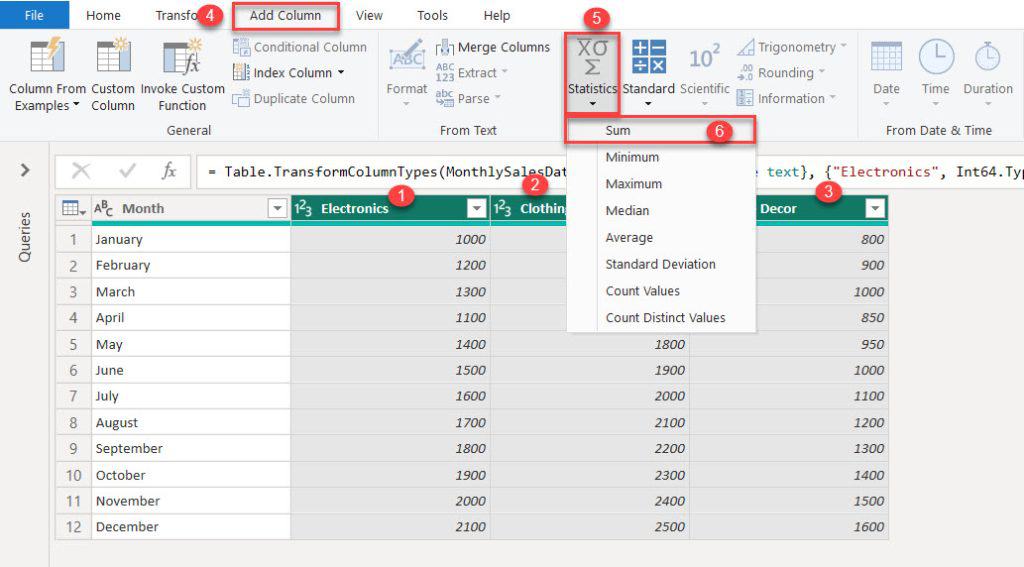
2. To add a column, select it by Ctrl + clicking. Next, go to the “Add column” tab, expand “Statistics,” and then click “Sum.”
3. Then you can see in the Power Query Editor a new column added.
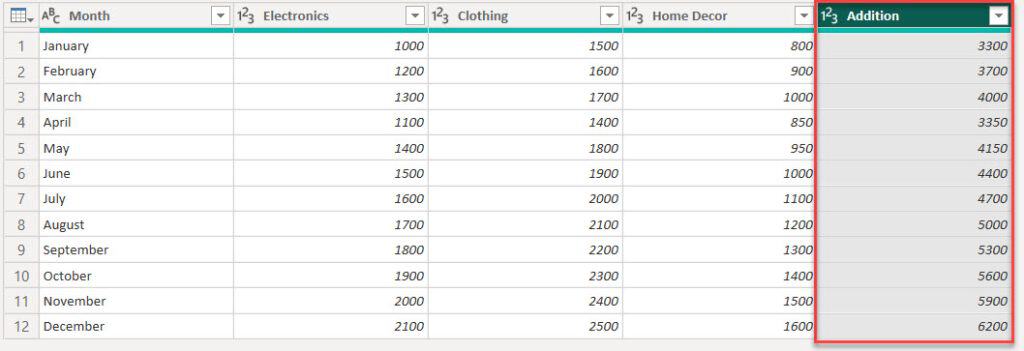
By following these steps, you’ll be able to use Power BI to sum up columns by row and analyze your monthly sales data effectively.
Power BI DAX Sum Multiple Columns with Filter
In this example, we see Power BI sum values of multiple columns per row with condition.
Imagine you want to keep track of employee expenses for different categories, such as travel, meals, and supplies. Each employee submits a monthly expense report with columns for each expense category.
You want to use Power BI to sum up each employee’s expenses, but you also want to apply a condition to include only expenses above $50.
To do this, we can use below table:
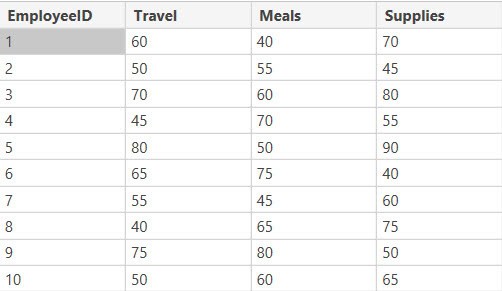
Now follow the below steps:
1. Open Power BI Desktop and load data using the Get data option. Then, you can see data in the Data pane.
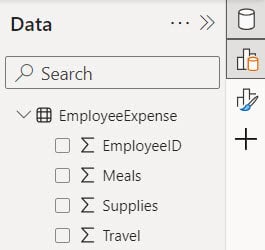
2. Then go to “Table view.” Under the Table tools, click “New column.”
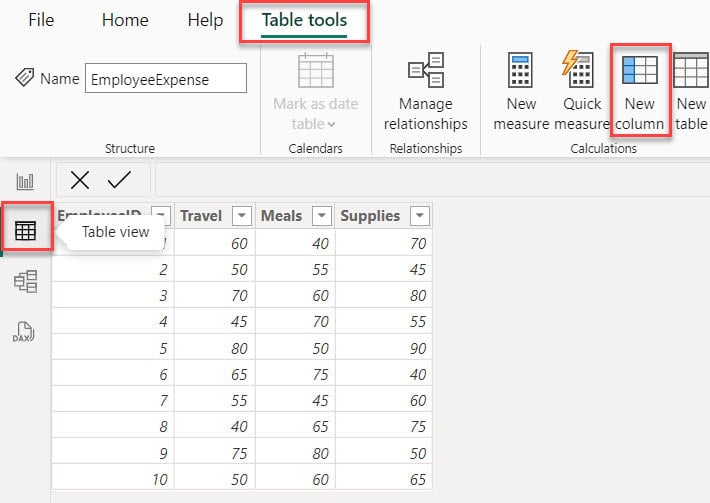
3. This will open the formula bar, where you can write below the DAX expression.
TotalExpenses =
    CALCULATE (
        SUMX (
            'EmployeeExpense',
            IF ( 'EmployeeExpense'[Travel] > 50, 'EmployeeExpense'[Travel], 0 ) +
            IF ( 'EmployeeExpense'[Meals] > 50, 'EmployeeExpense'[Meals], 0 ) +
            IF ( 'EmployeeExpense'[Supplies] > 50, 'EmployeeExpense'[Supplies], 0 )
        )
    )
Where:
- TotalExpenses = This is the name given to the calculation’s result.
- CALCULATE() = This function modifies the context in which other expressions are evaluated, often by applying conditions.
- SUMX() = This function iterates over each row of a table and calculates a sum based on an expression provided for each row.
- EmployeeExpense = This specifies the table named ‘EmployeeExpense’ from which the data will be used for calculations.
- IF ( ‘EmployeeExpense'[Travel] > 50, ‘EmployeeExpense'[Travel], 0 ) = This part checks if the value in the ‘Travel’ column of the ‘EmployeeExpense’ table is greater than 50. If it is, it returns the value of ‘Travel’; otherwise, it returns 0.
- IF ( ‘EmployeeExpense'[Meals] > 50, ‘EmployeeExpense'[Meals], 0 ) = This part checks if the value in the ‘Meals’ column of the ‘EmployeeExpense’ table is greater than 50. If it is, it returns the value of ‘Meals’; otherwise, it returns 0.
- IF ( ‘EmployeeExpense'[Supplies] > 50, ‘EmployeeExpense'[Supplies], 0 ) = This checks if the value in the ‘Supplies’ column of the ‘EmployeeExpense’ table is greater than 50. If it is, it returns the value of ‘Supplies’; otherwise, it returns 0.

4. Now, you’ll notice a new column added, showing the total expenses. This includes employee expenses for various categories where the expense is more than 50.
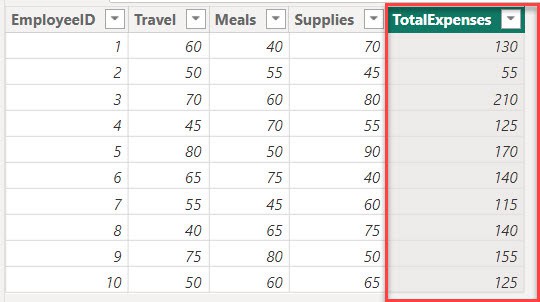
By following these steps, you’ll be able to use Power BI to sum up values of multiple columns per row with a condition.
Power Query Sum Multiple Columns
In this example, we see how to add multiple columns in Power BI Power Query Editor.
We have a dataset containing columns for Region, Electronics, Clothing, and Home Goods.
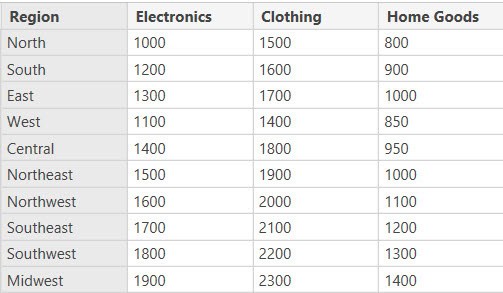
Now follow the below steps:
1. Open Power BI Desktop and load data using the Get data option. Then, you can see data in the Data pane.
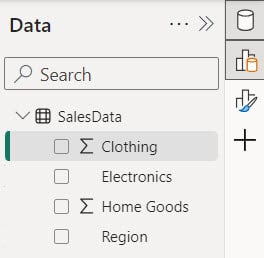
2. Then, Under the Home tab, click Transform data.

3. In the Power Query Editor, under the Add Column tab, click Custom Column.

4. In the formula editor, write a formula to sum the sales across multiple columns. In my case, create a new column called “Total Sales” with the formula below:
= [Electronics] + [Clothing] + [Home Goods]Where Electronics, Clothing, and Home Goods are the names of the Columns. Then click OK.
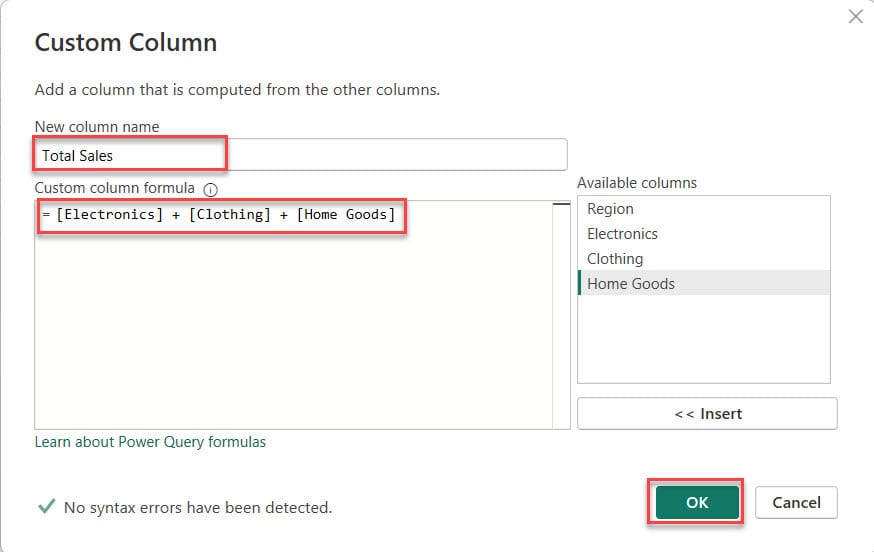
5. Now, you can see in the Power Query Editor Total Sales column created.

Some more Power BI articles you may also like:
- Power BI Divide Two Columns
- Power BI Filter Between Two Dates
- Create Power BI Bookmarks
- Stacked Column Chart in Power BI
- Power Query Date Functions
- Power BI If Date is Greater than Specific Date
Now, you’ll be able to use Power Query Editor to sum up multiple columns and analyze your sales data across different regions more efficiently. This article explained everything about how to sum multiple columns in Power BI, working with Power BI sum group by multiple columns, and many more like:
- Sum two columns from different tables in Power BI
- Power BI measure sum multiple columns
- How to add two columns together in Power BI
- Working with Power BI sum columns by row
- Power BI dax sum multiple columns with filter
- How to work with Power query sum multiple columns
I am Bijay a Microsoft MVP (10 times – My MVP Profile) in SharePoint and have more than 17 years of expertise in SharePoint Online Office 365, SharePoint subscription edition, and SharePoint 2019/2016/2013. Currently working in my own venture TSInfo Technologies a SharePoint development, consulting, and training company. I also run the popular SharePoint website EnjoySharePoint.com