In this tutorial, we will learn about Power BI Filter Date Between and Power BI filter between two dates.
Additionally, we will discuss the topics below:
- Power BI filter between two dates Dax
- How to filter between two dates in Power BI?
- Power BI slicer between two dates
- Power BI measure filter date range
- Power BI filter between two relative dates
Power BI Filter Date Between
In the Power BI filter, the date between means you’re choosing a date range in Power BI. When you use “Filter Date Between,” you’re basically telling Power BI only to show data that falls within the range you specify. It’s like putting a border around the dates you want to focus on so you can easily analyze.
Let’s say you have a sales table in Power BI that covers the entire month of April data. Now, you want to see only the sales data from April 1st to April 10th. To do this, you’d use the “Filter Date Between” feature. You’d set the start date as January 1st and the end date as March 31st.
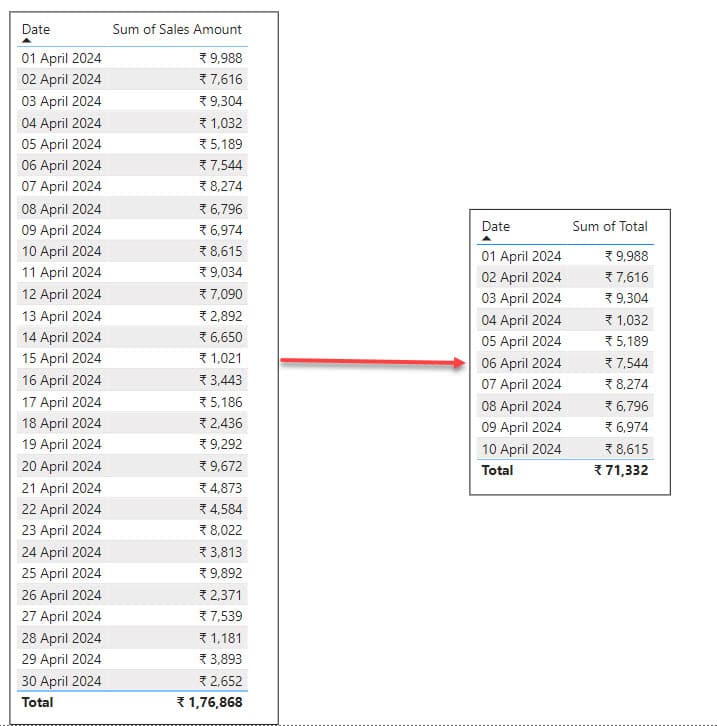
Filter Between Two Dates in Power BI
To filter between two dates in Power BI, refer to the example below:
We have a SharePoint List (Project Schedule 2024) that contains below columns with various data types:
| Columns | Data Types |
|---|---|
| Project Name | Single line of text |
| Start Date | Date and time |
| End Date | Date and time |
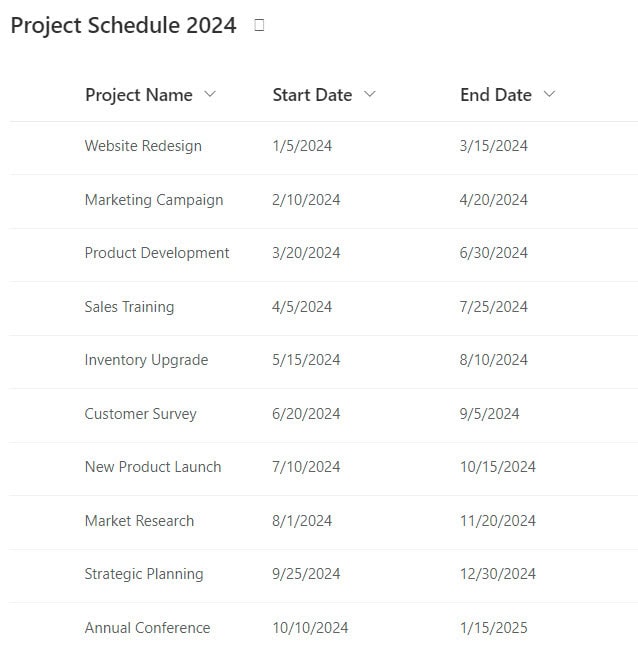
Now follow the below steps:
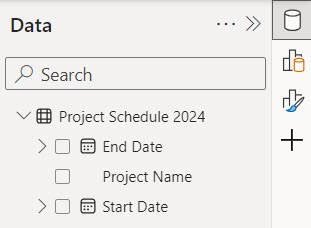
1. Open Power BI Desktop and load the above SharePoint List in Power BI Desktop. Then, you can see the data presented in the Data pane.
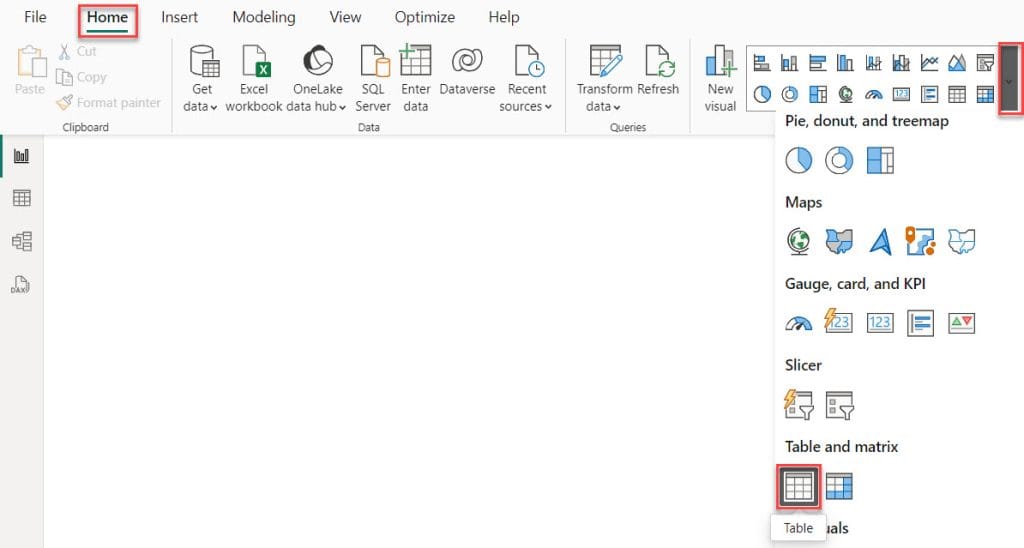
2. Under the Home tab, expand Visual gallery(black box) -> Click the Table visual.
3. Then, using the +Add data option, add the Project name, Start Date, and End Date into the Columns field.
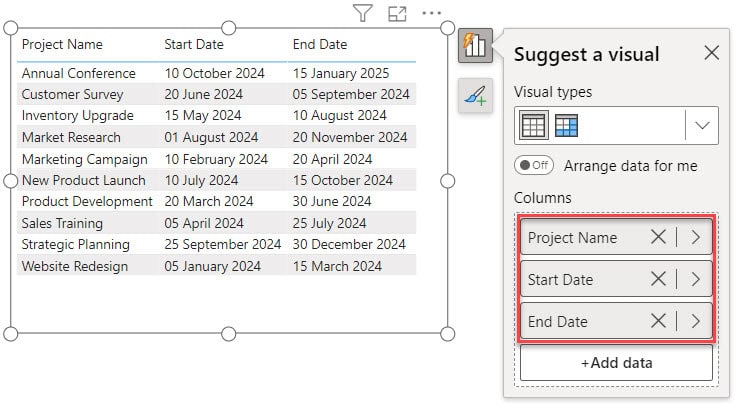
4. To apply a filter, expand the Filter pane and choose the data field you want. In this case, I’ve selected the StartDate data field.
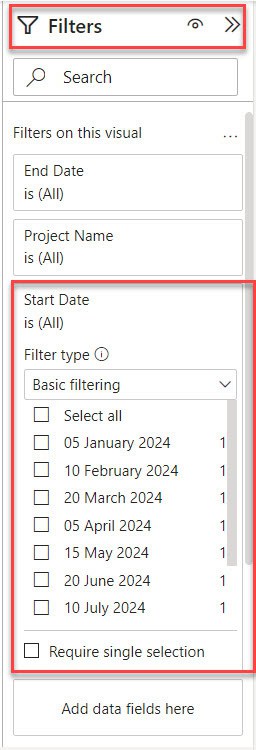
5. Select “Advanced filtering” as the Filter type, and then apply the condition. For example, you can filter data between two dates. After setting the condition, click on the “Apply filter” option to implement it.
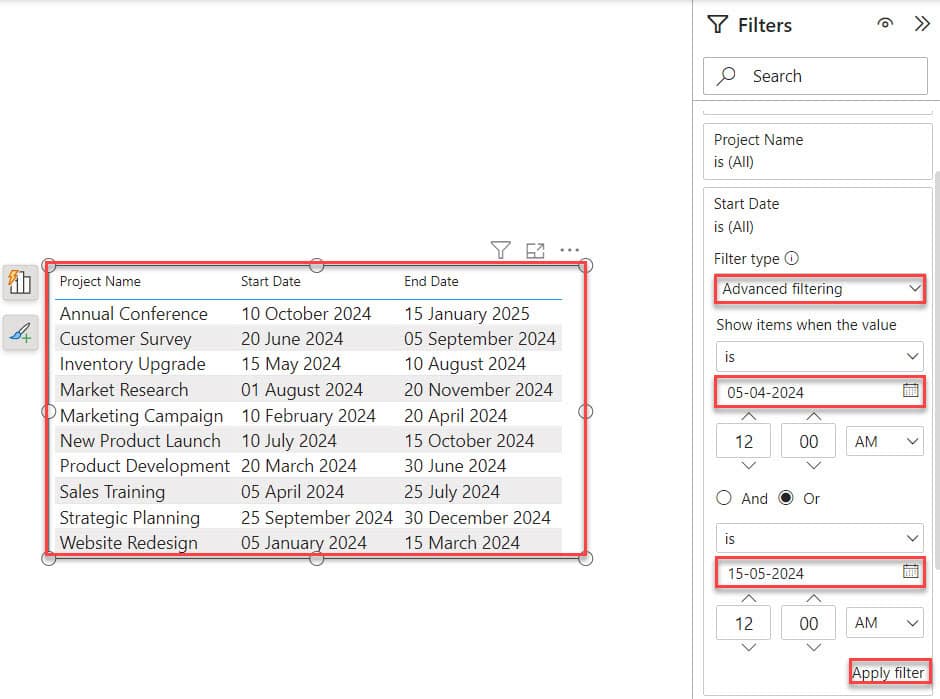
6. After that, you can see it filters and displays the data in the table visually based on the condition applied.

This is how you filter data between two dates in Power BI using the Filter Fields pane.
Power BI Filter Between Two Dates DAX
In this example we will see how we use Power BI DAX to filter between two dates.
Suppose you want to analyze sales data in Power BI for a specific time period, like between January 1st, 2024, and February 28th, 2024. Here I tell you how we can do this:
Here, we have a SharePoint list named Transactions that contains the following columns with various data types:
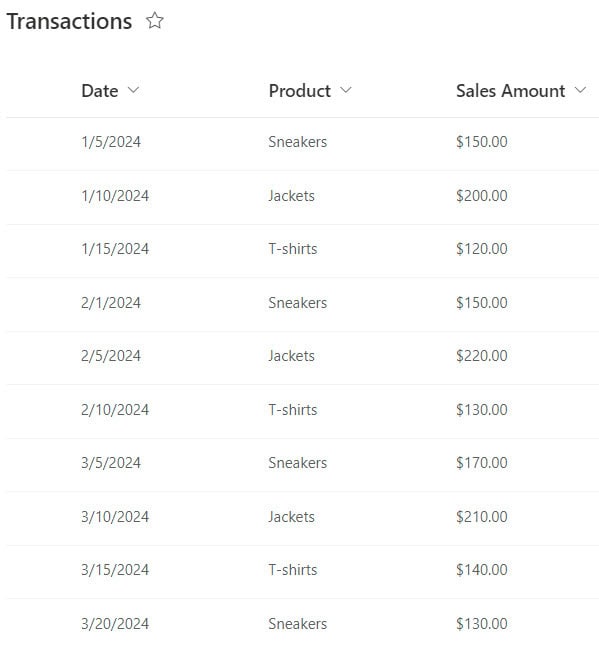
Now follow the below steps:
1. Open Power BI Desktop and load the above SharePoint List in Power BI Desktop. Then, you can see the data presented in the Data pane.
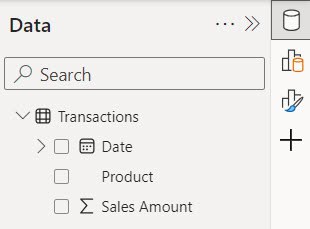
2. Then, in the Home tab, click “New measure.”

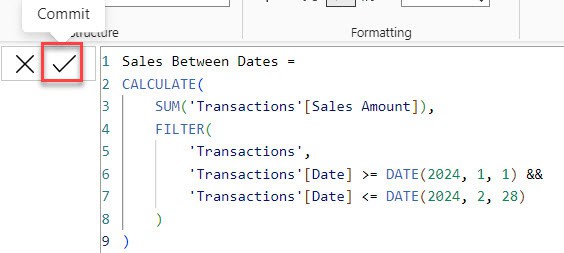
3. In the formula bar, Put the below expression. Then click Commit.
Sales Between Dates =
CALCULATE(
    SUM('Transactions'[Sales Amount]),
    FILTER(
        'Transactions',
        'Transactions'[Date] >= DATE(2024, 1, 1) &&
        'Transactions'[Date] <= DATE(2024, 2, 28)
    )
)
Where:
- Sales Between Dates = This is the name given to the calculated measure, indicating that it calculates sales between specific dates.
- CALCULATE() = This function is used to modify or filter the context in which other functions operate.
- SUM(‘Transactions'[Sales Amount]) = This calculates the total sales amount by summing up the values in the “Sales Amount” column of the “Transactions” table.
- FILTER(‘Transactions’, ‘Transactions'[Date] >= DATE(2024, 1, 1) && ‘Transactions'[Date] <= DATE(2024, 2, 28)) = This filters the “Transactions” table to only include rows where the date falls between January 1, 2024, and February 28, 2024.
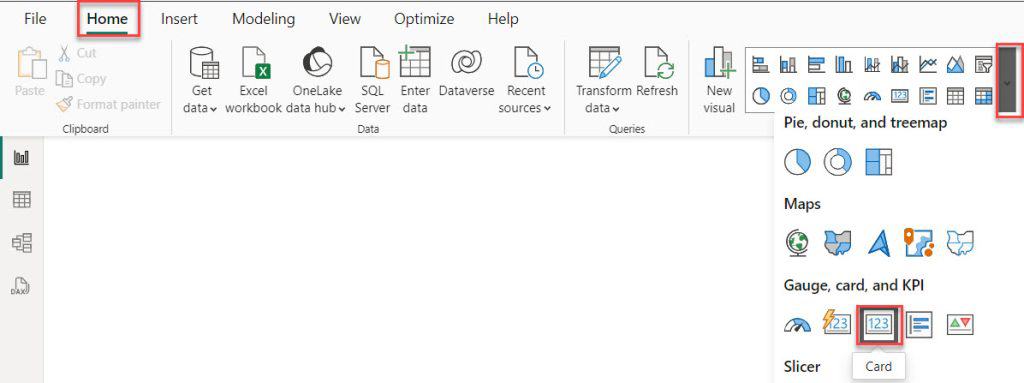
4. Under the Home tab, expand Visual gallery(black box) -> Click the Card visual.
5. Then, using the +Add data option, add Sales Between Dates in the Data field.
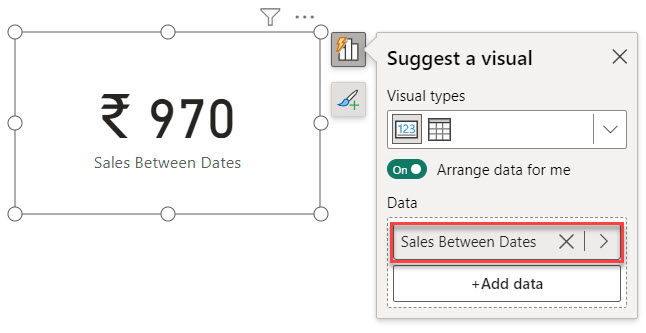
This way, you can calculate sales between data in Power BI using DAX.
How to Filter Between Two Dates in Power BI?
In this example, we will see how to filter between two dates in Power BI using the DATESBETWEEN function.
Let’s say you want to analyze sales data between specific dates to track the performance of a recent marketing campaign that ran from January 1st to January 31st.
You have a dataset showing sales amounts for the months of January and February, as shown in the table below:
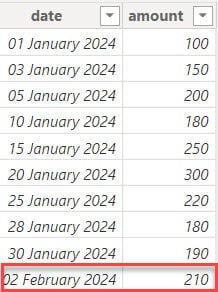
Now follow the below steps:
1. Open Power BI Desktop and load data using the Get data option. Then, you can see data in the Data pane.
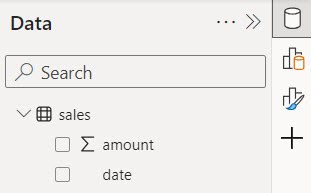
2. Then, in the Home tab, click “New measure.”

3. In the formula bar, Put the below expression. Then click Commit.
SalesInRange = CALCULATE(SUM(Sales[Amount]), DATESBETWEEN(sales[Date], DATE(2024,01,01), DATE(2024,01,31)))Where:
- SalesInRange = This is the name we’re giving to the calculated measure we’re creating.
- CALCULATE = This function modifies the context in which other expressions are evaluated, often by applying conditions.
- SUM(Sales[Amount]) = This part tells Power BI to sum up the values in the “Amount” column of the “Sales” table; it calculates the total sales amount.
- DATESBETWEEN(sales[Date], DATE(2024,01,01), DATE(2024,01,31)) = This function filters the dates in the “Date” column of the “sales” to include only those between January 1, 2024, and January 31, 2024.

4. Under the Home tab, expand Visual gallery(black box) -> Click the Card visual.

5. Then, using the +Add data option, add SalesInRange in the Data field.
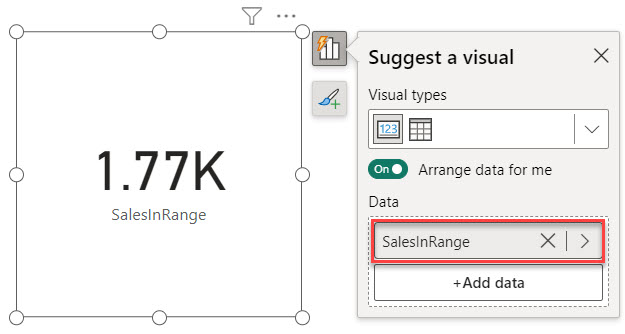
This way, you can filter between two dates in Power BI using the DATESBETWEEN function.
Power BI Slicer Between Two Dates
Let’s see how we can apply a filter between two dates using a date slicer in Power BI.
Let’s imagine you want to analyze your sales data from January 1st, 2024, to April 30th, 2024, to understand which products are selling the most during this period and to identify any trends.
We have a dataset in the Excel file below that shows sales from January to May.
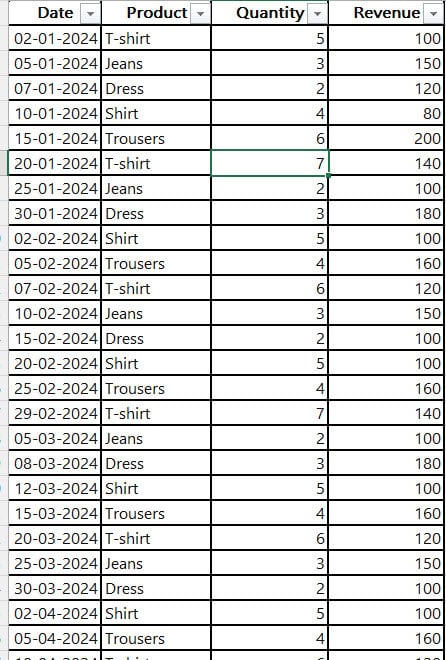
Now follow the below steps:
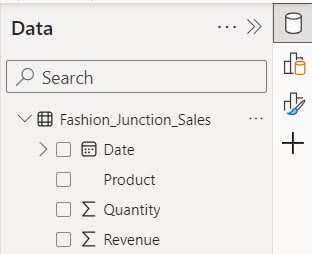
1. Open Power BI Desktop and load data using the Get data option. Then, you can see data in the Data pane.
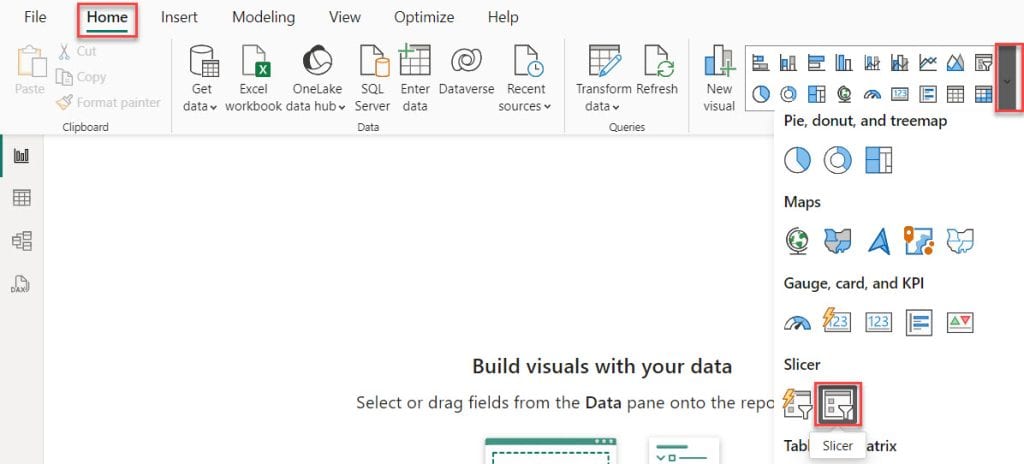
2. Under the Home tab, expand Visual gallery(black box) -> Click the Slicer visual.
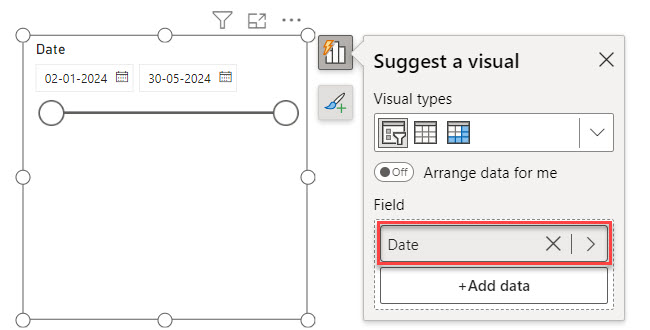
3. Then, using the +Add data option, add the Date column into the Field.
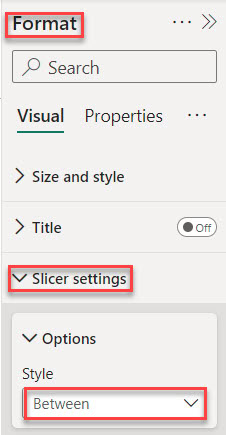
If your slicer doesn’t resemble the one shown above, follow these steps: select the slicer, open the Format pane, expand slicer settings, and under “Style,” choose “Between.”
4. Under the Home tab, expand Visual gallery(black box) -> Click the Stacked column chart.

5. Then, using the +Add data option, add Product into the X-axis and Revenue into the Y-axis.
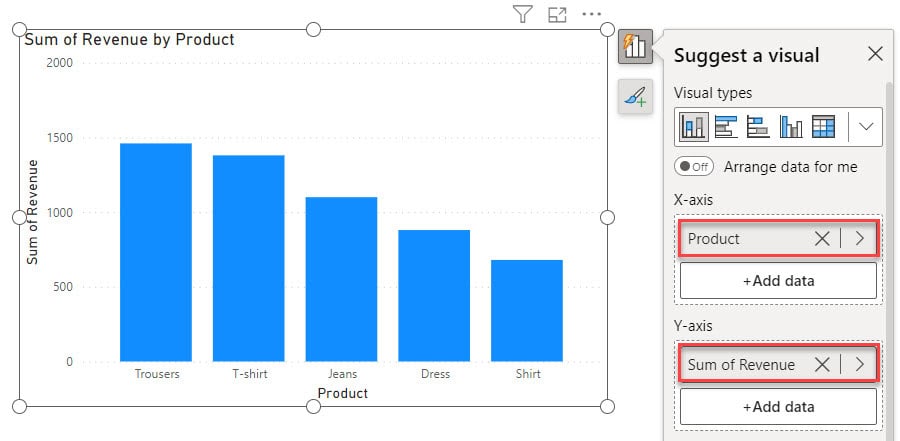
6. After that you select January 1st, 2024, to April 30th, 2024 in the slicer.
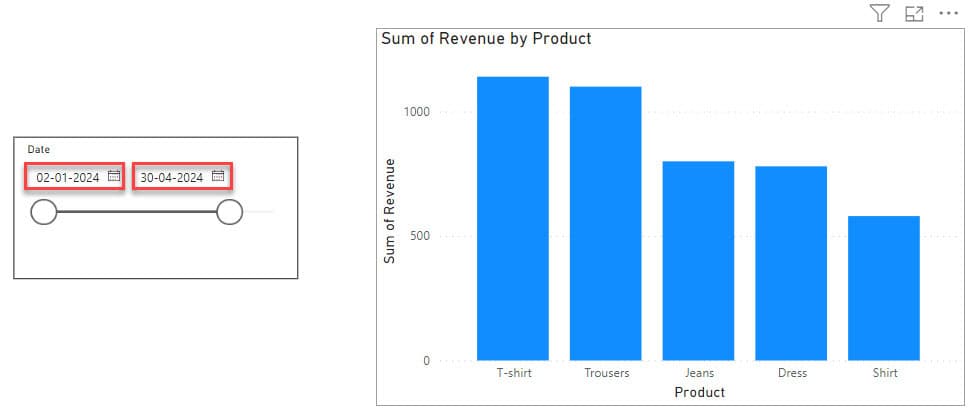
Now I hope you can see when we select January 1st, 2024, to April 30th, 2024, in the slicer, the column changed.
By following these steps, you’ll be able to use Power BI slicers to analyze your sales data between two specific dates and make informed business decisions.
Power BI Measure Filter Date Range
Imagine you want to analyze sales performance for a specific date range. For example, you might want to see the total sales amount for the past 30 days.
To do this, you have below data set:
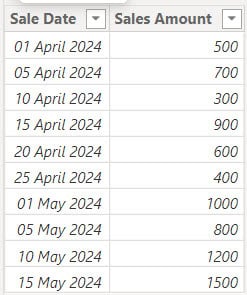
Now follow the below steps:
1. Open Power BI Desktop and load data using the Get data option. Then, you can see data in the Data pane.
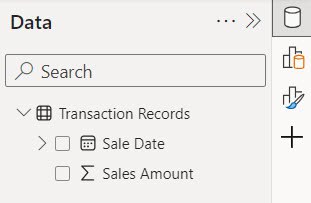
2. Then, in the Home tab, click “New measure.”

3. In the formula bar, Put the below expression. Then click Commit.
Last 30 days Sales Amount =
CALCULATE(
    SUM('Transaction Records'[Sales Amount]),
    FILTER(
        'Transaction Records',
        'Transaction Records'[Sale Date] >= TODAY() - 30 && 'Transaction Records'[Sale Date] <= TODAY()
    )
)
Where:
- Last 30 days Sales Amount = This is the name given to the result of the expression.
- CALCULATE() = This function allows us to modify the context in which other functions are evaluated.
- SUM(‘Transaction Records'[Sales Amount]) = This calculates the sum of the ‘Sales Amount’ column from the ‘Transaction Records’ table, giving us the total sales amount.
- ‘Transaction Records'[Sale Date] >= TODAY() – 30 && ‘Transaction Records'[Sale Date] <= TODAY() = This function filters the ‘Transaction Records’ table only to include rows where the ‘Sale Date’ falls within the last 30 days from today.

4. Under the Home tab, expand Visual gallery(black box) -> Click the Card visual.
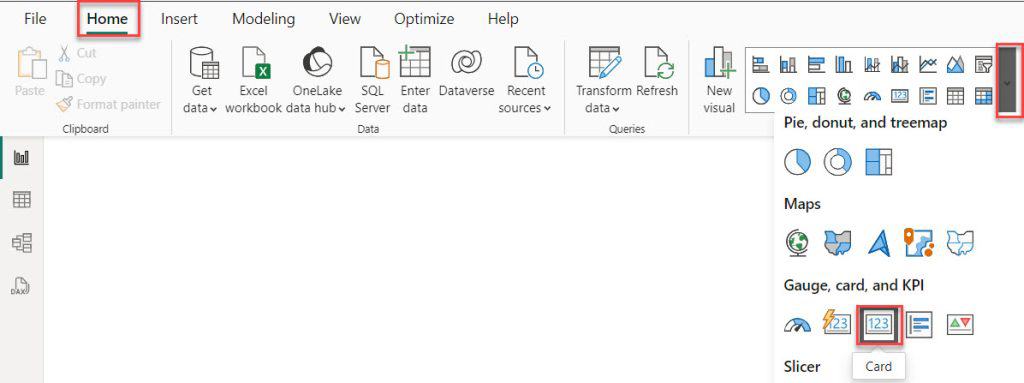
5. Then, using the +Add data option, add the Last 30 days Sales Amount in the Data field.
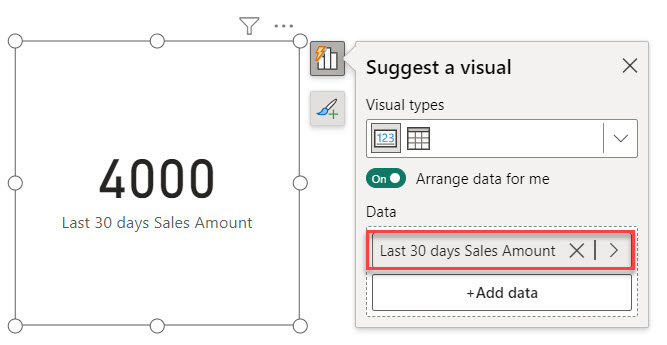
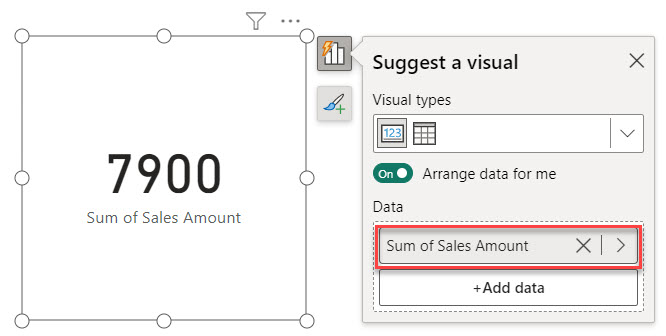
6. If you add the Sales Amount to the slicer, you can see the total sales.
This way, you can use Power BI to measure the filter date range.
Power BI Filter Between Two Relative Dates
Let’s say you working on sales data in Power BI. Your boss wants to see the sales performance for the past week, but they also want the flexibility to check the performance for any other week.
You can do this using the relative filter type in the Power BI filter panel.
According to our requirement, we have a SharePoint list named Sales Transactions that contains the following columns with various data types:
| Columns | Data Types |
|---|---|
| Order ID | Number |
| Order Date | Date and time |
| Product | Single line of text |
| Quantity | Number |
| Price | Currency |
| Customer | Single line of text |
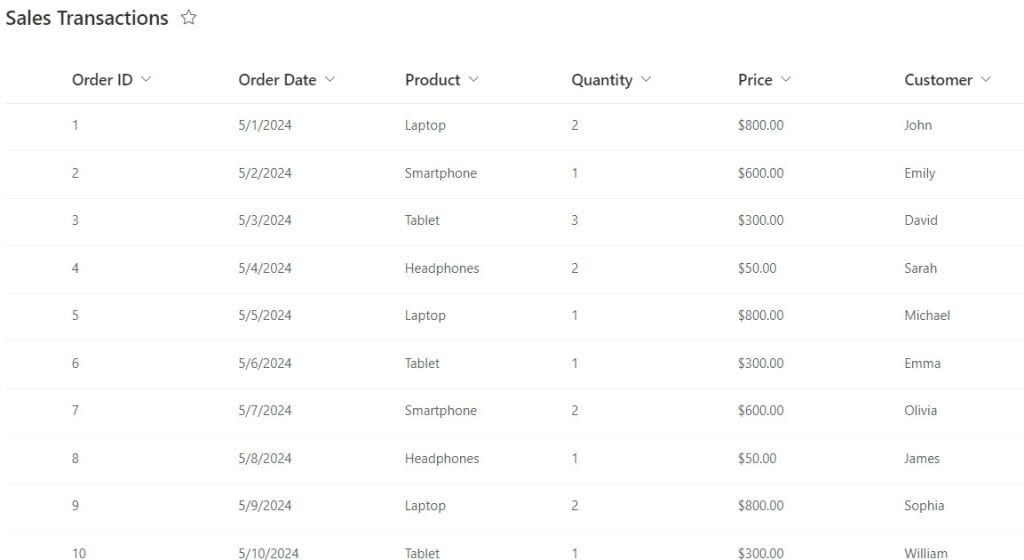
Now follow the below steps:
1. Open Power BI Desktop and load data using the Get data option. Then, you can see data in the Data pane.
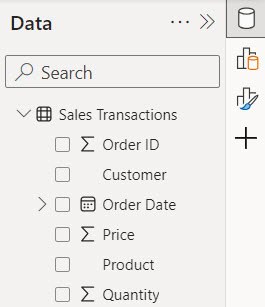
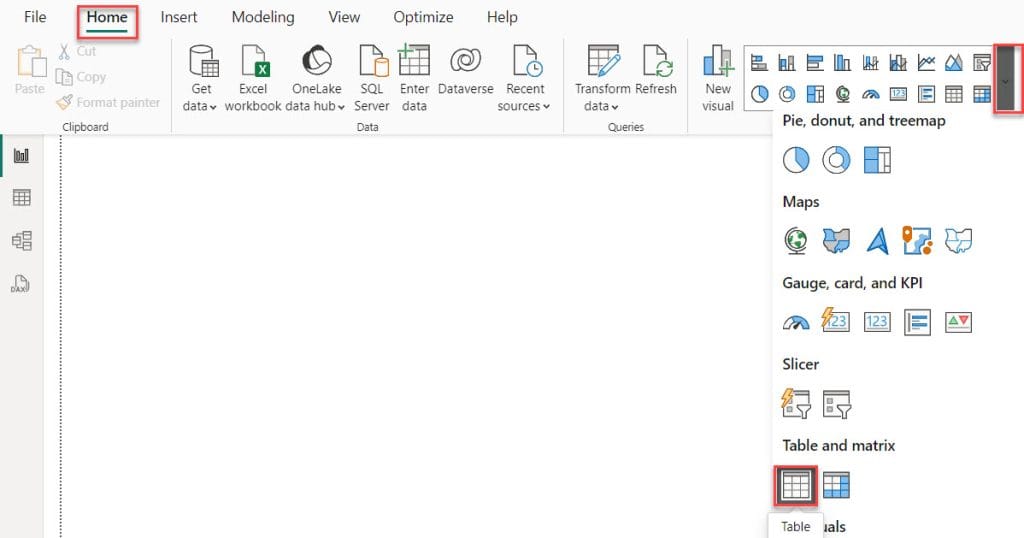
2. Under the Home tab, expand Visual gallery(black box) -> Click the Table visual.
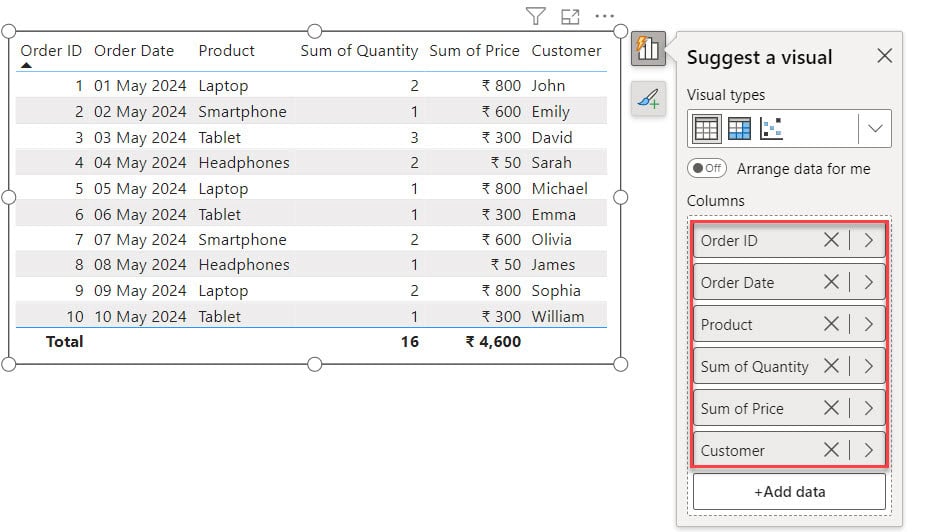
3. Then, using the +Add data option, add the Order ID, Order Date, Product, Quantity, Price, and Customer into the Columns field.
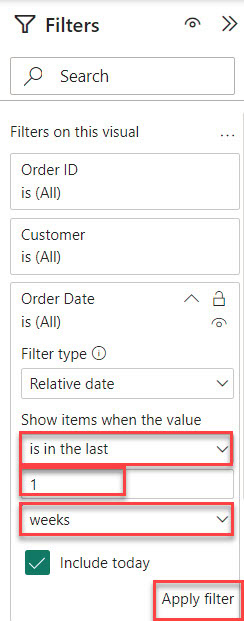
4. Select the table visual and expand the filter pane. Click on the dropdown menu for your date field in the Filters pane. Select “Filter Type” and choose “Relative date” filtering.
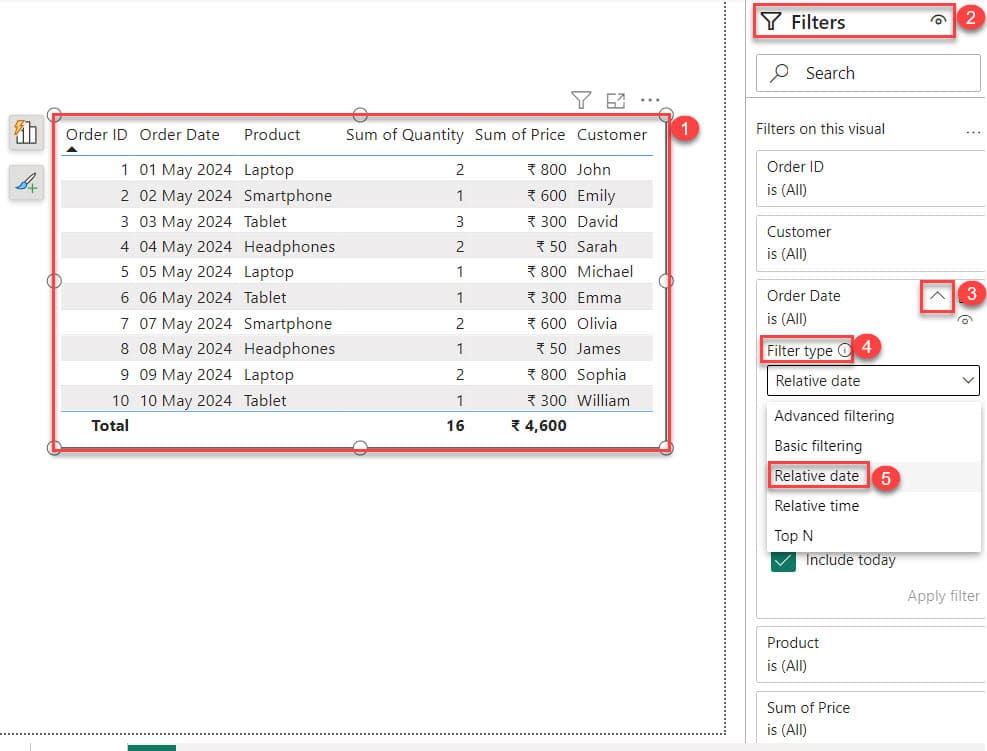
5. Here, we’re looking at sales from last week. To do this, choose “is in the last” from the dropdown, then type “1” in the box next to “Week.” After that, click “Apply filter.”
6. After that you can see our visuals will now show sales data for the past week. Since today is May 8th, selecting “Last week” will display sales from May 2nd to May 8th.
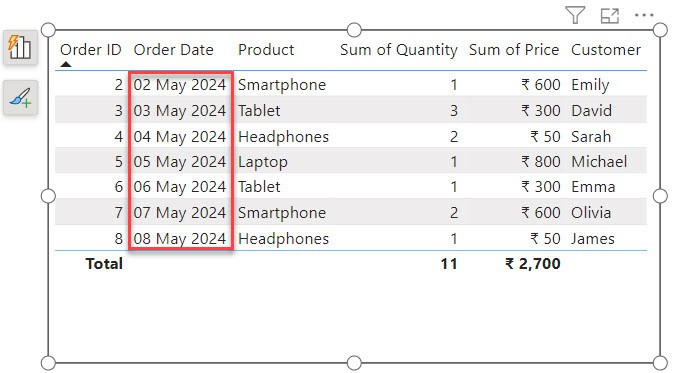
This is how to apply filters between dates using the relative filter type in Power BI.
Some more Power BI articles you may also like:
- Power BI Date Slicer
- Remove Alternate Rows Power Query
- Bookmarks in Power BI
- Power BI If Statement
- Power BI If Date is Greater than Specific Date
- Power BI Sum Multiple Columns
In this tutorial, we’ve learned about filtering dates in Power BI, focusing on the “between” function. We’ve explored using DAX to filter data between two specific dates, utilizing slicers to narrow down data within a date range easily. We’ve also looked at creating measures to filter data based on date ranges and explored filtering between relative dates.
I am Bijay a Microsoft MVP (10 times – My MVP Profile) in SharePoint and have more than 17 years of expertise in SharePoint Online Office 365, SharePoint subscription edition, and SharePoint 2019/2016/2013. Currently working in my own venture TSInfo Technologies a SharePoint development, consulting, and training company. I also run the popular SharePoint website EnjoySharePoint.com
Good day – thanks for this, I see you MVP in sharepoint, really hoping you could assist me – Going to create a list input on sharepoint – user will input a ID then start & end date and a value. In Power BI – I need to extract the data into a table showing each day (date) and the value divided by the number of days between the start and end dates.