To remove an alternate row in Power Query Editor, open the Editor. Click on the “Home” tab and expand the “Remove Rows” option. Finally, choose “Remove Alternate Rows.” This is how Power BI removes alternate rows.
In this tutorial, we will learn 8 easiest methods to remove alternate rows Power Query, such as how to remove a specific row in the Power Query editor and Power Query remove rows based on condition.
Additionally, we will discuss the topics below:
- Remove top rows in Power Query
- How To make first row as header in Power BI
- Power Query remove rows based on multiple conditions
- Power Query remove blank rows
- Remove duplicate rows in Power Query
- Remove duplicate value in Power Query Editor
Remove Alternate Rows Power Query Editor
The Remove Alternating Rows function isn’t simple. In fact, it’s the most complex way to delete rows. This is because it lets us choose a specific pattern in Power Query Editor.
In this tutorial, we will learn how we can remove alternate rows in Power Query Editor.
We have a SharePoint List containing sales data for the month of March. In this example, we’re using the SharePoint List below.
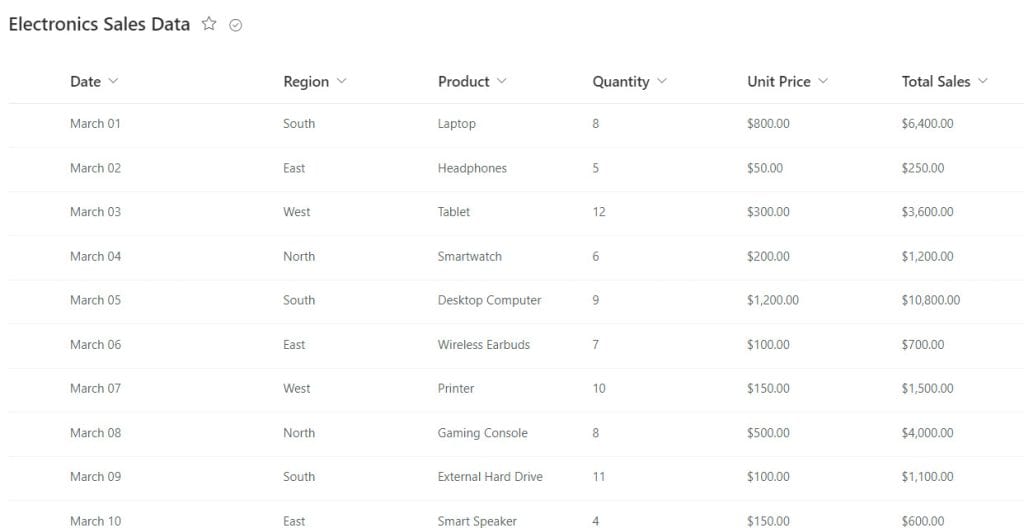
Now follow the below steps to remove the alternate row:
1. Open Power BI Desktop, then under the Home tab, click Transform data.

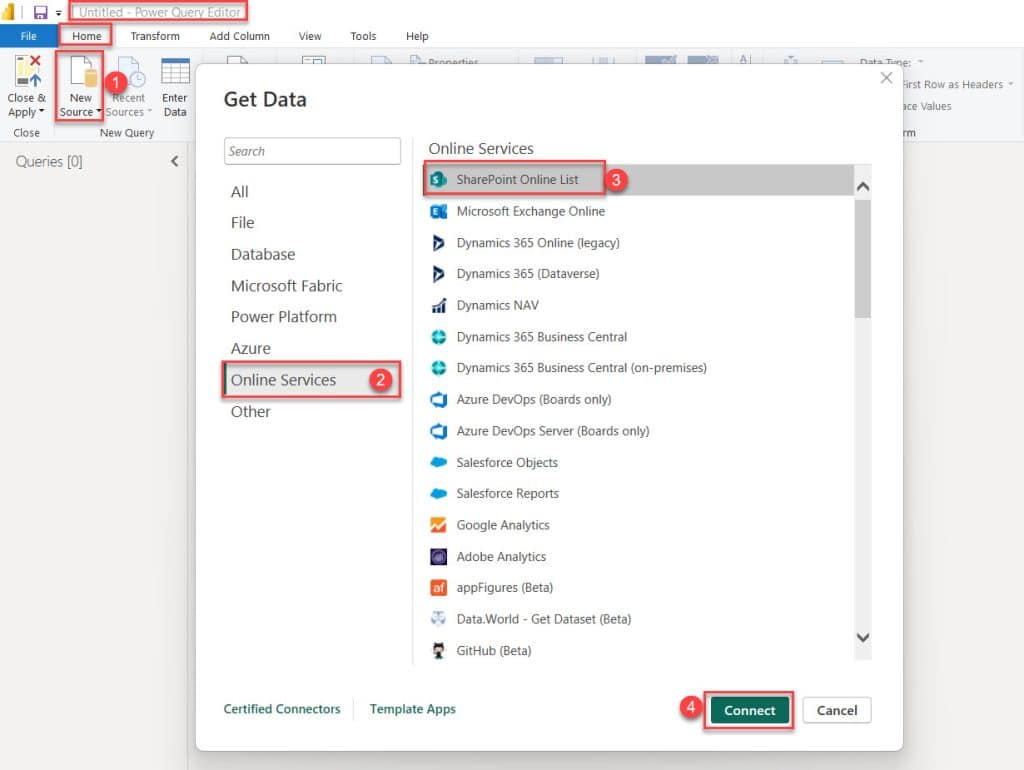
2. In the Power Query Editor, go to the Home tab and click on New Source. A dialog box called Get Data will pop up. Click on Online Services, then select SharePoint Online List, and finally click Connect.
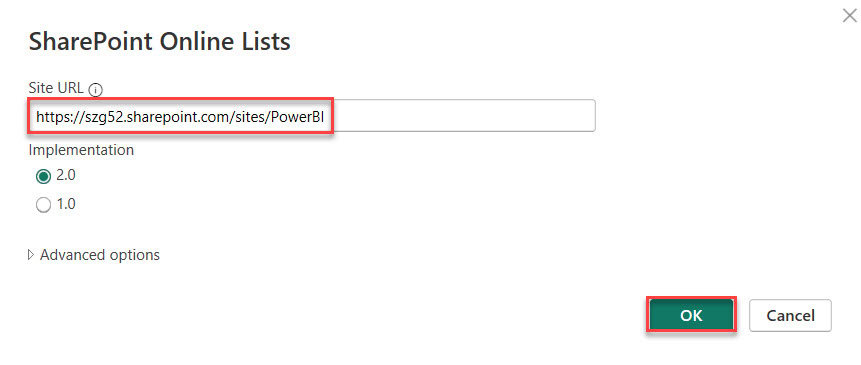
3. A dialog box will appear where you can type the URL of your SharePoint site. Then, click ‘OK‘, as shown below. If this is your first time creating the report, you might need to enter credentials that have access to the SharePoint online list or site.
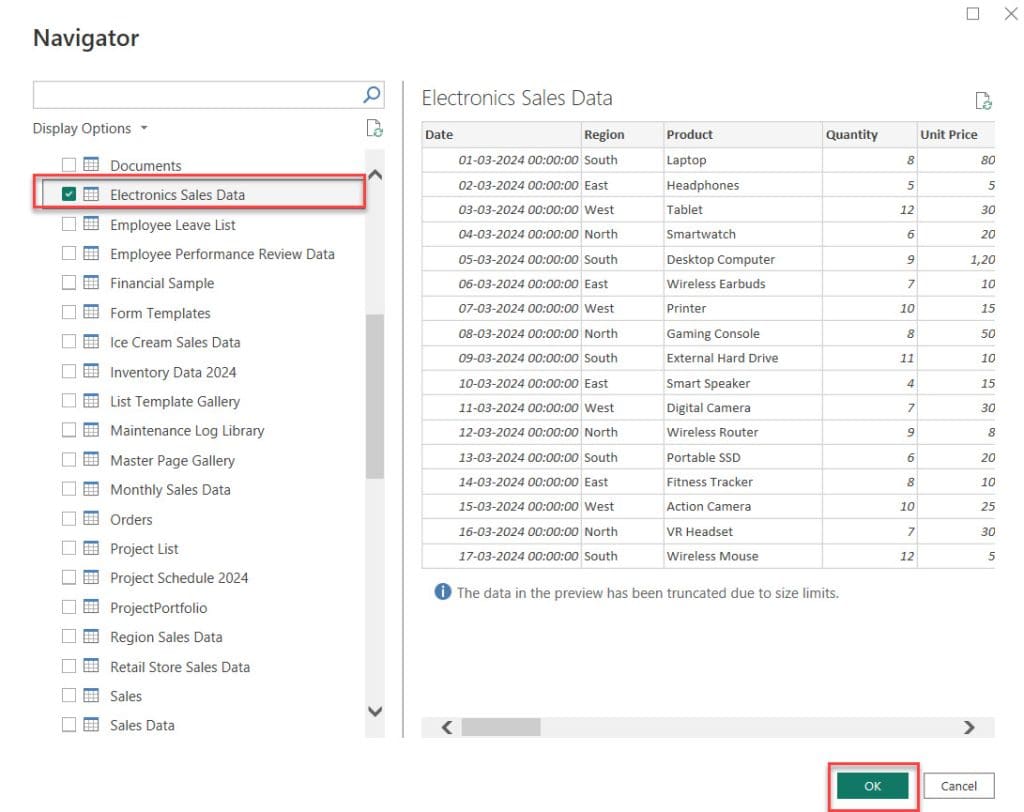
4. After that, it will display all the lists and libraries on the SharePoint site. Select the list you want to use in this Power BI example. Then click on OK.
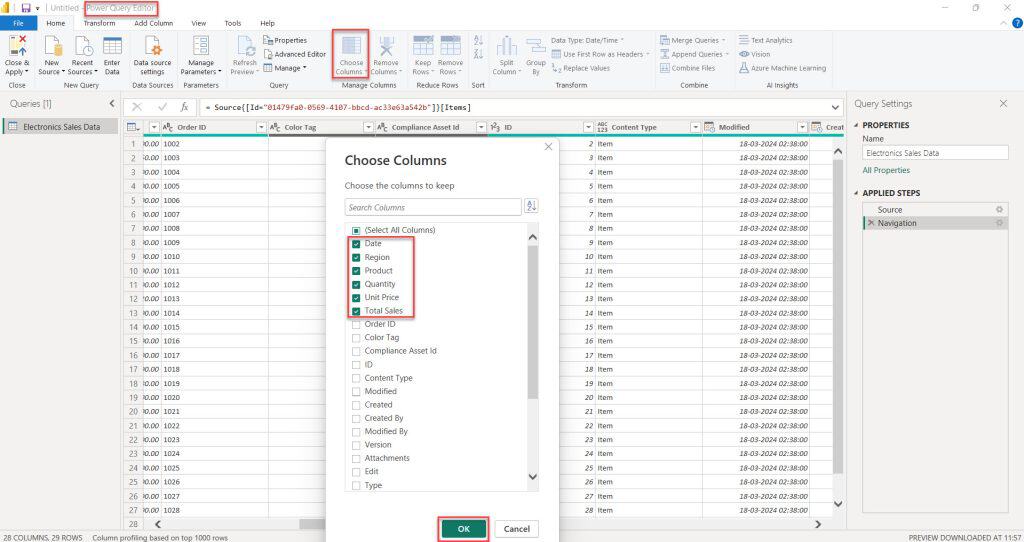
5. You’ll see all the pre-defined columns loaded in the Power Query Editor. Here, we need to choose which column to use in this example. We do this by selecting ‘Choose Column‘ and then clicking ‘OK‘.
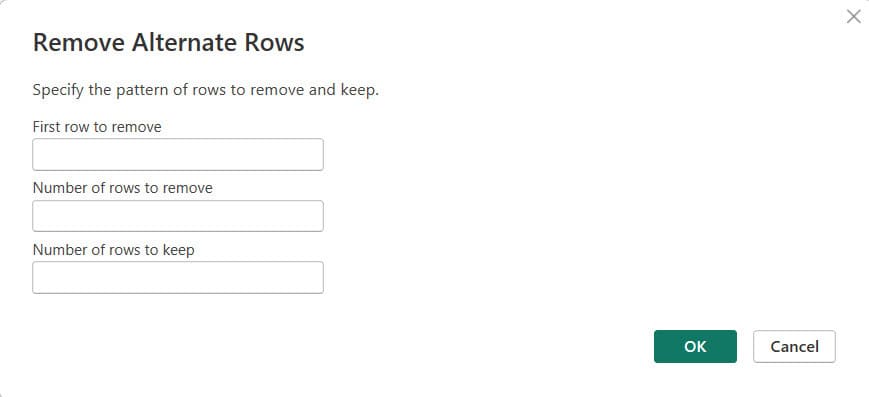
6. Next, under the Home tab, expand the Remove Rows menu and click on Remove Alternate Rows to delete every other row.

Then you see a dialog box called Remove Alternate Rows will pop up. Here, three fields will appear for you to fill out. Such as:
- First row to remove = Where you put the row number of the first row you want to delete.
- Number of rows to remove = Where you specify how many rows to delete each time.
- Number of rows to keep = Where you specify how many rows you want to keep untouched.
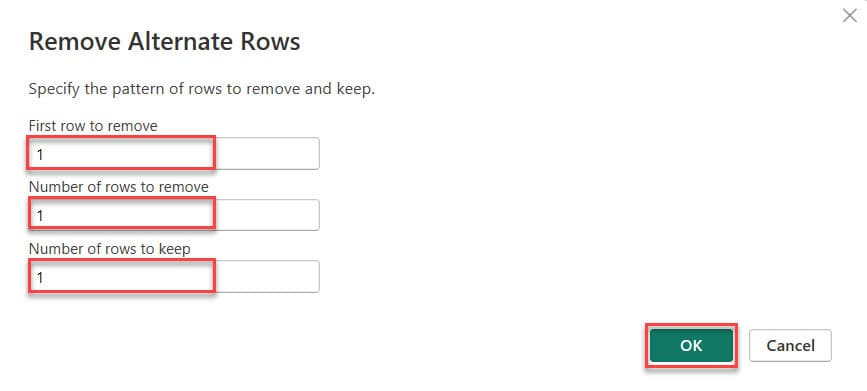
7. To display only sales from even-numbered dates, input the following values in the dialog box:
- First row to remove: 1
- Number of rows to remove: 1
- Number of rows to keep: 1
Then, click OK.
8. Now, in the Power Query Editor, you’ll only see sales data from even-numbered dates.
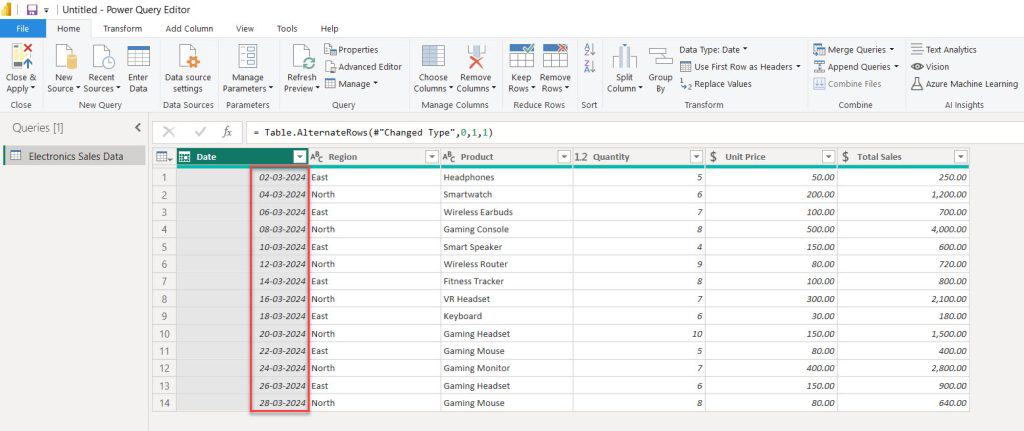
By using the above steps, you can remove alternate rows in Power Query Editor.
How to Remove a Specific Row in Power Query Editor
In this example, I will show you how we can remove a specific row in Power Query Editor.
Here, we have a SharePoint list (Super Store) that contains below columns with various data types:
| Columns | Data Types |
|---|---|
| Month | Single line of text |
| Product Category | Single line of text |
| Sales Amount | Currency |
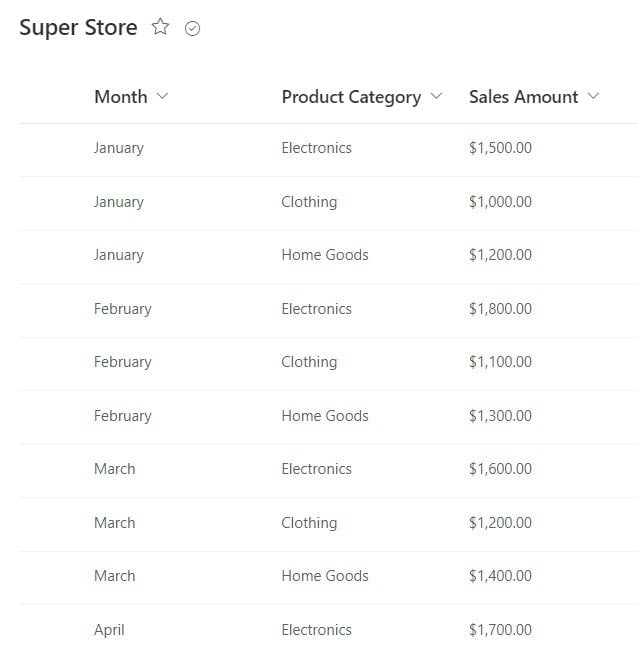
Now follow the below steps to remove a specific row in Power Query Editor:
1. Open Power Query Editor and load the above SharePoint List.
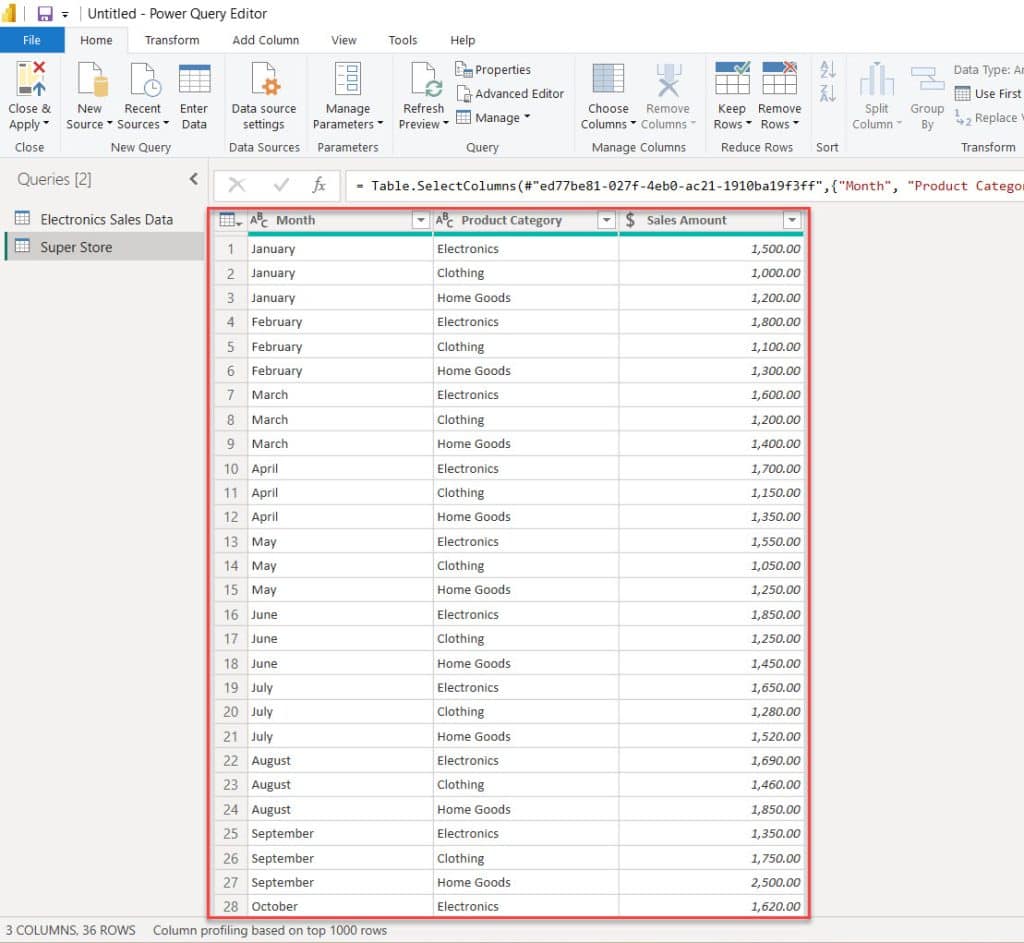
I want to delete just the 11th row in this dataset. It refers to sales of clothing products in April, totaling 1150.
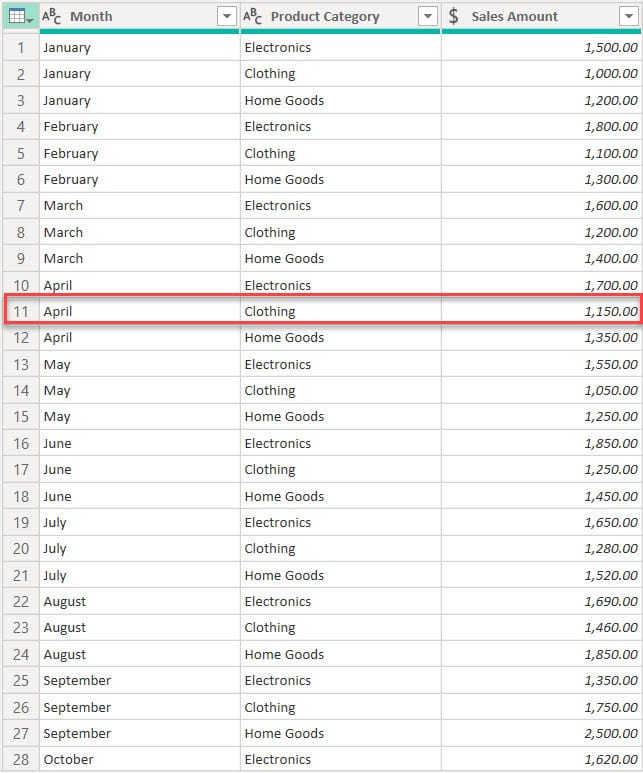
2. Next, under the Home tab, expand the Remove Rows menu and click on Remove Alternate Rows to delete every other row.

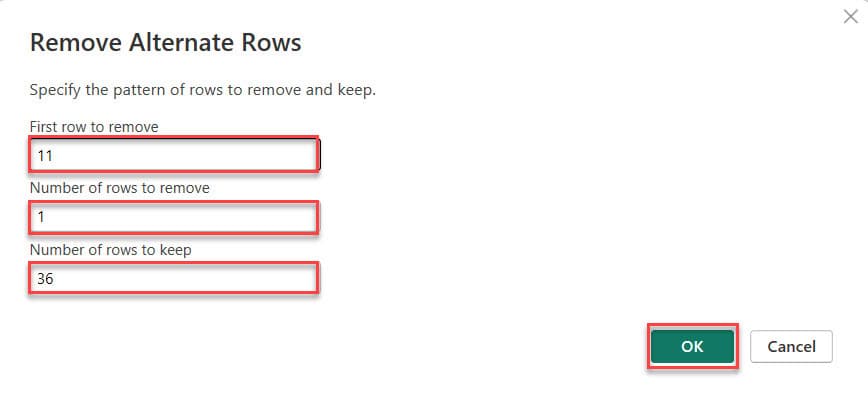
3. To remove the 11th row, input the following values in the dialog box:
- First row to remove: 11
- Number of rows to remove: 1
- Number of rows to keep: 36 (Total number of rows present in the data set)
Then, click OK
4. Now you can see in the Power Query Editor 11th row(sales of clothing products in April, totaling 1150) removed.
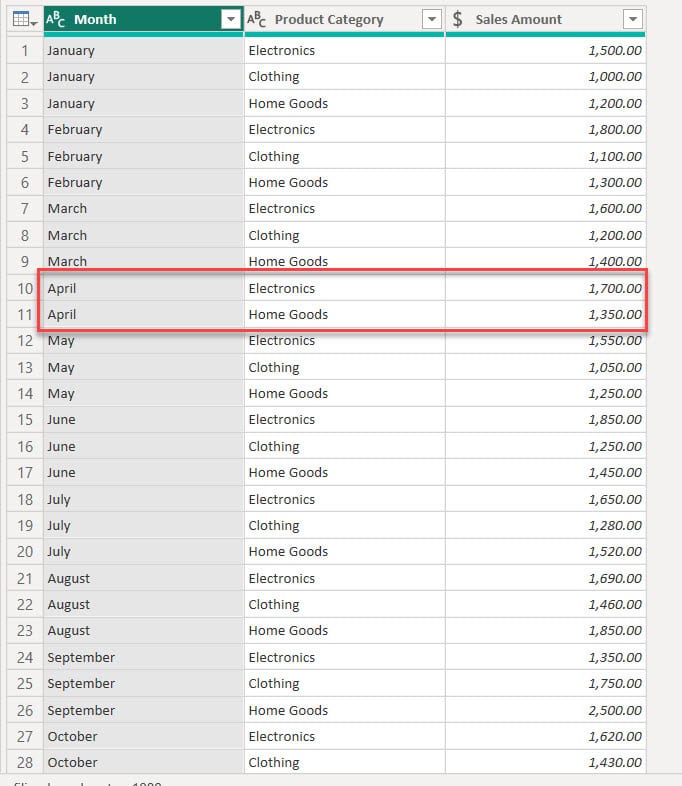
This way, you can remove any specific row in the Power Query Editor.
Power Query Remove Rows Based on Condition
In this example, we will learn how to remove based on conditions in Power Query Editor.
Imagine you’re managing a store website. You have a list of products, but you only want to show products that are available. So, you need to remove any rows where the quantity of a product is zero from your dataset.
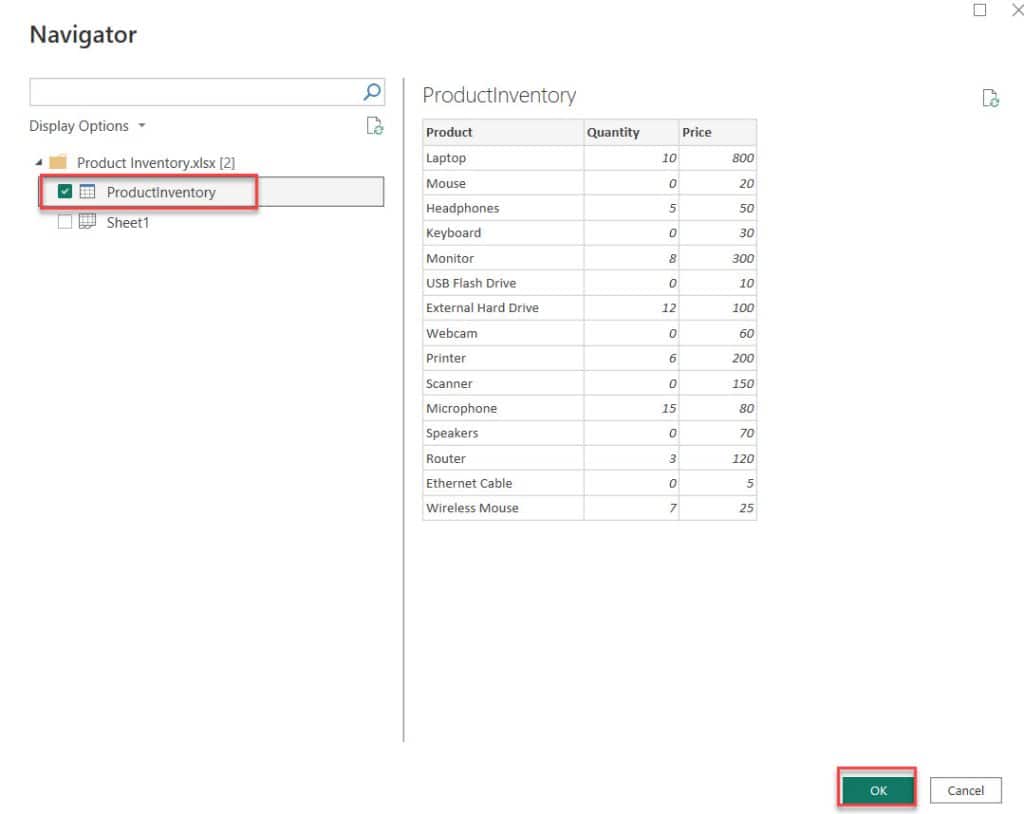
We have an Excel file called ‘Product Inventory‘ with columns for Product, Quantity, and Price.
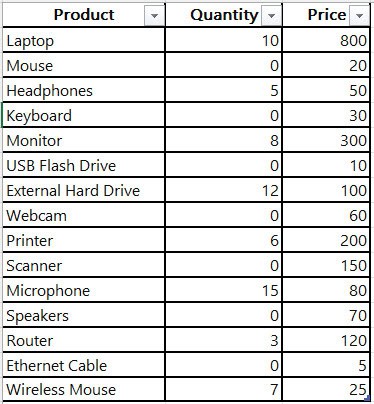
Now follow the below steps:
1. Open Power BI Desktop, then under the Home tab, click Transform data.

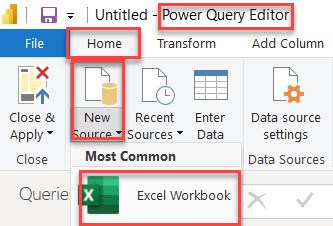
2. In the Power Query Editor, go to the Home tab, then click on ‘New Source,’ and select ‘Excel Workbook‘.
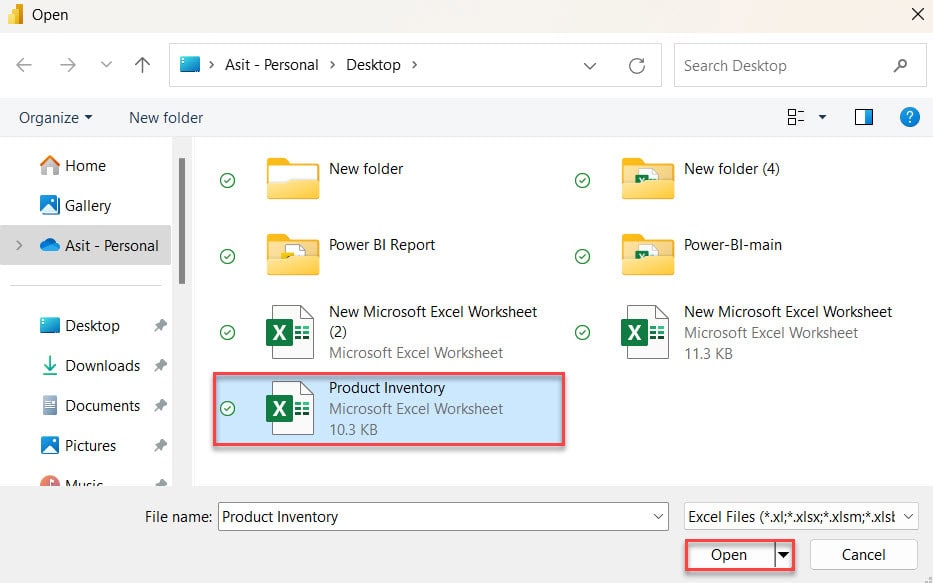
3. This will ask you to browse an Excel file. Here, select the Excel file and click on Open.
4. After that, it will show all the tables in the Excel file you made. Choose the table you want for this example, then click ‘OK‘.
5. Then, under the Home tab, click Advanced Editor.

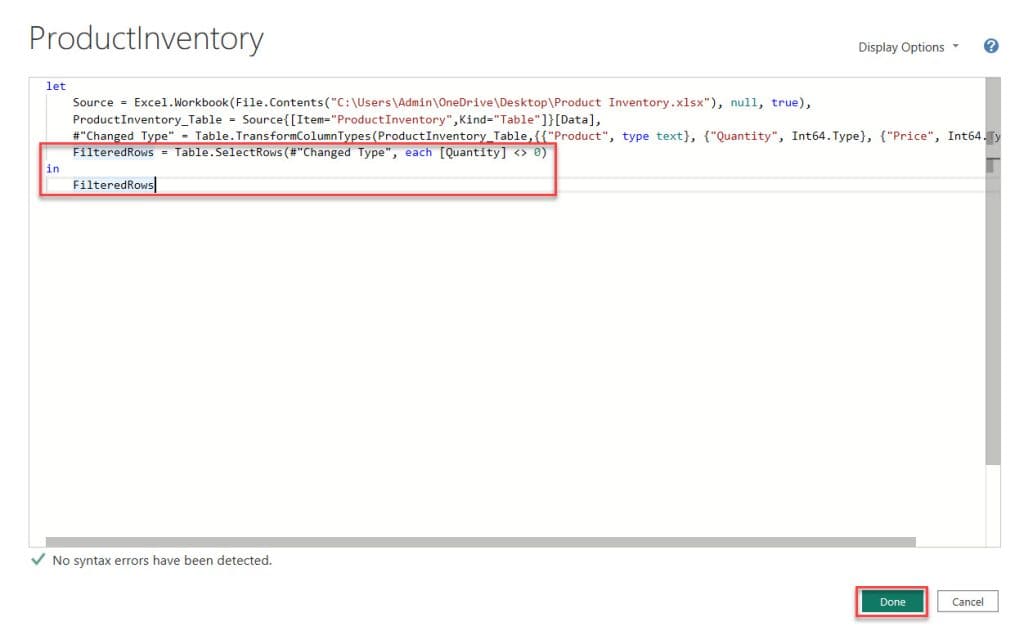
6. Then, put the below m query code(highlighted one) in the advanced editor. Then click Done.
let
    Source = Excel.Workbook(File.Contents("C:\Users\Admin\OneDrive\Desktop\Product Inventory.xlsx"), null, true),
    ProductInventory_Table = Source{[Item="ProductInventory",Kind="Table"]}[Data],
    #"Changed Type" = Table.TransformColumnTypes(ProductInventory_Table,{{"Product", type text}, {"Quantity", Int64.Type}, {"Price", Int64.Type}}),
    FilteredRows = Table.SelectRows(#"Changed Type", each [Quantity] <> 0)
in
    FilteredRows
Where:
- FilteredRows = We’re creating a new table named “FilteredRows” to store our filtered data.
- Table.SelectRows() = This function selects rows from a table based on certain conditions.
- #”Changed Type” = We’re applying the selection to a table called “Changed Type”.
- each [Quantity] <> 0 = For each row in the table, we’re checking if the value in the “Quantity” column is not equal to zero.
- in = Indicates the end of the filtering operation and the start of the output.
- FilteredRows = This is what we’re outputting, which is the table containing only the rows where the Quantity column isn’t zero.
7. Once we filtered out the rows with zero quantities, our data set looks like this.
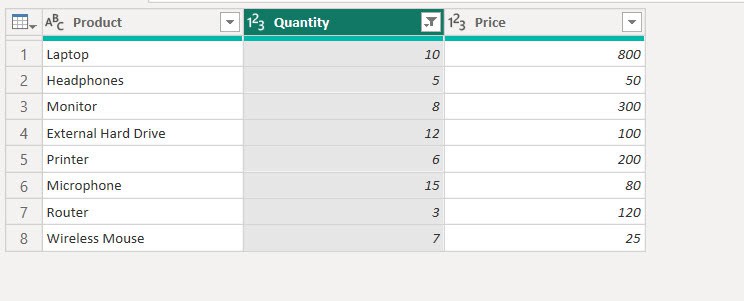
This way you can remove rows based on condition in Power Query Editor.
Remove Top Rows in Power Query
In this example, we will see how we can remove the top row in Power Query Editor.
Here, we have an Excel file named Product Inventory, shown in the screenshot below.
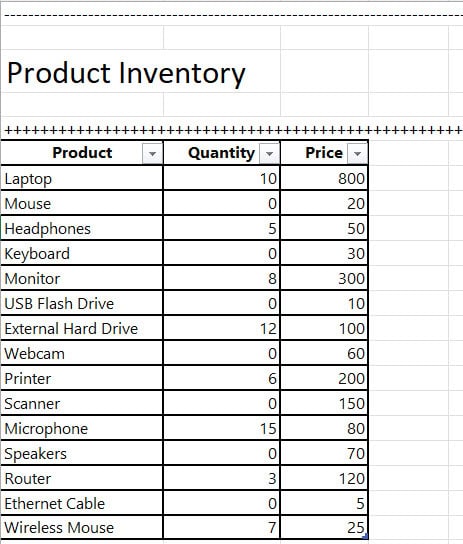
Here, you can see at the top of the table some unwanted rows in this example we remove with the help of Power Query Editor.
1. Open Power Query Editor and load the above Excel file.
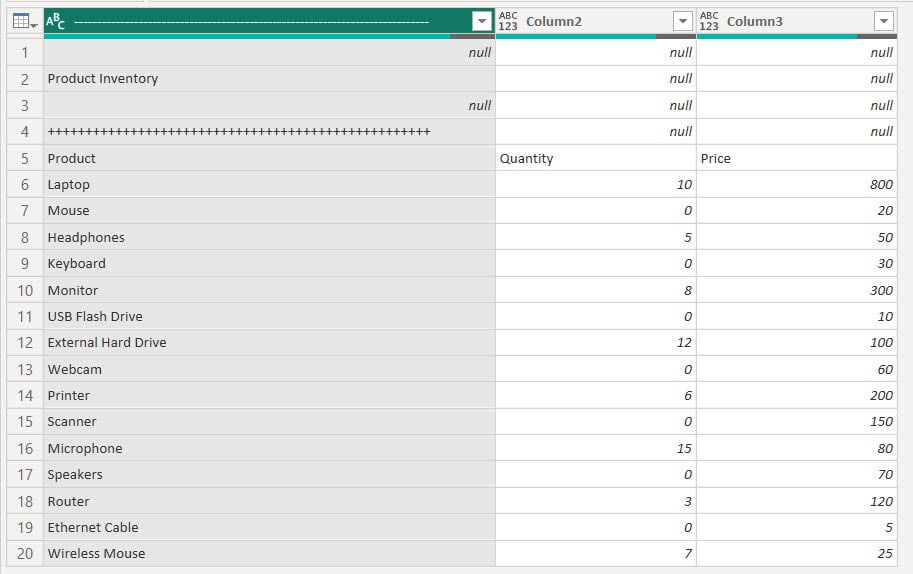
2. Next, under the Home tab, expand the Remove Rows menu and click on Remove Top Rows.

3. Then, you see the ‘Remove Top Rows‘ pop-up window. Enter the Number of rows as ‘4‘ because we don’t need the first 4 rows of data. Then click OK.
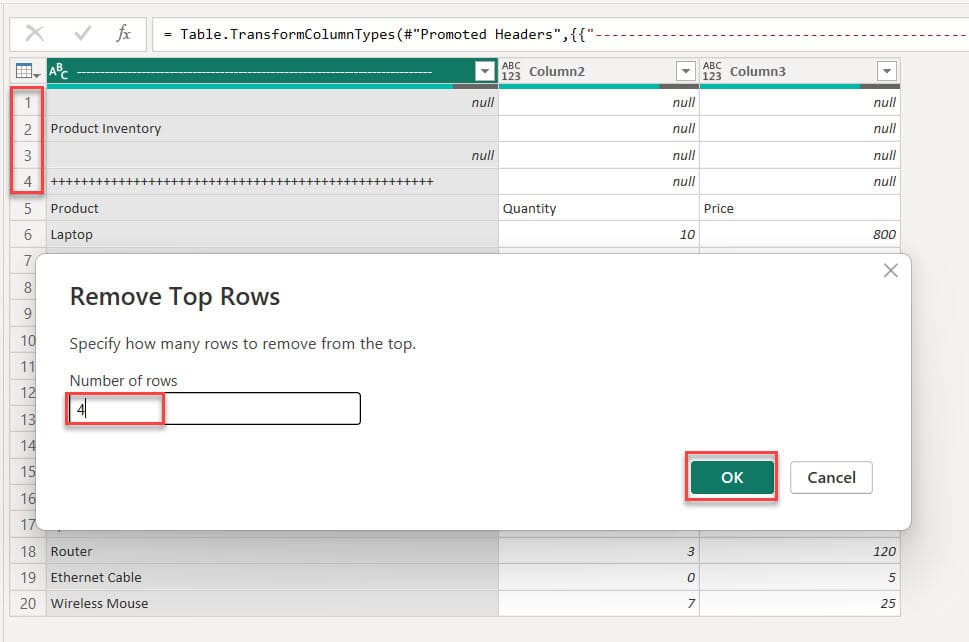
4. After that, you can see the top 4 rows removed successfully.
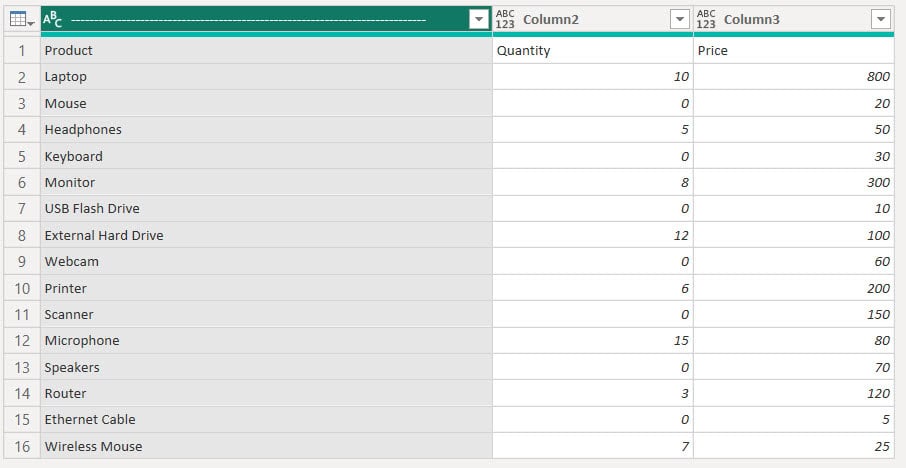
This way, you can remove the top row in Power Query Editor.
How To Make First Row as Header in Power BI?
For this example, we’ll use the dataset mentioned earlier, assuming you’ve already removed the top rows.
Now follow the below steps to make the first row as header:
1. Under the Home tab, click Use First Row as Headers.

2. Then, you see our data set in the first row as a header.

This you can make the first row a header in Power BI.
Power Query Remove Rows Based on Multiple Conditions
You’re managing a voter database for a local election (New York) in the USA. Your dataset includes information about registered voters, such as their Voter ID and city.
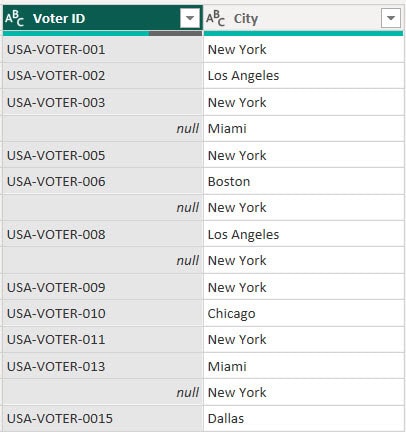
However, you need to clean up the data before election day to ensure accuracy and compliance with regulations. Specifically, you want to remove records for voters without a Voter ID and those who reside within New York.
Now follow the below steps to do this:
1. Open Power Query Editor and load the above data set.
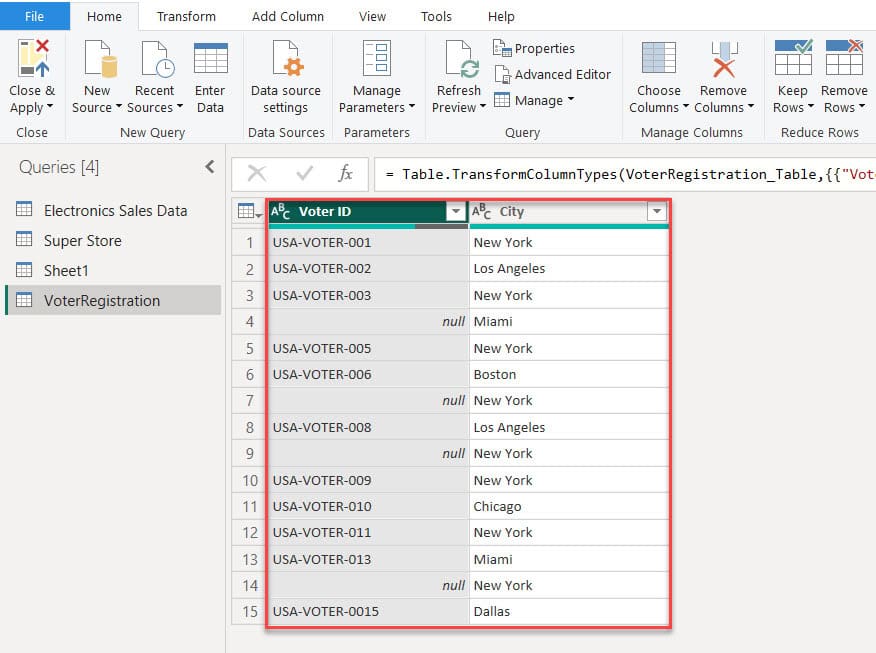
2. Then, under the Home tab, click Advanced Editor.

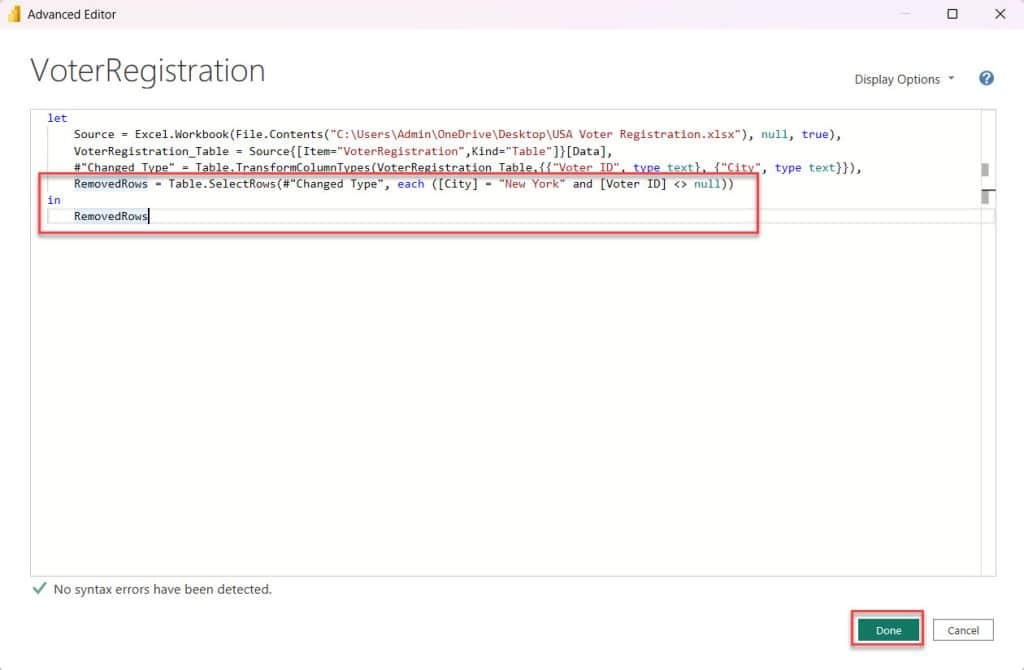
3. Then, put the below m query code(highlighted one) in the advanced editor. Then click Done.
let
    Source = Excel.Workbook(File.Contents("C:\Users\Admin\OneDrive\Desktop\USA Voter Registration.xlsx"), null, true),
    VoterRegistration_Table = Source{[Item="VoterRegistration",Kind="Table"]}[Data],
    #"Changed Type" = Table.TransformColumnTypes(VoterRegistration_Table,{{"Voter ID", type text}, {"City", type text}}),
    RemovedRows = Table.SelectRows(#"Changed Type", each ([City] = "New York" and [Voter ID] <> null))
in
    RemovedRows
Where:
- Removed Rows = This line initializes a new variable called RemovedRows.
- Table.SelectRows() = This part indicates that we’re selecting specific rows from a table.
- #”Changed Type” = We’re applying the selection to a table called “Changed Type”.
- each ([City] = “New York” and [Voter ID] <> null) = This indicates that we’re going to apply a condition to each row where the City column is “New York” and the Voter ID column is not empty.
- in = Indicates the end of the filtering operation and the start of the output.
- Removed Rows = This assigns the selected rows that meet the condition to the RemovedRows variable.
4. Then you can see only the City column is “New York,” and the Voter ID column is not an empty data set.
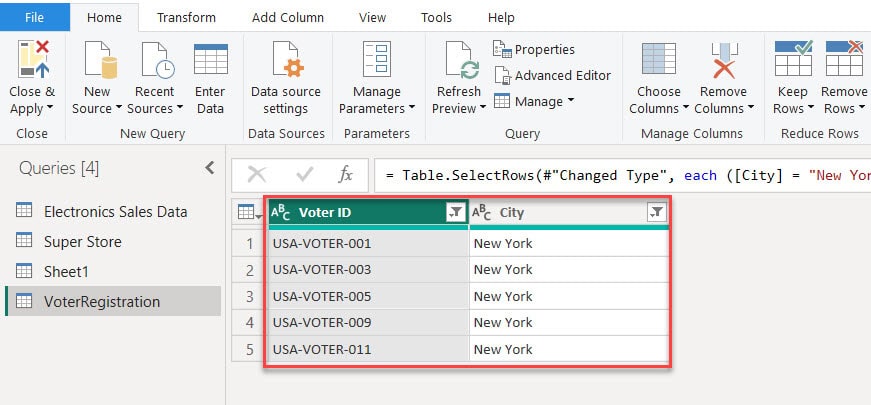
This way, you can remove rows in Power Query based on multiple conditions.
Power Query Remove Blank Rows
In this example, we see how to remove blank rows in Power Query Editor.
Imagine you have a customer feedback table. Each row represents a piece of feedback, with columns for things like the customer’s name, the date of the feedback, and the feedback itself. However, sometimes there are rows where no feedback was provided, leaving blank spaces.
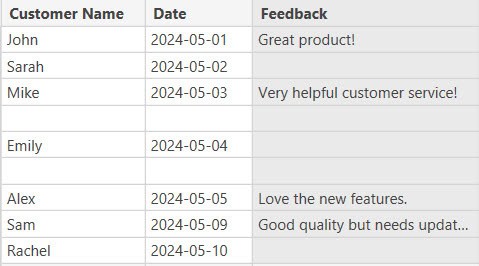
Now follow the below steps:
1. Open Power Query Editor and load the above table.
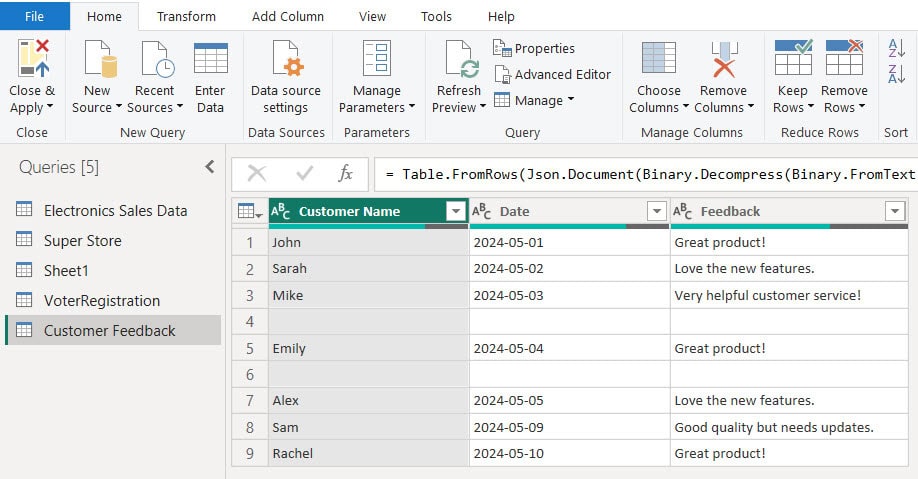
2. Under the Home tab, expand the Remove Rows menu and click on Remove Blank Rows.

3. Then, you can see all blank rows removed in Power Query Editor.

This way, you can remove blank rows in Power Query Editor.
Remove Duplicate Rows in Power Query
In this example, we will see how we can remove duplicate rows in Power Query Editor.
I have a dataset with columns for Product Name, Sales, Quantity, Customer Name, Customer Location, and Order Date. I’ve already loaded it into the Power Query Editor.

Now follow the below steps:
1. Click and hold the Ctrl key, then click on each column in the sales table. After that, go to the Home tab and click on ‘Remove Rows‘. Finally, select ‘Remove Duplicates‘.
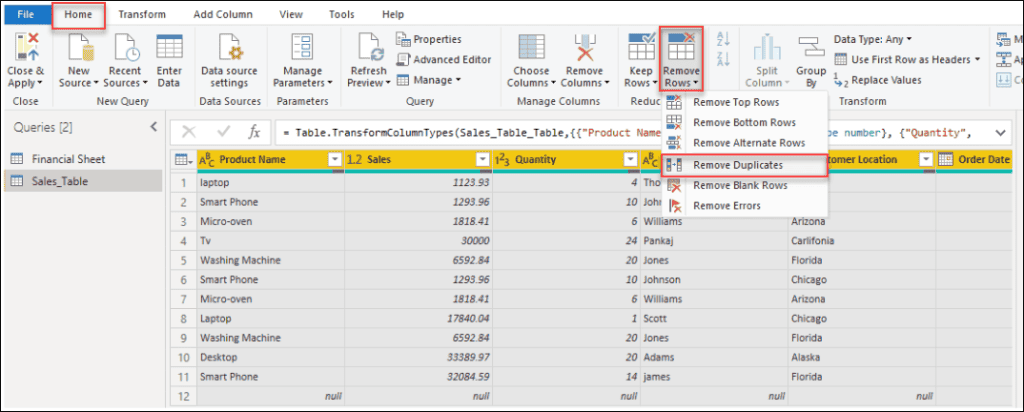
2. Now, you’ll notice that the duplicate rows have been removed from the sales table.

This way, you can remove duplicate rows in Power Query Editor.
Additionally, you may like some more articles:
- Power Query Date Functions
- Power Query Create Table in Power BI
- Power BI Sum Multiple Columns
- Power BI Divide Two Columns
- How to Add Conditional Column in Power BI
- Power BI Split Column by Text Contains
If you want to remove duplicate values in a column, follow the same steps, but this time, select the column where the duplicate values are located.
In this tutorial, we explored various methods for row removal in Power Query, including removing specific rows, eliminating top rows, setting the first row as a header, and removing rows based on conditions or blank values.
We also covered removing alternate rows and duplicates, both single and multiple. By mastering these techniques, you can efficiently clean and streamline your data in Power BI.
I am Bijay a Microsoft MVP (10 times – My MVP Profile) in SharePoint and have more than 17 years of expertise in SharePoint Online Office 365, SharePoint subscription edition, and SharePoint 2019/2016/2013. Currently working in my own venture TSInfo Technologies a SharePoint development, consulting, and training company. I also run the popular SharePoint website EnjoySharePoint.com
I enjoy your training but you don’t include exercises files for one to try.