When using Power BI, you might encounter a situation where you need to apply an IF condition with dates or Power BI IF Date. What will happen then?
In this tutorial, we will see how to work with the Power BI if statement with dates and Power BI if date is between two dates then return value.
Also, we will see the topics below:
- Power BI if the date is greater than the specific date
- Power Query if date greater than
- Power BI if dates between
Power BI IF Date is Greater than Specific Date
Let’s consider a scenario where we can use Power BI if the date is greater than the specific date.
Scenario:
Let’s say you manage a store. Every year, on November 29th, your store has a big sale event on Black Friday. You want to see how sales of certain products compare before and after Black Friday.
According to this scenario, we have a SharePoint list named Product Sales that contains the following columns with various data types:
| Columns | Data Types |
|---|---|
| Product | Single line of text |
| Sale Date | Data and time |
| Sale Amount | Currency |
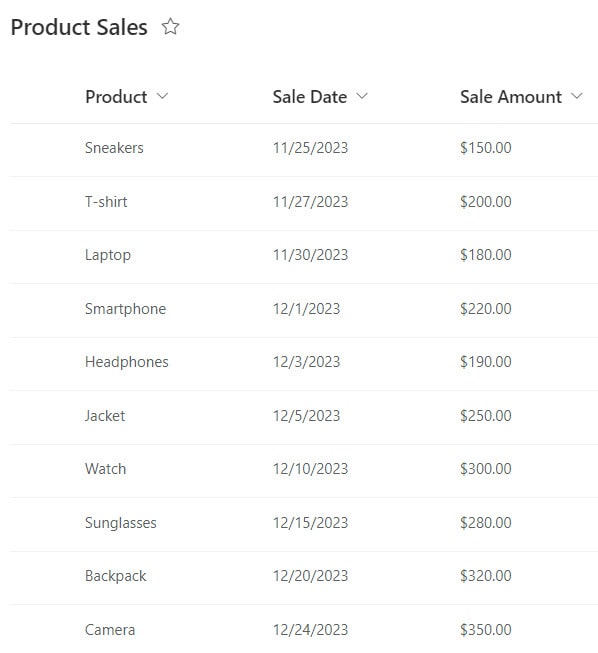
Now follow the below steps:
1. Open Power BI Desktop and load the data. Then, in the Data Panel, you can see the data set.
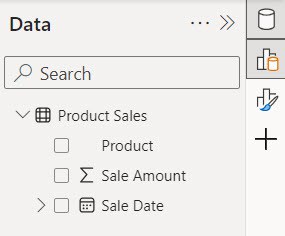
2. Under the Modeling tab, click the “New column.“

3. Then, in the formula bar, put below the DAX expression.
Black Friday Sales =
IF('Product Sales'[Sale Date] > DATE(2023, 11, 29), "After Black Friday", "Before Black Friday")
Where:
- Black Friday Sales = This assigns the name “Black Friday Sales” to the calculated column.
- IF() = It’s a function that evaluates a condition and returns one value if it’s true and another if it’s false.
- ‘Product Sales'[Sale Date] > DATE(2023, 11, 29) = This part compares the date in the ‘Sale Date’ column with Black Friday in 2023 (November 29th).
- “After Black Friday” = If the sale date is after November 29, 2023, it labels it as “After Black Friday”.
- “Before Black Friday” = If the sale date is on or before November 29, 2023, it labels it as “Before Black Friday”.

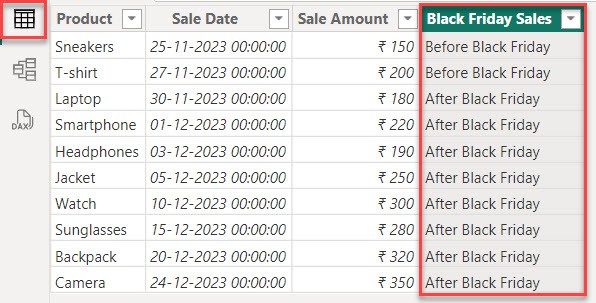
4. When you go to the table view you can see a Black Friday Sales column created.
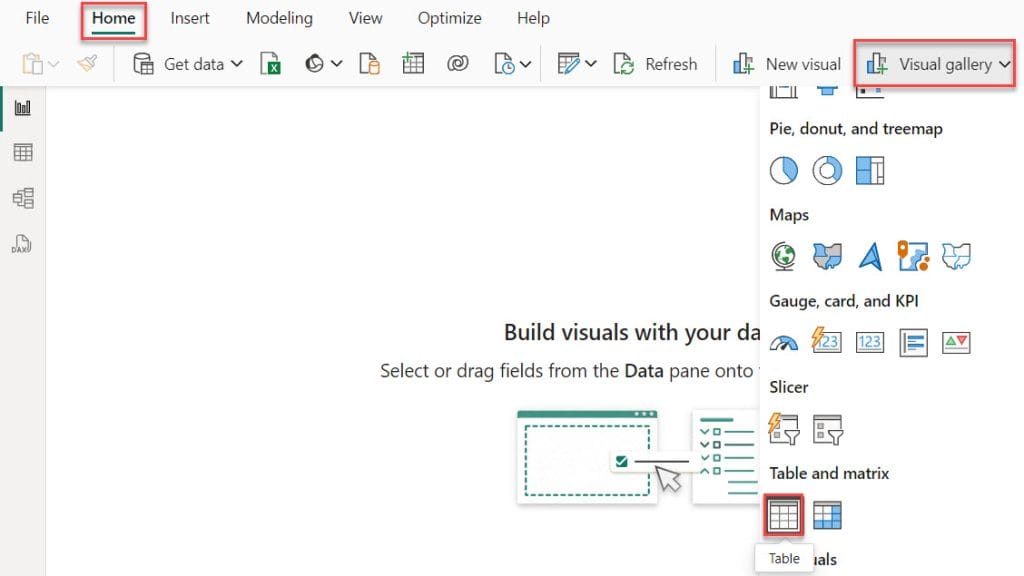
5. After that, in the Report view, select Visual gallery -> click table.
6. Then, using +Add data, add Product and Sale Amount in the Columns field.
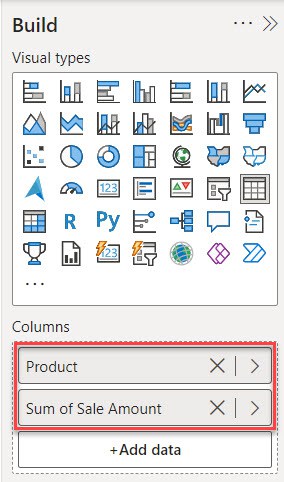
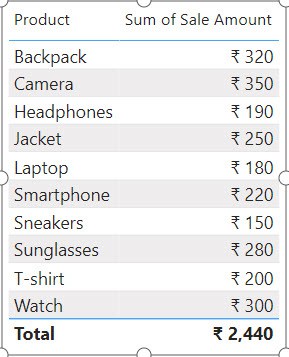
7. Now, you can see the table created in the Report view.
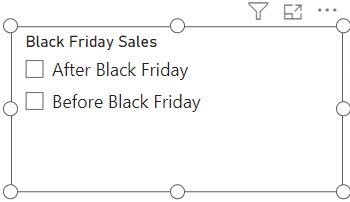
8. Then, create a slicer visual using the Black Friday Sales column.
9. Using this slicer, you can quickly see which products performed better before or after Black Friday. This information can help you make decisions for the next Black Friday sale.
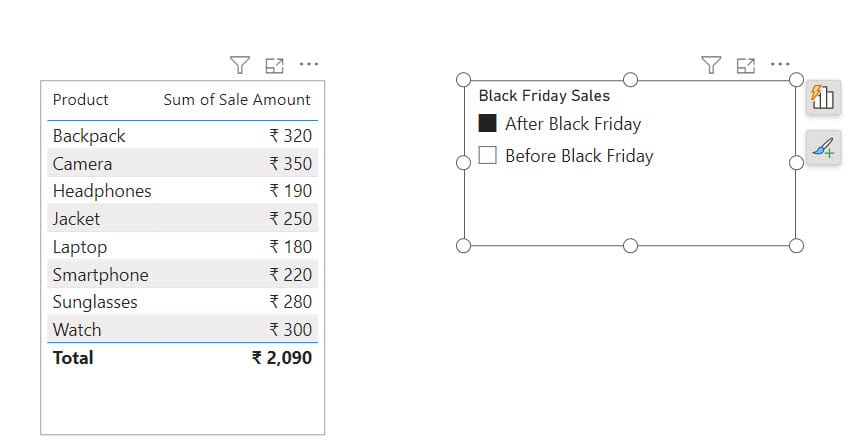
This Power BI scenario helps you to analyze sales performance based on specific dates and make data-driven decisions for your business.
Power BI IF Date is Between Two Dates then Return Value
Let’s consider a scenario where we can use Power BI if the date is between two dates’ return values.
Scenario:
Imagine you manage a subscription-based online service and want to offer discounts to customers based on their subscription renewal dates.
You want to identify customers whose renewal dates fall within a specific promotional period and apply the discount accordingly.
Example:
Let’s say you’re running a promotion for the month of April, offering a 20% discount to customers whose subscription renewal dates fall between April 1st and April 31st.
I have a dataset containing information about Customer ID, Renewal Date, and Subscription Amount (USD).
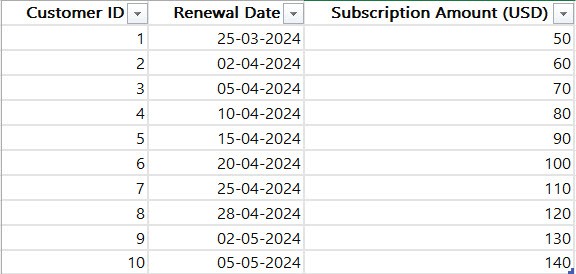
Follow the below steps;
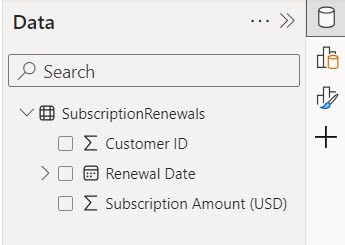
1. Open Power BI Desktop and load the data. Then, in the Data Panel, you can see the data set.
2. Under the Modeling tab, click the “New column.“

3. Then, in the formula bar, put below the DAX expression.
Promotion Discount =
IF(AND('SubscriptionRenewals'[Renewal Date] >= DATE(Year(TODAY()), 04, 1), 'SubscriptionRenewals'[Renewal Date] <= DATE(Year(TODAY()), 04, 31)), 0.2, 0)
Where:
- Promotion Discount = This assigns a “Promotion Discount” to the calculated column.
- IF() = This is a function that checks a condition and returns one value if it’s true and another if it’s false.
- AND() = It’s a logical function that allows you to check if multiple conditions are true at the same time.
- ‘SubscriptionRenewals'[Renewal Date] >= DATE(Year(TODAY()), 04, 1) = It checks if the renewal date in the ‘SubscriptionRenewals’ table is on or after April 1st of the current year.
- ‘SubscriptionRenewals'[Renewal Date] <= DATE(Year(TODAY()), 04, 31) = It checks if the renewal date in the ‘SubscriptionRenewals’ table is on or before April 31st of the current year (assuming April has 30 days).
- 0.2 = If both conditions are true (the renewal date is in April), it gives a discount of 20% (0.2).
- 0 = If the conditions are unmet (the renewal date is not in April), no discount is given (0).

4. When you go to the table view you can see a Promotion Discount column created.
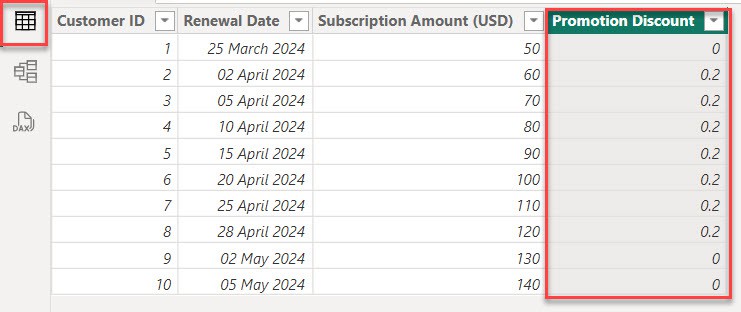
5. Under the “Colum tools,” click the percentage symbol.

6. Now, you can see the Promotion Discount as a percentage in the table view.
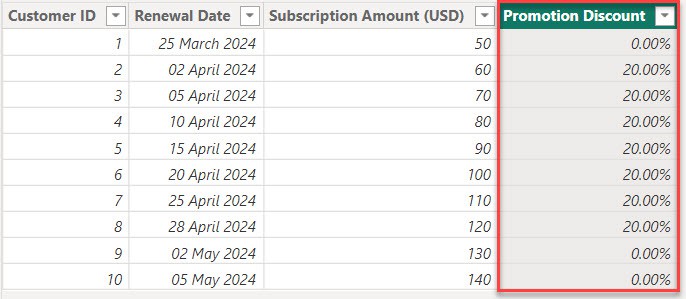
After that, with the help of the Promotion Discount column, you can give a discount.
Power Query IF Date Greater than
Imagine you’re managing a project schedule for a construction company. You want to highlight overdue tasks based on their due dates so you can prioritize them for immediate attention.
Let’s say you have a project schedule in Excel with a list of tasks and their respective due dates.
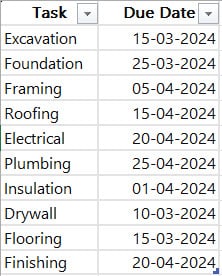
You want to add a column that tasks as overdue if their due dates have passed.
Follow the below steps:
1. Open Power BI Desktop and load the data. Then, in the Data Panel, you can see the data set.
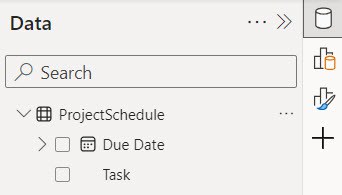
2. Under the Home tab, click Transform data.

3. In the Power Query Editor, under the Add Column tab, click Custom column.

4. In the Custom Column, give the New column name as Overdue and put the below M query expression. Then click OK.
if [Due Date] < Date.From(DateTime.LocalNow()) then "Yes" else "No"Where:
- if [Due Date] < Date.From(DateTime.LocalNow()) = This part checks if the value in the “Due Date” column is earlier than the current date and time.
- then “Yes” = If the due date is in the past, it returns “Yes”.
- else “No” = If the due date is not in the past, it returns “No.”
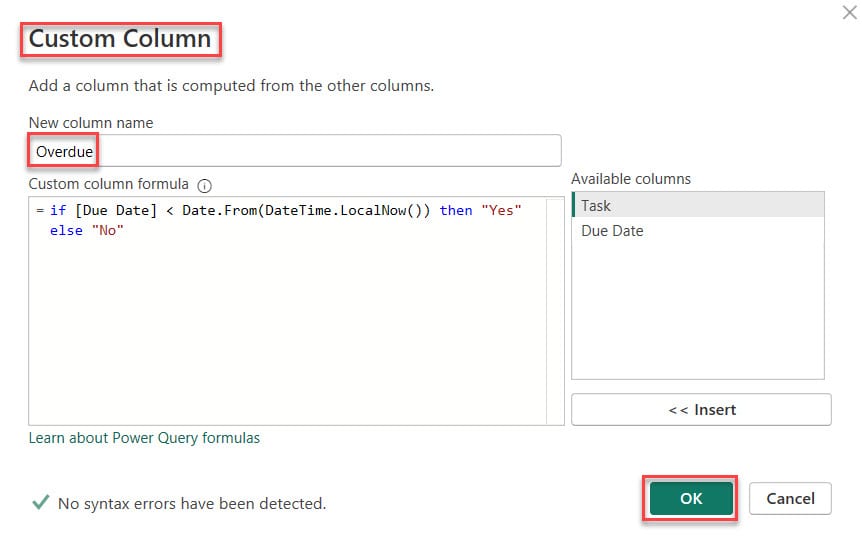
5. Now, you can see one Overdue column added in the Power Query Editor.

This way, you can use Power Query if the date is greater than in Power BI.
Power BI IF Dates between
In Power BI, DATESBETWEEN() is a time intelligence function. It gives you a table with a list of dates starting from a specific start date and ending at a specific end date.
The syntax for this function is:
DATESBETWEEN(<Dates>, <StartDate>, <EndDate>)Where:
- <Dates> = This column or table contains the dates you want to filter.
- <StartDate> = This is the starting date of the range you want to filter.
- <EndDate> = This is the ending date of the range you want to filter.
Let’s say you have a table named “Sales” with two columns: “Date” and “Amount.”
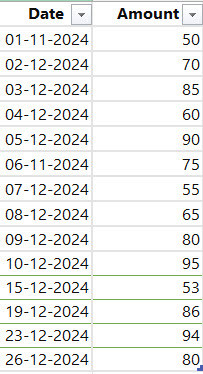
You want to see how your sales performed between December 1st and December 15th.
Now follow the below steps:
1. Open Power BI Desktop and load the data. Then, in the Data Panel, you can see the data set.
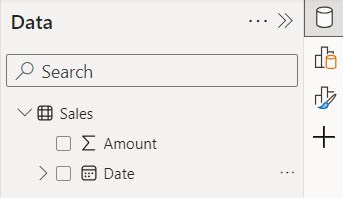
2. Under the Home tab, click “New measure“.

3. Then, in the formula bar, put below the DAX expression.
TotalSalesDec1to15 =
CALCULATE(
    SUM(Sales[Amount]),
    DATESBETWEEN(Sales[Date], DATE(2024, 12, 1), DATE(2024, 12, 15))
)
Where:
- TotalSalesDec1to15 = This assigns a name “TotalSalesDec1to15” to the measure being created.
- CALCULATE() = This function modifies the context in which the expression is evaluated, applying additional filters or calculations.
- SUM(Sales[Amount]) = This calculates the sum of the “Amount” column from the “Sales” table.
- DATESBETWEEN(Sales[Date], DATE(2024, 12, 1), DATE(2024, 12, 15)) = This filters the dates in the “Date” column of the “Sales” table to be between December 1st, 2024 and December 15th, 2024, and applies this filter to the SUM calculation.
4. Now, using card visuals, you can see the total sales amount on December 1st, 2024, and December 15th, 2024.
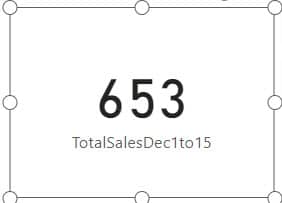
This way, you can use Power BI if dates between.
Also, you may like:
- What if parameter Power BI Date
- Power BI date slicer between a default to today
- Switch in Power BI
- Power BI Slicer Sort Descending
- Power Query Create Table in Power BI
- Power BI Power Query Examples
In this tutorial, we explored how to use IF statements with dates in Power BI. We learned how to check if a date is greater than a specific date, how to use Power Query to perform conditional logic for dates, and how to determine if a date falls between two specific dates.
I am Bijay a Microsoft MVP (10 times – My MVP Profile) in SharePoint and have more than 17 years of expertise in SharePoint Online Office 365, SharePoint subscription edition, and SharePoint 2019/2016/2013. Currently working in my own venture TSInfo Technologies a SharePoint development, consulting, and training company. I also run the popular SharePoint website EnjoySharePoint.com
Hi Bijay Kumar – Thank you for this content, super helpful! Do you know how could I limit in Power Query to show data just until last month? For example, imagine we are in August, we add data until Jul-31 and as well the 1st day of August, but I wanted to show only the last day of the previous month (i.e.: July-31?) Thank you!