When we discuss Power BI logical functions, we usually start with the IF function. But there is a problem: the IF function becomes more complex if we have multiple conditions. That’s where the Power BI Switch function comes in handy.
In this tutorial, we will discuss the Switch function in Power BI and the switch syntax in Power BI.
Also, we will see the topics below:
- Switch function in Power BI with examples
- Power BI switch statement with text
- Switch condition in Power BI
- Power BI DAX switch format
Switch in Power BI
The Power BI Switch function is like that of a decision maker. It evaluates an expression and, based on its result, chooses one of several possible outcomes. This is a handy way to create conditional logic without nesting a bunch of IF statements.
So, you give Switch a condition to check and tell it what to do if the condition is true and what to do if it’s false.

Switch Syntax in Power BI
This below represents the switch Power BI syntax:
Syntax:
SWITCH(<expression>, <value>, <result>[, <value>, <result>]…[, <else>])Where:
- <expression> = This is the condition or value you want to evaluate. It could be a column name, a formula, or a value.
- <value> = These are the specific values or conditions you want to compare against the expression.
- <result> = For each value or condition specified, you determine what result you want to return if the expression matches that value.
- <else> =Optionally, you can provide a default result to return if none of the specified values match the expression.
Switch Function in Power BI With Examples
Let’s see how we can use the Power BI Switch statement.
Scenario:
You have a dataset containing product names and their corresponding sales revenue.
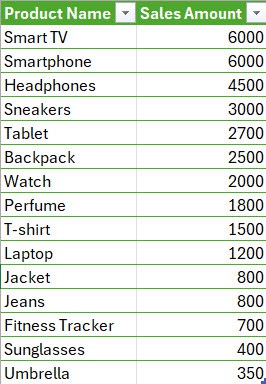
You want to create a new column that categorizes each product into one of three segments based on its revenue: High Sales, Medium Sales, or Low Sales.
Follow the below steps to this:
1. Open Power BI Desktop and load the data. Then, in the Data Panel, you can see the data set.
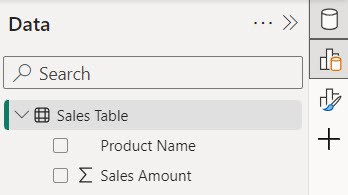
2. Under the Modeling tab, click the “New column “.

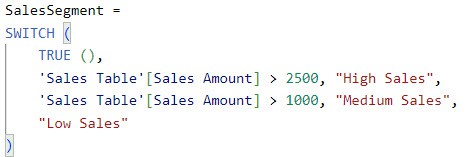
3. Then, in the formula bar, put below the DAX expression.
SalesSegment =
SWITCH (
    TRUE (),
    'Sales Table'[Sales Amount] > 2500, "High Sales",
    'Sales Table'[Sales Amount] > 1000, "Medium Sales",
    "Low Sales"
)
Where:
- SalesSegment = This assigns a name “SalesSegment” to the created column.
- SWITCH()= It’s like a function that checks conditions and returns different results based on those conditions.
- TRUE() = This means we use the SWITCH function and evaluate its conditions.
- ‘Sales Table’ [Sales Amount] > 2500 = It checks if the sales amount in the ‘Sales Table’ is greater than 2500.
- High Sales = If the sales amount is greater than 2500, it labels it as “High Sales.”
- ‘Sales Table’ [Sales Amount] > 1000 = It checks if the sales amount in the ‘Sales Table’ is greater than 1000.
- Medium Sales = If the sales amount is between 1000 and 2500, it is labeled “Medium Sales.”
- Low Sales = If none of the above conditions are met, it labels it as “Low Sales.”
4. When you go to the table view you can see a SalesSegment column created.
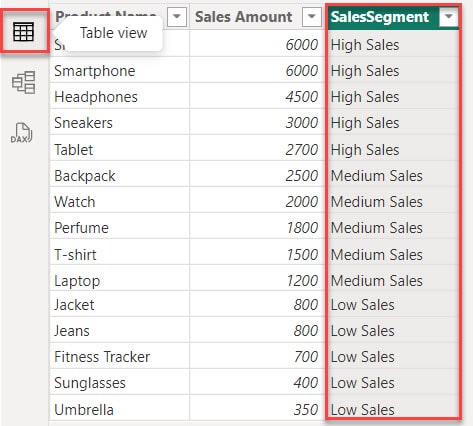
This way, you can create a switch DAX in Power BI.
Power BI Switch Statement With Text
In this example, we see the Power BI Switch statement with text.
Scenario:
Let’s consider you managing a customer support team for an e-commerce platform.
Your team receives various types of customer inquiries, and you want to categorize them into different priority levels for efficient handling.
Example:
I have a dataset containing information about customer inquiries, including the type of inquiry and its urgency level.
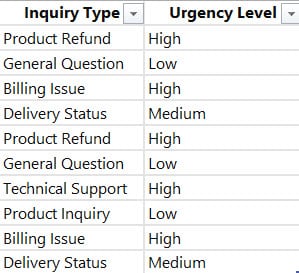
Now, I want to create a new column that categorizes each inquiry into one of three priority levels: “High Priority,” “Medium Priority,” or “Low Priority,” depending on its type.
Now follow the below steps to do this:
1. Open Power BI Desktop and load the data. Then, in the Data Panel, you can see the data set.
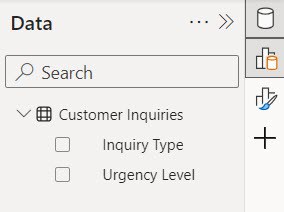
2. Under the Modeling tab, click the “New column “.

3. Then, in the formula bar, put below the DAX expression.
PriorityLevel =
SWITCH (
    TRUE (),
    'Customer Inquiries'[Inquiry Type] = "Product Refund" || 'Customer Inquiries'[Inquiry Type] = "Billing Issue", "High Priority",
    'Customer Inquiries'[Inquiry Type] = "General Question" || 'Customer Inquiries'[Inquiry Type] = "Delivery Status", "Medium Priority",
    "Low Priority"
)
In this Switch, statement:
- If the inquiry is about a product refund or a billing issue, it’s considered “High Priority.”
- If the inquiry is a general question about product features or delivery status, it’s considered “Medium Priority.”
- If the inquiry is a simple request for information or a thank-you message, it’s considered “Low Priority.”

4. When you go to the table view you can see a SalesSegment column created.
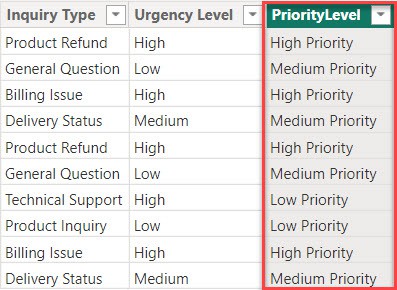
This way, you can create a switch statement Power BI.
Switch Condition in Power BI
Let’s consider you have a dataset containing information about different sales regions and their corresponding sales targets and sales amounts.
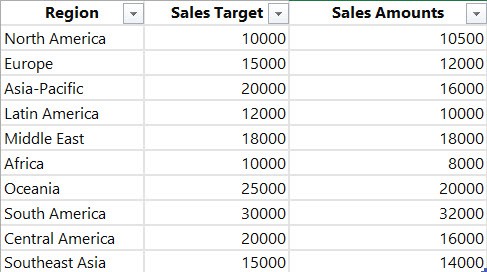
You want to calculate the commission rate for each region based on their performance against their targets. The commission rate will be represented as a percentage.
Now Follow the below steps:
1. Open Power BI Desktop and load the data. Then, in the Data Panel, you can see the data set.
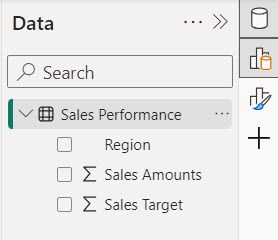
2. Under the Modeling tab, click the “New column “.

3. Then, in the formula bar, put below the DAX expression.
Sales Achievement = 'Sales Performance'[Sales Amounts] / 'Sales Performance'[Sales Target]Where:
- Sales Achievement = Name of the Measure
- Sales Performance = Name of the Table
- Sales Amounts = Name of the Column
- Sales Target = Name of the Column

4. Under the “Modeling” tab and click on “New column,” put the below expression. Then Click the Commit button.
CommissionRate % =
SWITCH (
    TRUE (),
    'Sales Performance'[Sales Achievement] >= 1, 0.5,
    'Sales Performance'[Sales Achievement] >= 0.8 && 'Sales Performance'[Sales Achievement] < 1, 0.3,
    0.1
)
In this Switch, statement:
- If a region achieves 100% or more of its sales target, the commission rate is 0.5.
- The commission rate is 0.3 if a region achieves between 80% and 99% of its sales target.
- If a region achieves less than 80% of its sales target, the commission rate is 0.1.

5. When you go to the table view you can see a CommissionRate % column created.
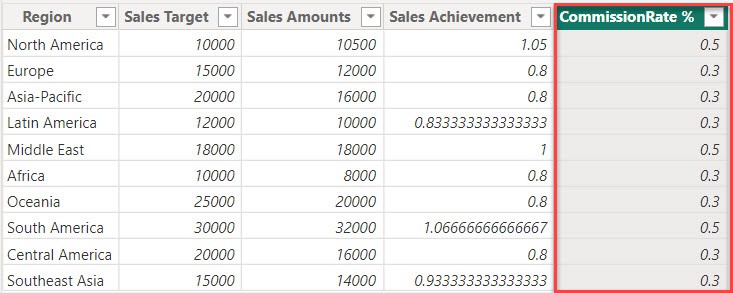
6. Under the “Colum tools,” click the percentage symbol.

7. Now, you can see the commission rate as a percentage in the table view.
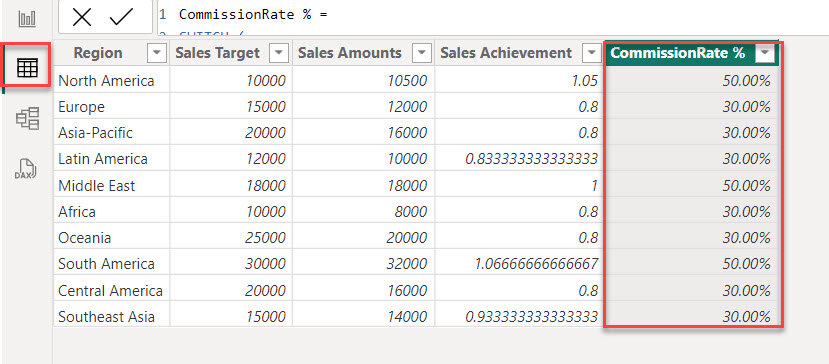
Power BI DAX Switch Format
Now, we see how to use the switch function with the format function in Power BI.
Format() is a really useful function in Power BI DAX. It changes a value into text based on a particular format you choose.
The syntax for this function is:
Format(<value>,<format-string>[,<local name>])- Format () =This is a function in DAX that allows you to format a value based on a specified format string.
- <value> = This is the value you want to format. It could be a number, date, or text.
- <format-string> = This is a special string that tells DAX how to format the value, for example, “#,##0.00” for numbers or “yyyy-mm-dd” for dates.
- <local name> =This is an optional parameter for localization, specifying the language or region for formatting. If not provided, it defaults to the current language and region settings.
Let’s check out how the format() function works with SWITCH in Power BI DAX, using an example:
1. Using our sample data, we are going to create a table like the one below:
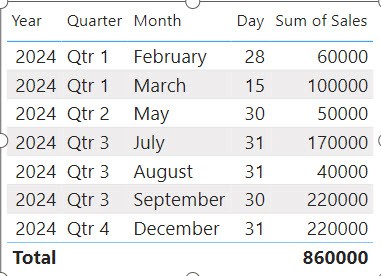
2. Now, we will create another data table with a column in a currency format like Rupee, GBP, USD, Euro, etc. Then, we will create a slicer chart using this currency format.
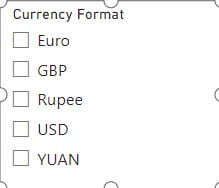
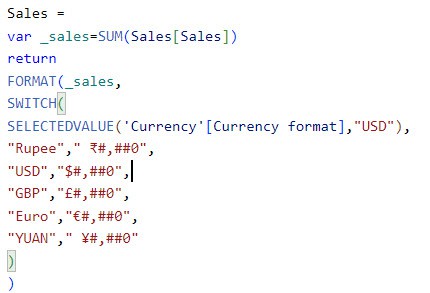
3. We will create a measure that will format the total sales according to slicer choices:
Sales =
var _sales=SUM(Sales[Sales])
return
FORMAT(_sales,
SWITCH(
SELECTEDVALUE('Currency'[Currency format],"USD"),
"Rupee"," ₹#,##0",
"USD","$#,##0",
"GBP","£#,##0",
"Euro","€#,##0",
"YUAN"," ¥#,##0"
)
)
Where:
- Sales = This assigns a name “Sales” to the measure being created.
- var _sales=SUM(Sales[Sales]) = It calculates the total sales amount values in the ‘Sales’ column.
- return = This indicates that the result of the following expression will be returned.
- FORMAT() = This function is used to format a value based on a specified format string.
- _sales = This is the value (total sales) that we want to format.
- SWITCH() = This function checks conditions and returns different formatting options based on those conditions.
- SELECTEDVALUE(‘Currency'[Currency format],”USD”) = It selects the currency format from the ‘Currency’ table, defaulting to “USD” if no specific format is selected.
4. Now, we’ll create a card visual and add the sales measure to it.
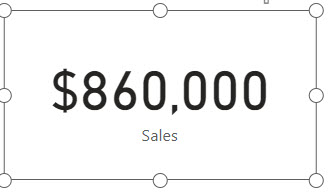
5. After that, you can see when you select any currency format in silver, and then it will reflect in the card visual currency symbol.

These are the ways we can use switch statements in power BI.
Some more Power BI articles you may like:
- Power BI Switch Multiple Conditions
- Power BI IF Date
- Power BI DAX Count
- Create a Power BI Pie Chart
- Conditional Formatting in Power BI Pie Chart
In this article, we discussed what a switch in Power BI is and how to use the switch in DAX with examples. We also saw how to work around with the Power BI switch statement with text and the Power BI DAX switch format.
I am Bijay a Microsoft MVP (10 times – My MVP Profile) in SharePoint and have more than 17 years of expertise in SharePoint Online Office 365, SharePoint subscription edition, and SharePoint 2019/2016/2013. Currently working in my own venture TSInfo Technologies a SharePoint development, consulting, and training company. I also run the popular SharePoint website EnjoySharePoint.com
amazing