Power BI is a great tool for data analysis. When people first learn Power BI DAX (Data Analysis Expressions), they often begin with basic arithmetic calculations like addition, subtraction, multiplication, and division.
In this tutorial, I will demonstrate how to subtract in Power BI using DAX (Calculate column, Measure).
We will also discuss how to Subtract a column from a Measure in Power BI and subtract values from different tables in Power BI with various scenarios.
Power BI Subtraction DAX
In Power BI, DAX (Data Analysis Expressions) is a language for creating formulas and expressions to manipulate data. When you subtract in DAX, you’re taking one value away from another.
For example, you have a dataset with sales figures for different products. You might want to subtract the sales of one product from another to see the difference in sales between them. You can use a subtraction DAX expression to do this calculation.
The syntax of subtraction is:
SubtractValues = Value1 – Value2How to Subtract in Power BI Using DAX
Now, I will tell you how to subtract two columns using Power BI DAX.
Scenario:
Let’s imagine you are running a small retail business, and you want to track your inventory. You have a dataset in Power BI that includes the initial quantity of items in stock and the quantity sold daily.
You want to calculate the amount of stock remaining.
In this scenario, we have an Excel file named “Inventory_Sales” with columns for Date, Initial Stock, and Units Sold. Check the screenshot below.
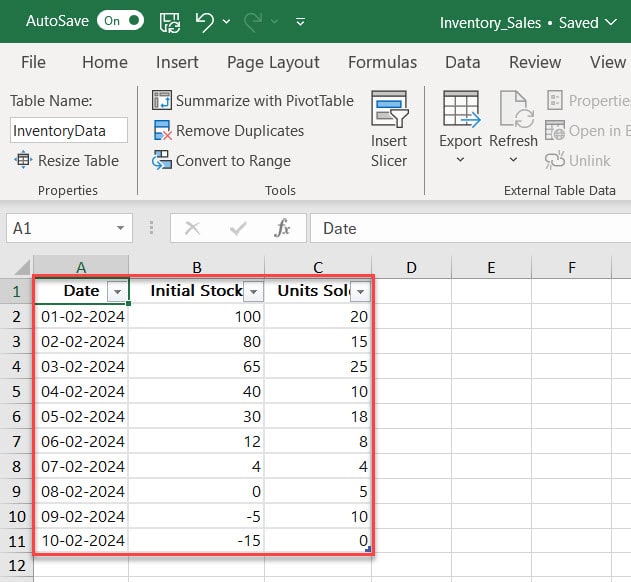
Now follow the below steps on how to subtract using DAX:
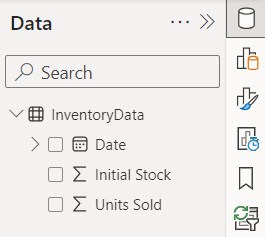
1. Open Power BI Desktop and load data using the Get data option. Then, you can see data in the Data pane.
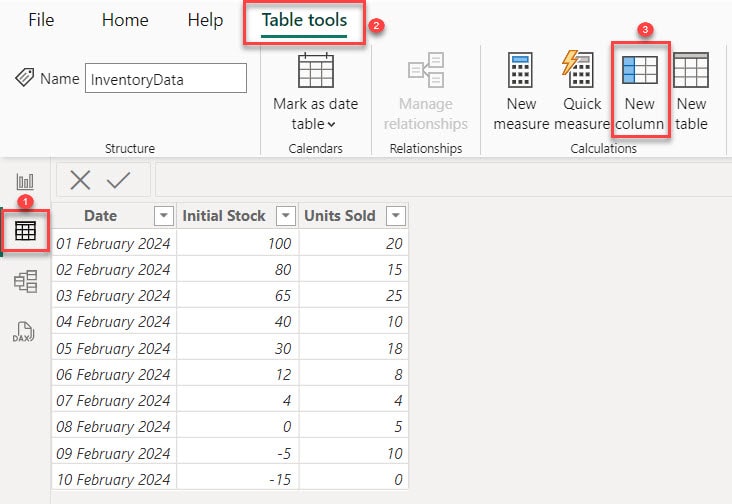
2. Go to the Table view and click the New column under the Table tools.
3. In the formula bar, put the below expression. Then click Commit.
Remaining Stock = [Initial Stock] - [Units Sold]Where:
- Remaining Stock = Name of the New column
- Initial Stock = Name of the column that stores Initial Stock
- Units Sold = Name of the column that stores how many units sold in a day

4. After that, one column is created in the Table view.
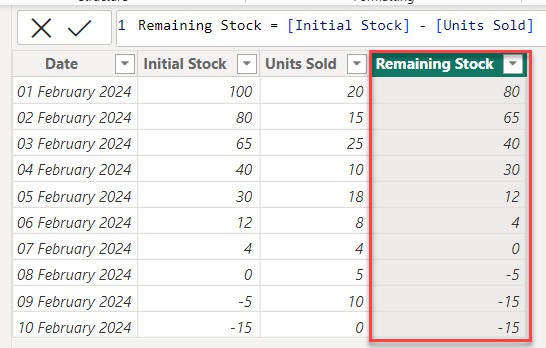
This way, you subtract two columns in Power BI DAX to see how much stock remains after it is sold.
How to Subtract a Column from a Measure in Power BI
Let’s say you manage a sales team and want to track their performance against a target.
You have a dataset in Power BI that includes the sales made by each salesperson and a target sales amount.
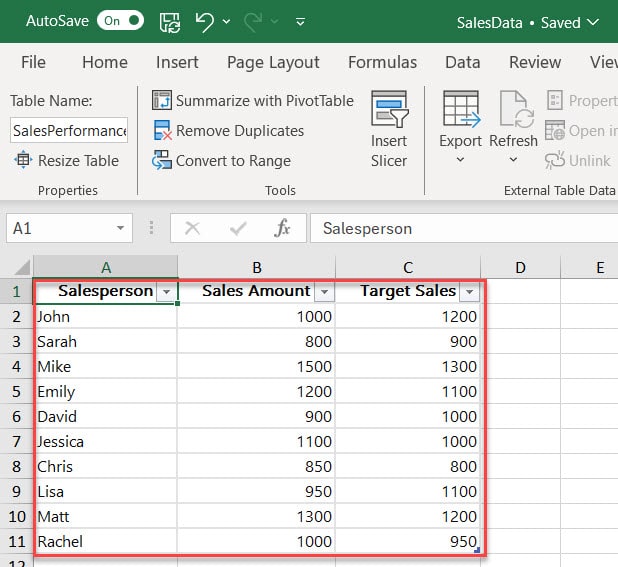
Follow the below steps to see how to subtract in a measure in Power BI:
1. Open Power BI Desktop and load data using the Get data option. Then, you can see data in the Data pane.
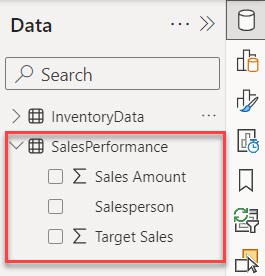
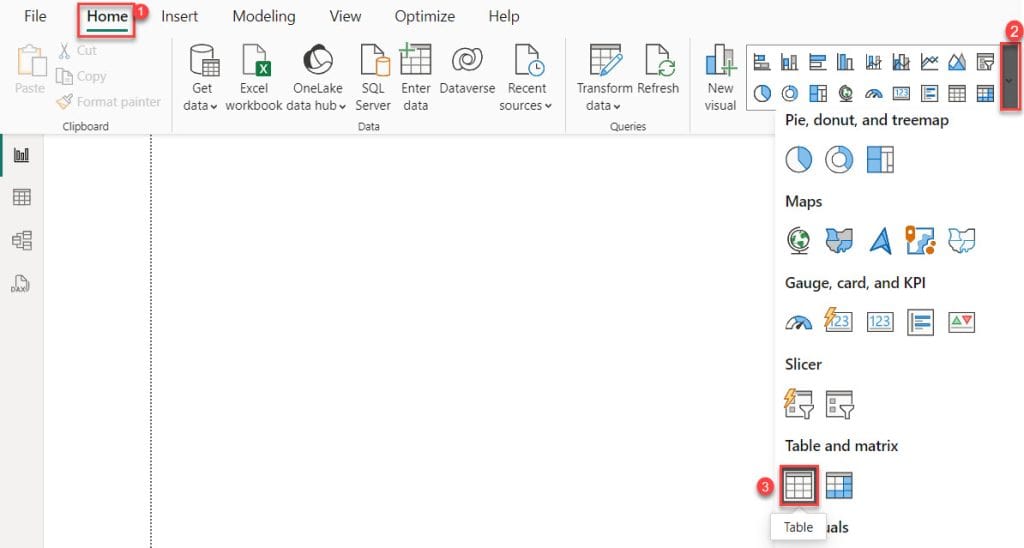
2. Under the Home tab, click “New measure“.

3. In the formula bar, Put the below expression. Then click Commit.
Variance = SUM('SalesPerformance'[Sales Amount]) - SUM('SalesPerformance'[Target Sales])Where:
- SUM(‘SalesPerformance'[Sales Amount]) = This formula calculates the total sales amount for all salespeople in the SalesPerformance table.
- SUM(‘SalesPerformance'[Target Sales]) = This formula calculates the total target sales amount for all salespeople in the SalesPerformance table.
- Variance = This store results in the variance between actual and target sales for all salespeople in the SalesPerformance table.

4. After that, Under the Home tab, expand Visual gallery(black box) -> Click the Table visual.
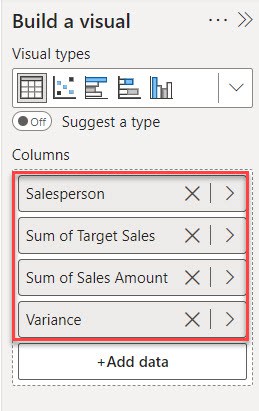
5. Then, using the +Add data option, add Salesperson, Target Sales, Sales Amount, and Variance into the Column field.
6. you can see the table visual in the report view.
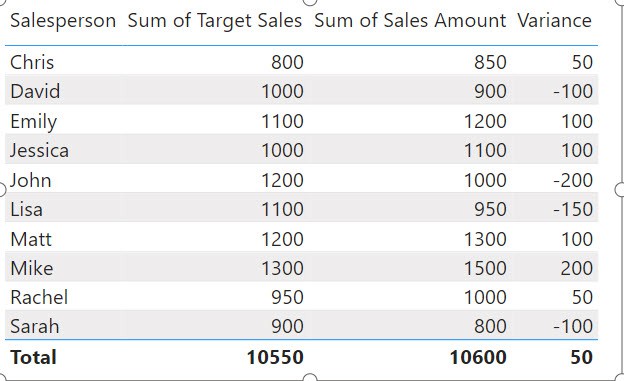
After that, you can track their performance against a target easily.
Power BI Subtract Two Columns from Different Tables
In this example, you see how to Subtract values from different tables in Power BI.
Let’s say you are managing your business’s sales and expense data in separate tables and want to calculate the profit.
According to this scenario, we have an Excel file named RetailData that contains two tables: SalesData and ExpensesData.
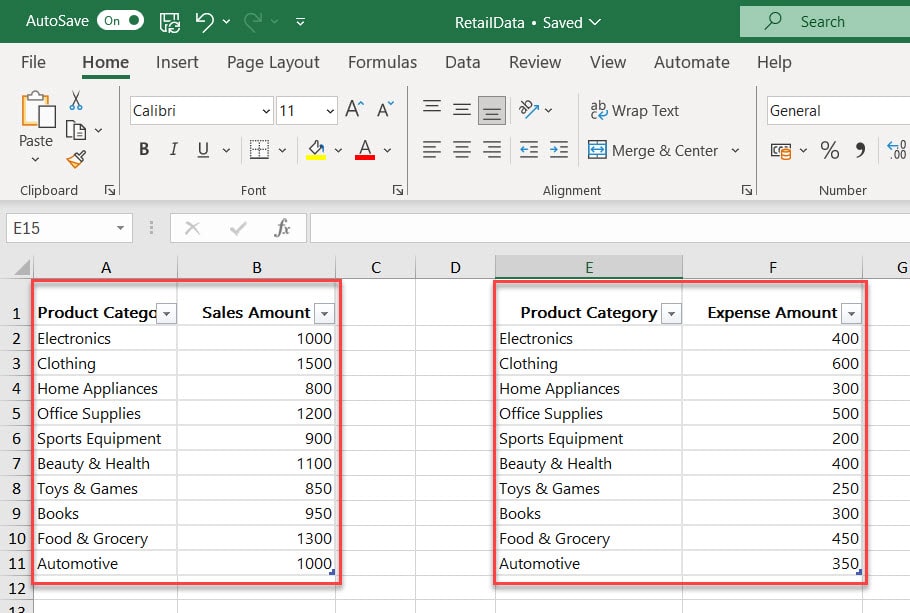
Now follow the below step to subtract two columns from different tables in Power BI:
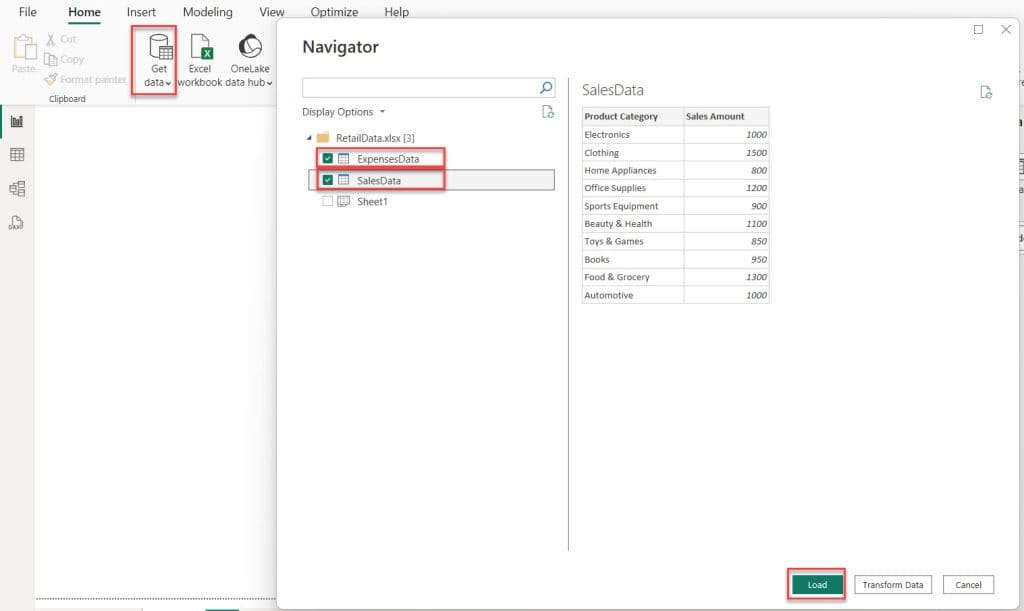
1. Open Power BI Desktop and load two tables using the Get data option.
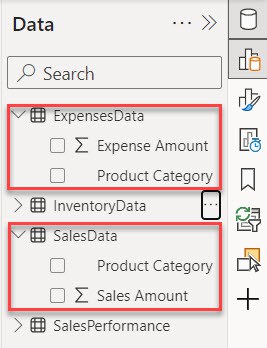
2. you will see data from both tables in the Data pane.
3. Now, we calculate sales revenue. To do this, select the SlaesData table. Under the “Table tools” tab, click “New measure.”

4. In the formula bar, Put the below expression. Then click Commit.
Total Sales Revenue = SUM('SalesData'[Sales Amount])Where:
- Total Sales Revenue = This is the measure’s name that stores sales revenue.
- SUM() = This is a function that calculates the sum of a column.
- SalesData = This is the table name from which the sales amount column is present.
- Sales Amount = This is the column name containing the sales value.

5. Now, we calculate total expenses. To do this, select the ExpensesData table. Under the “Table tools” tab, click “New measure.”

6. In the formula bar, Put the below expression. Then click Commit.
Total Expenses = SUM('ExpensesData'[Expense Amount])Where:
- Total Expenses = This is the measure’s name that stores total expenses.
- SUM() = This is a function that calculates the sum of a column.
- ExpensesData = This is the table name where the Expense Amount column is located.
- Expense Amount = This is the column’s name containing the expense values.

7. Now we calculate the Profit margin. To do this, under the Home tab, click “New measure.”

8. In the formula bar, Put the below expression. Then click Commit.
Profit = [Total Sales Revenue] - [Total Expenses]Where:
- Profit = Name of the new measure.
- [Total Sales Revenue] = The measure’s name storing the total revenue.
- [Total Expenses] = The measure storing the total expenses.

9. After that, Under the Home tab, expand Visual gallery(black box) -> Click the Table visual.
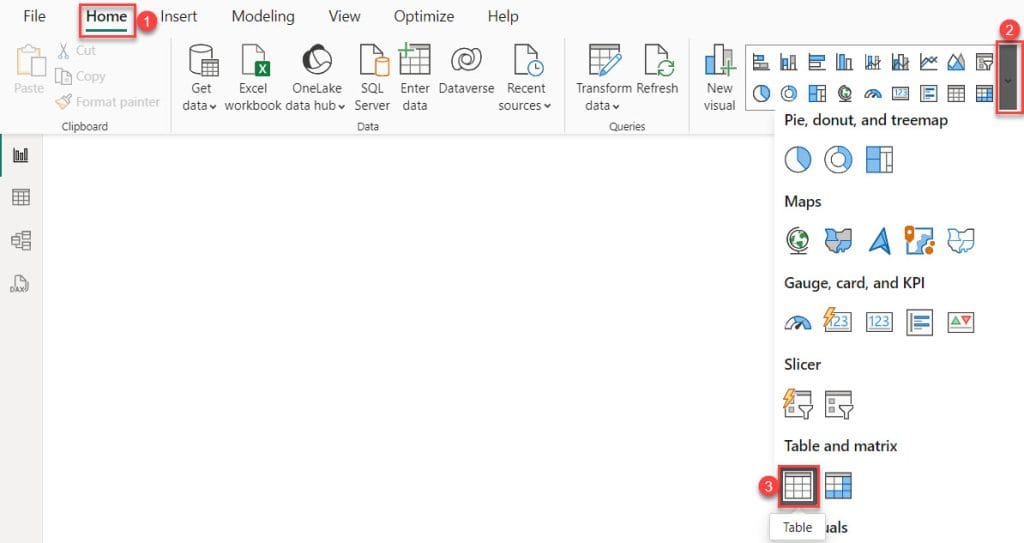
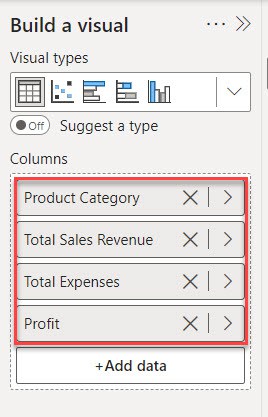
10. Then, using the +Add data option, add Product Category, Total Sales Revenue, Total Expenses, and Profit into the Column field.
11. After that you can see in the table visual.
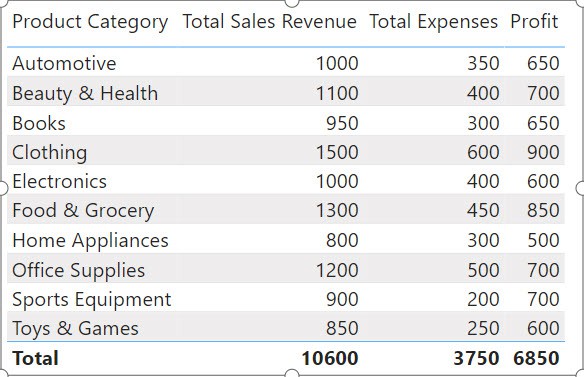
This is how you calculate the difference between two columns in different tables in Power BI.
Some more Power BI articles you may also like:
- Calculate Current Month and Previous Month Sales in Power BI
- Add Data to Existing Table in Power BI
- How to Export Power BI Reports to PDF
Analyzing this data in real-time allows you to make informed decisions to optimize your business operations, allocate resources efficiently, and maximize profits.
I hope this article will be very helpful!
I am Bijay a Microsoft MVP (10 times – My MVP Profile) in SharePoint and have more than 17 years of expertise in SharePoint Online Office 365, SharePoint subscription edition, and SharePoint 2019/2016/2013. Currently working in my own venture TSInfo Technologies a SharePoint development, consulting, and training company. I also run the popular SharePoint website EnjoySharePoint.com
how to show negative value
i mean 89-100=-11
Hi,
Check out this article https://www.enjoysharepoint.com/power-bi-measure-subtract/