It’s common for Power BI users to sort their data set when they’re analyzing.
In this tutorial, we will learn how to sort descending in Power BI Slicer. I’ll also show you how to sort slicer values based on numeric values in Power BI and Power BI sort date slicer descending.
Additionally, we will learn how to do your custom order in the Power BI slicer.
Power BI Slicer Sort Order Descending
When we create a Power BI Slicer, you must see the slicer value is sorted in ascending order by default, but we can change it within four clicks.
Scenario:
Suppose you want to create a Power BI report with slicers for State, Product Category, and Month. However, if slicers are not sorted meaningfully, users will find it difficult to find and select the desired filter option quickly.
According to this scenario, we have a SharePoint list named USA Retail Sales Data that contains the following columns with various data types:
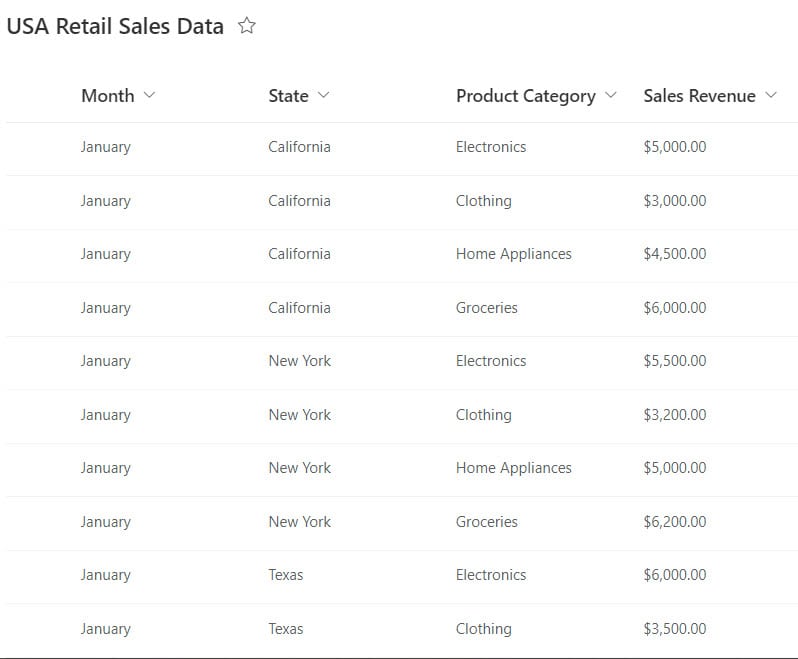
Follow the below steps to sort Power BI Slicer:
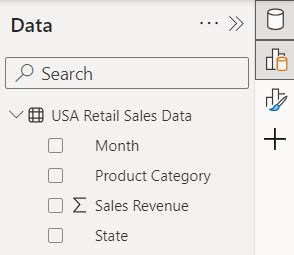
1. Open Power BI Desktop and load data using the Get data option. Then, you can see data in the Data pane.
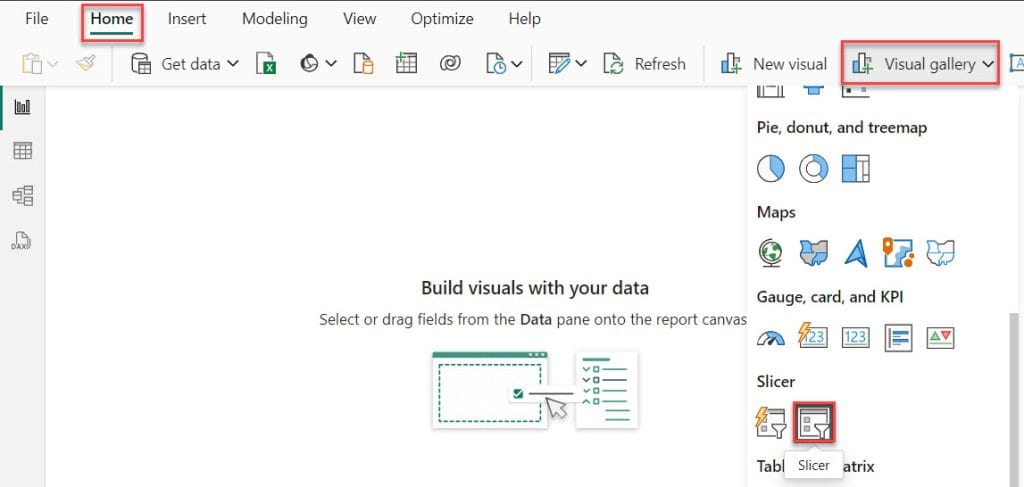
2. Under the Home tab, select Visual gallery, and select the Slicer visual icon.
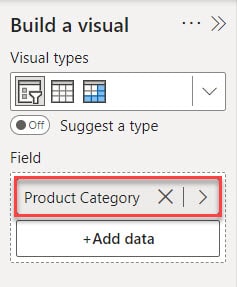
3. Using the +Add data option, add the Product Category into the Field.
4. Select the slicer and select the 3 dots (…) in the top right corner -> click Sort axis -> click Sort descending.
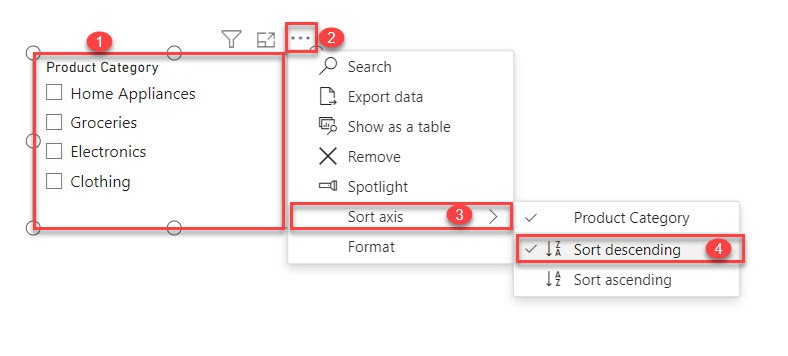
This way, you can sort the slicer in descending/ascending order in Power BI.
How to Sort Slicer Values Based on Numeric Values in Power BI?
To sort slicer values based on numeric values in Power BI, follow the example below:
1. Under the Home tab, select Visual gallery, and select the Slicer visual icon.

2. Using the +Add data option, add the Sales Revenue into the Field.
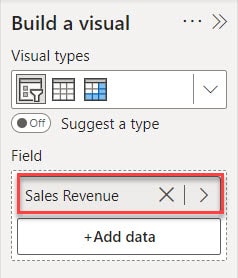
3. Select the slicer and select the 3 dots (…) in the top right corner -> click Sort axis -> click Sort descending.
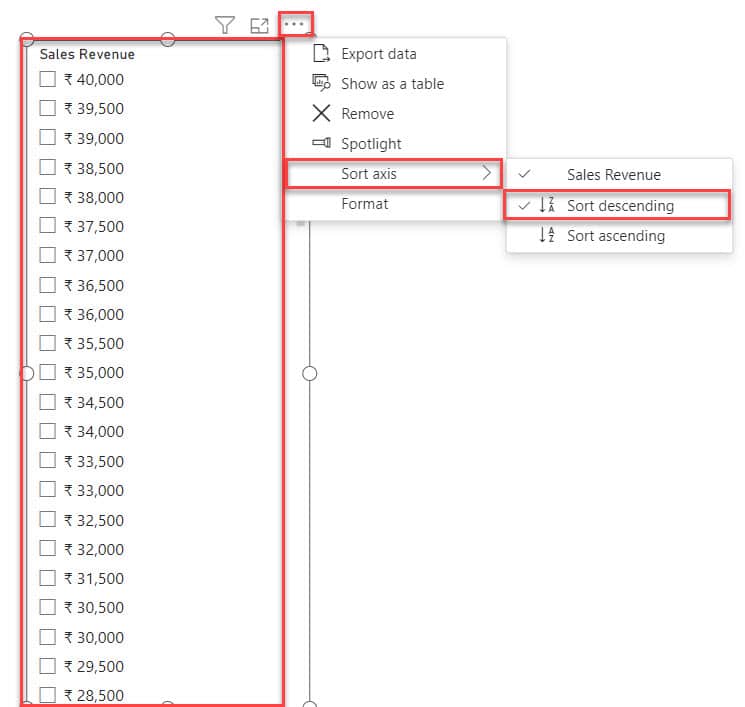
This is how to sort a Power BI slicer in descending order.
Power BI Sort Date Slicer Descending
In this example we see how to sort date descending in Power BI Slicer.
Our dataset has a problem: there is no column for the date. Let’s check the steps below to learn how to sort it.
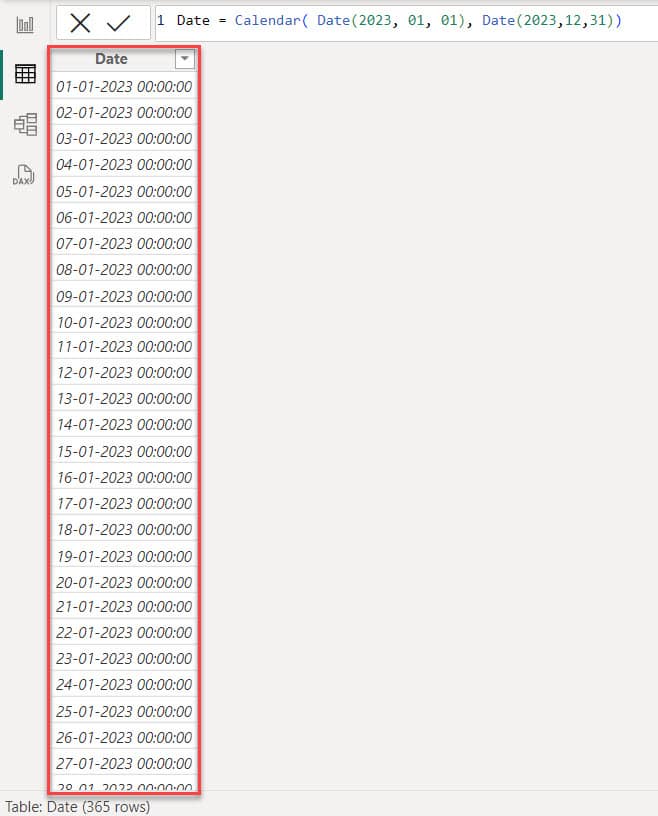
1. Go to the Table view. Under the Table tools, click New table.
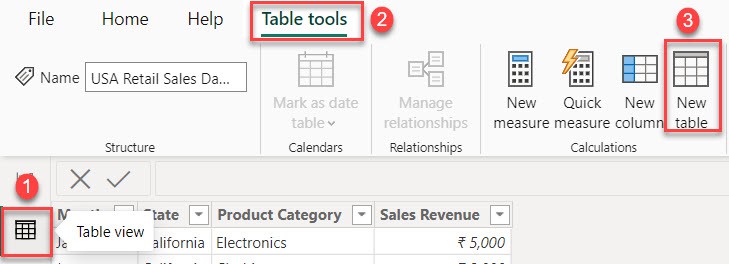
2. In the formula bar, put the below formula.
Date = Calendar( Date(2023, 01, 01), Date(2023,12,31))Where:
- Date = It creates a table with a column containing all the dates between January 1, 2023, and December 31, 2023.
- Calendar = Generates a table of dates within a specified range.
- Date(2023, 01, 01) = This creates a date representing January 1, 2023.
- Date(2023,12,31) = This creates a date representing December 31, 2023.

3. Then you can see in the table view one date column is added.
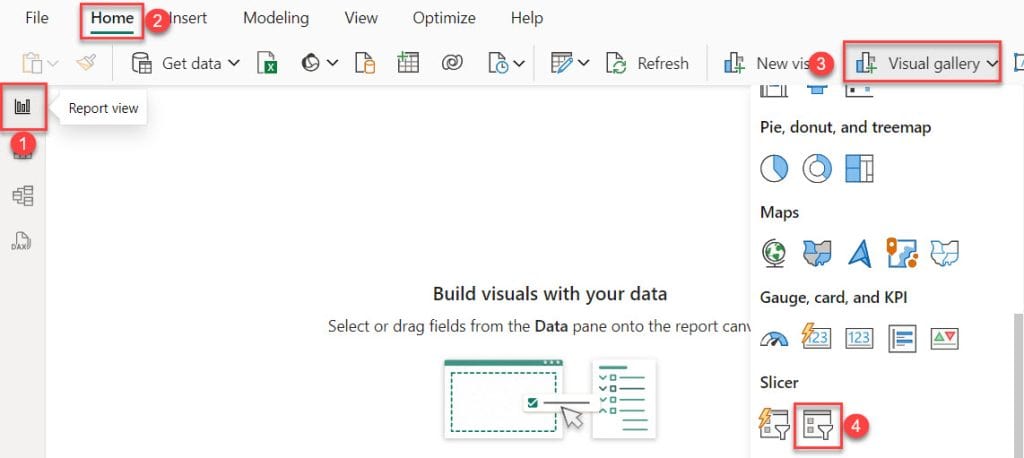
4. Go to Report view. Under the Home tab, expand the Visual gallery and select the Slicer.
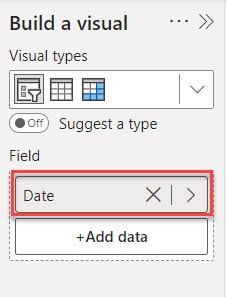
5. Using the +Add data option, add the Date into the Field.
6. Select the slicer and select the 3 dots (…) in the top right corner -> click Sort axis -> click Sort descending.
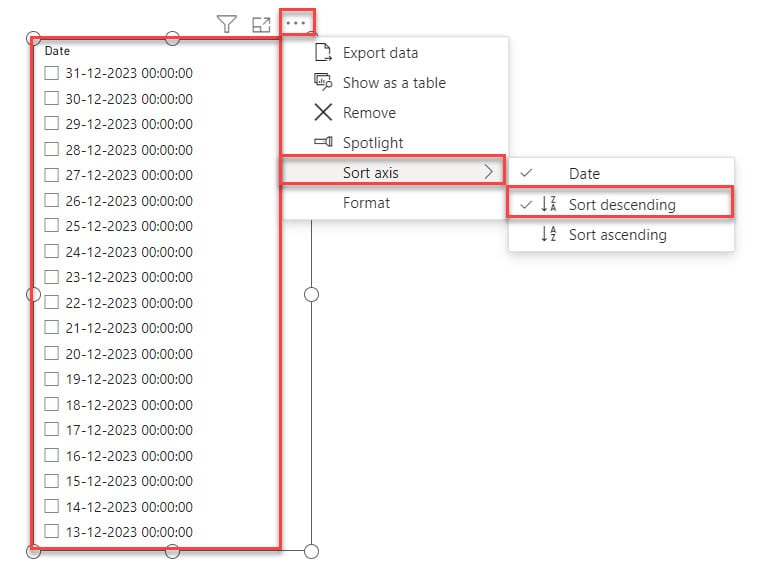
This way, you can sort date slicer descending in Power BI.
Power BI Slicer Custom Order
This example shows how you can arrange your slicer values the way you want.
When we create a product category slicer, I want the slice value order to be like Electronics, Clothing, Home Appliances, and Groceries.
To do this, follow the below steps:
1. Under the Home tab, click Enter data.

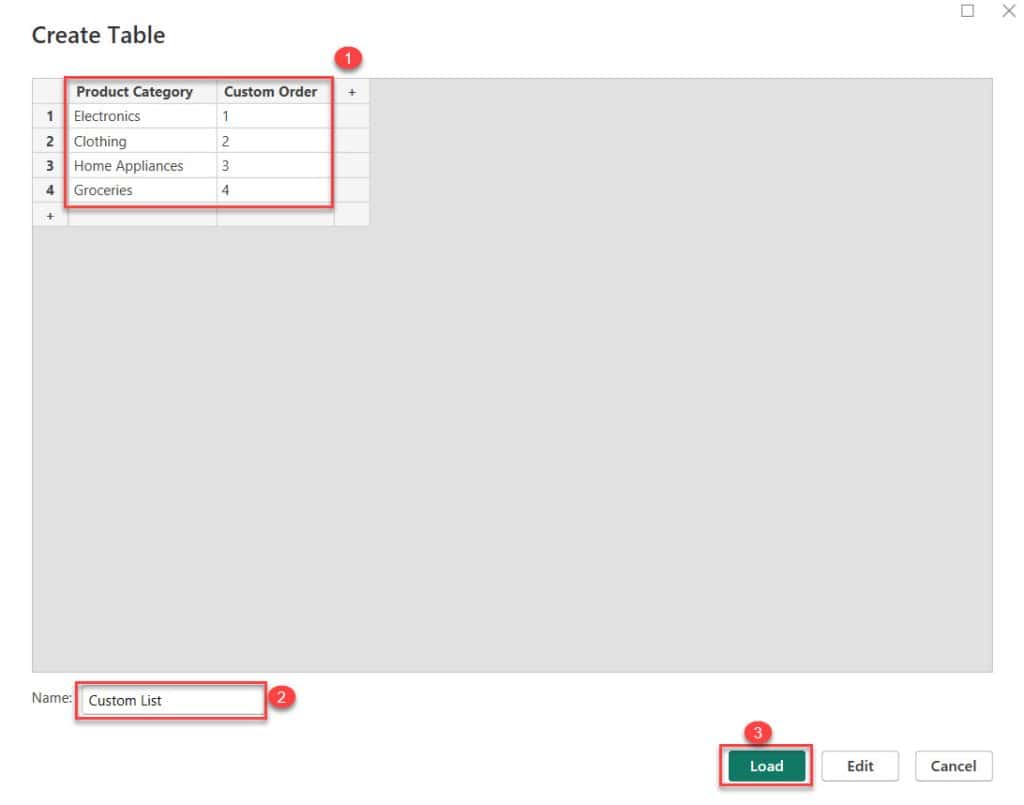
2. After that, you will see a window (Create Table) where you can use the ‘+’ symbols to add new columns and rows. Next, input the data into the table. Once you’ve added the necessary data, give the table a name (Custom List), and finally, click on the “Load” button.
3. After that, go to Table view -> Select Product Category -> Click on Sort by column from the top ribbon -> Select Custom Order.

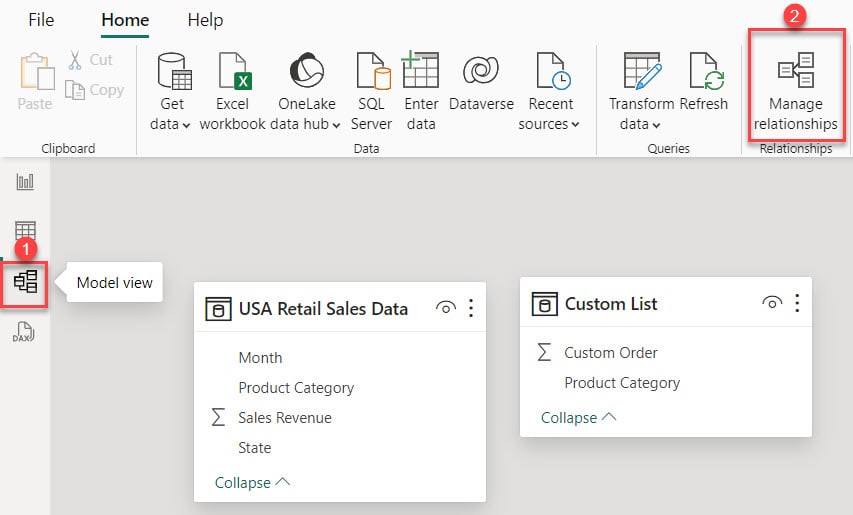
4. Click on Model view -> Manage relationships from the top ribbon.
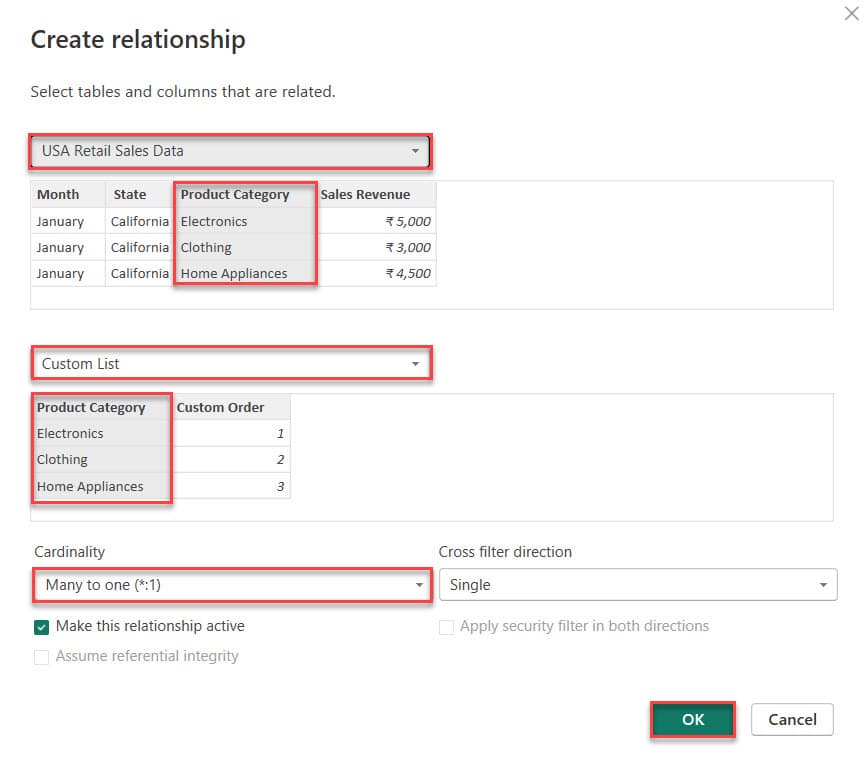
5. In the “Create relationship” dialog box, select the original table and choose the column you want to sort, which in my case is Month Name. Ensure the “Cardinality” is set to Many to One, then click OK.
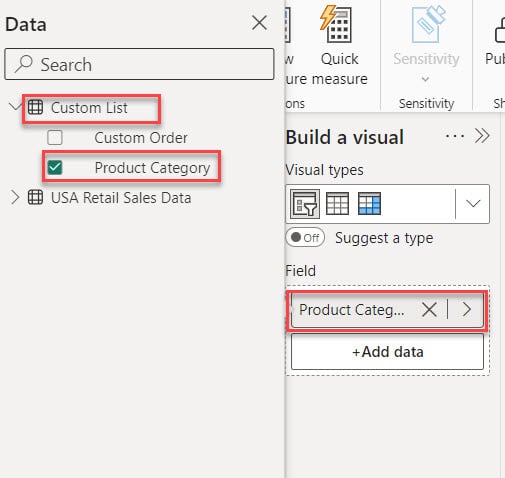
6. Goto Repoet view, under the Home tab, expand Visual gallery (black box) -> Click the Slicer visual.

7. Then, use the +Add data option to add the Month into the Field. Check the screenshot below.
8. After that, you can see our slicer visual order, which includes Electronics, Clothing, Home Appliances, and Groceries.
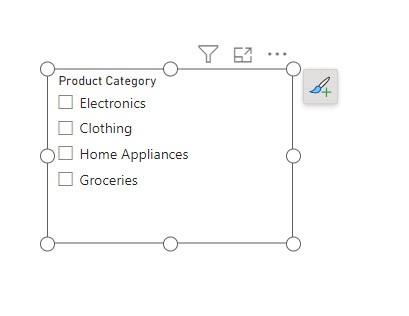
This way, you can arrange your slicer values the way you want.
I hope this article is helpful in understanding how to sort Power BI slicers. Also, we saw how to sort slicer values based on numeric values in Power BI, Power BI sort Date slicer descending with examples.
Also, you may like:
- Remove Blank From Power BI Slicer
- sort slicer by another column in Power BI
- Sort by Multiple Columns in Power BI
- Line Chart in Power BI
I am Bijay a Microsoft MVP (10 times – My MVP Profile) in SharePoint and have more than 17 years of expertise in SharePoint Online Office 365, SharePoint subscription edition, and SharePoint 2019/2016/2013. Currently working in my own venture TSInfo Technologies a SharePoint development, consulting, and training company. I also run the popular SharePoint website EnjoySharePoint.com