Sorting columns is common when working with Power BI tables and matrix visuals. It helps in organizing and presenting data in a more meaningful way for analysis.
But what if you want to Sort Multiple Columns in Power BI?
Sorting columns in Power BI tables and matrix visuals might differ from other software, but you can easily achieve it using the Shift + Click method, which is unique to Power BI.
Recently, I was working on a Power BI report. With the help of sorting multiple columns in Power BI, I can organize my data effectively, making it easier to analyze and understand.
In this tutorial, we will learn how to sort by multiple columns in Power BI and how to sort multiple columns in Power BI Matrix Visual.
Additionally, we will explain how to sort multiple columns using Power BI Power Query Editor and how to sort by multiple columns using the Power BI DAX.
How to Sort by Multiple Columns in Power BI
Sorting multiple columns in Power BI means arranging the data in a table or visual based on the values of two or more columns. This helps organize the data more meaningfully, making it easier to analyze and understand relationships between attributes.
Example:
Let’s say you have a sales table with columns for Product Category and Sales Amount. Sorting by Product Category in ascending order and then by Sales Amount in descending order would group the data first by category.
Then, each category would show the highest sales amounts first. This makes it easier to identify which categories perform the best overall and within each category.
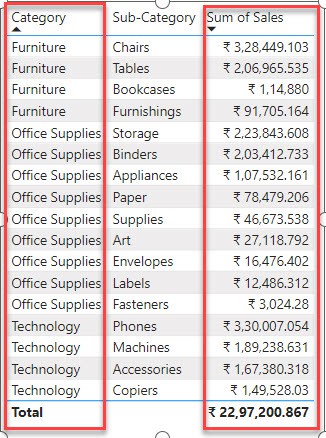
Sort a Power BI Table by Multiple Columns
This example shows how to sort by multiple columns in the Power BI table visual.
Scenario:
You have a Power BI table containing columns for Department and Price. You want to sort this table to identify products that are low in stock within each department and also sort them by price to see the cheapest ones first.
According to this scenario, we have a SharePoint list named Inventory Data 2024 that contains the following columns with various data types:
| Columns | Data Types |
|---|---|
| Department | Single line of text |
| Product | Single line of text |
| Price | Currency |
| Stock | Number |
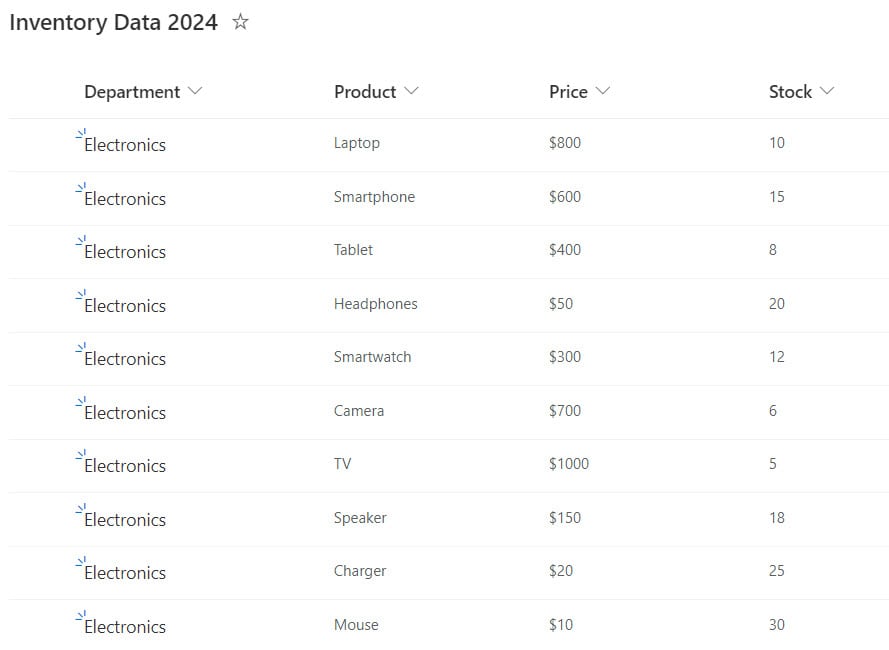
Follow the below steps to sort multiple columns in the Power BI table visual:
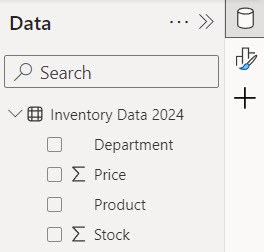
1. Open Power BI Desktop and load data using the Get data option. Then, we can see the data set in the Data Panel.
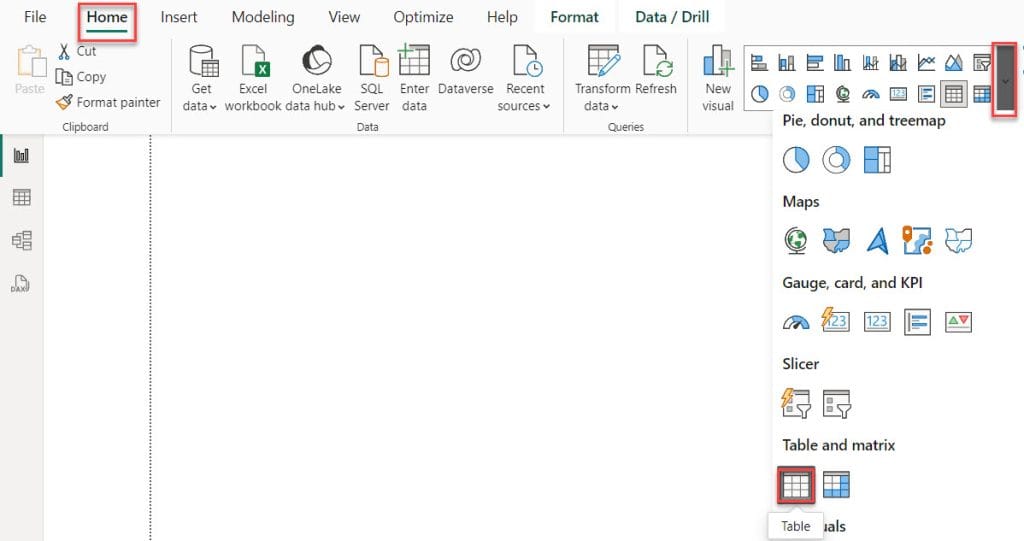
2. Under the Home tab, expand Visual gallery(black box) -> Click the Table visual.
3. Then, using the +Add data option, add Department, Product, Price, and Stock in the Column field.
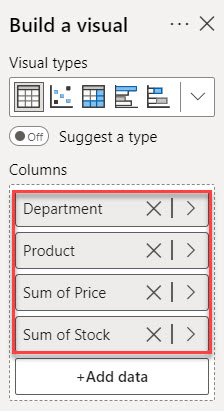
4. you can see our Power BI table visual created successfully.
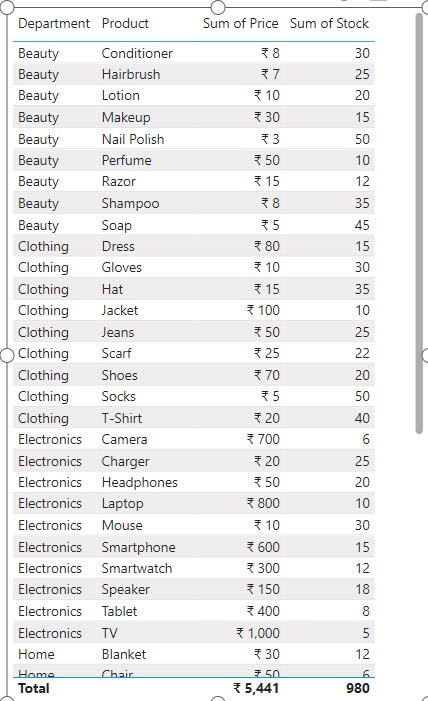
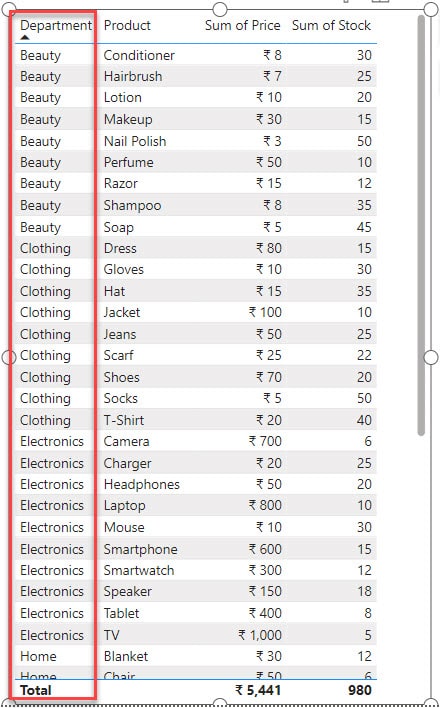
We are going to organize the table by “Department” in ascending order (from A to Z), and then we’ll organize the “Price” in ascending order(from lowest to highest), so you’ll see the cheapest products first.
To do this, follow the steps:
5. Press Shift + Left Click on the Column Header for which we want to apply Multiple Sort. In my case, first, I click on the Department.
6. In the same way, click another column header. In my case, the sum of Price.
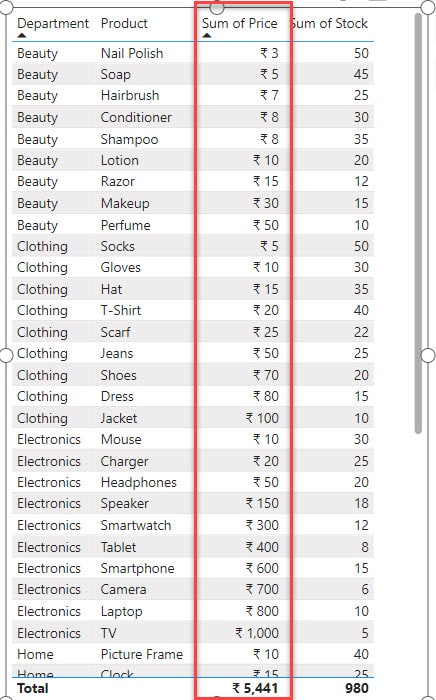
Now you can see the cheapest items available first within each department.
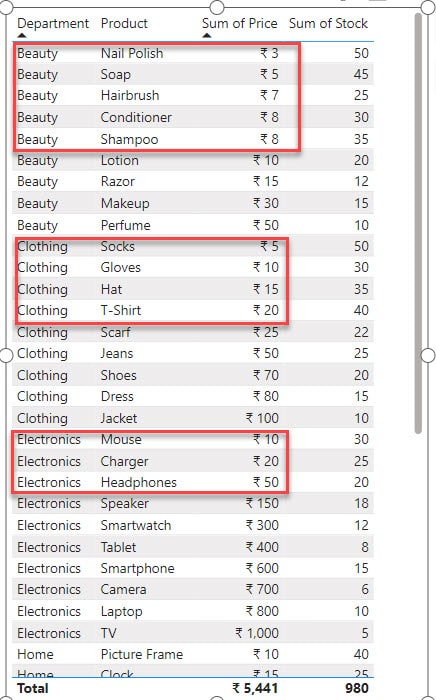
You can sort by multiple columns in a Power BI table visual.
Power BI Sorts by Multiple Columns in the Matrix
Let’s learn how to arrange data in Power BI based on more than one column in the matrix visual.
Note:
We can’t sort multiple columns together at the Power BI Matrix visual. We can only sort one column in the Power BI Matrix visual.
In this example, we will see how to sort multiple columns in the Power BI matrix visual.
I have a SharePoint list named Sales Data that contains the following columns with various data types:
| Columns | Data Types |
|---|---|
| Region | Single line of text |
| City | Single line of text |
| Quantity | Number |
| Sales | Currency |
| Profit | Currency |
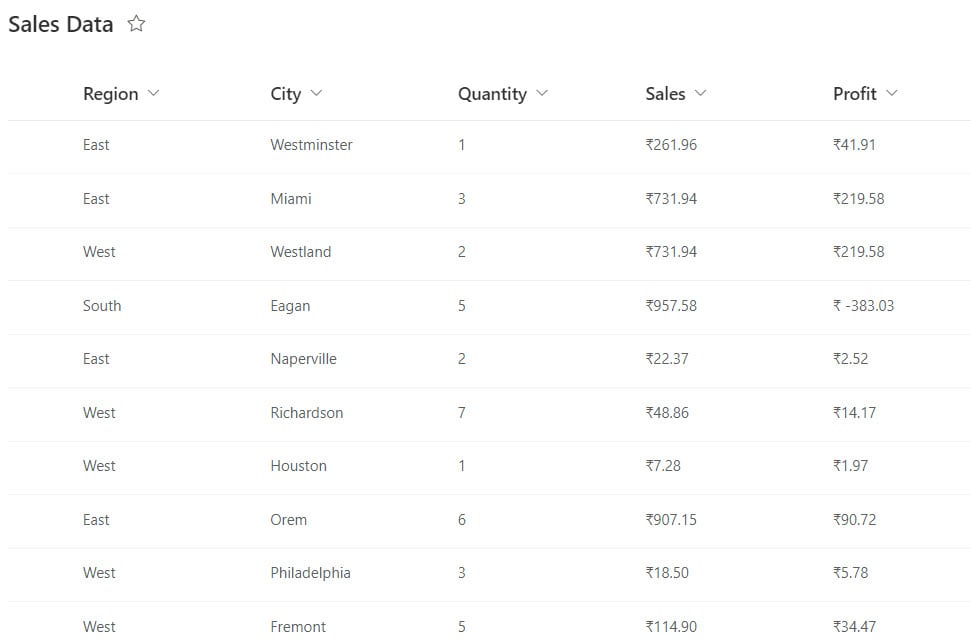
Now follow the below steps:
1. Open Power BI Desktop and load data using the Get data option. Then, we can see the data set in the Data Panel.
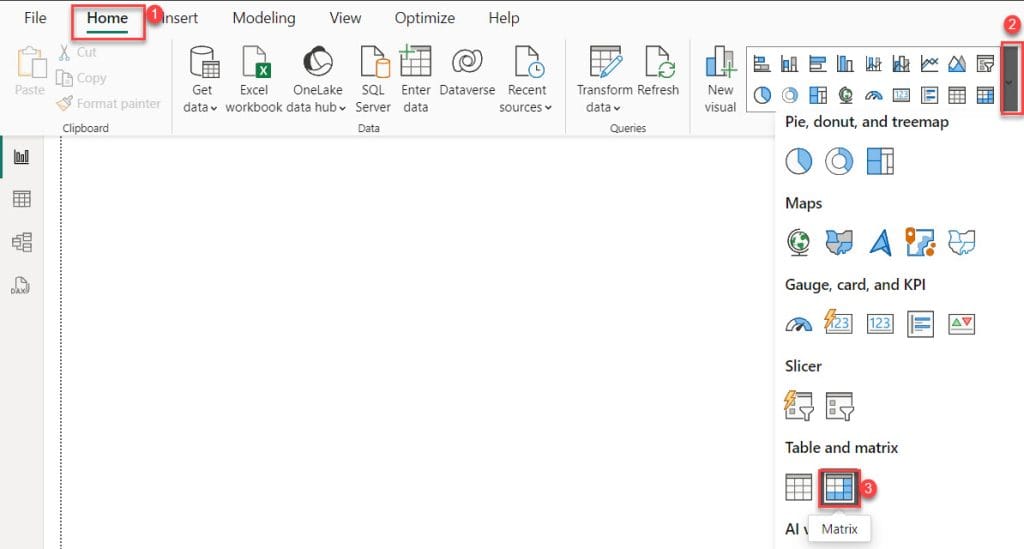
2. Under the Home tab, expand Visual gallery(black box) -> Click the Matrix visual.
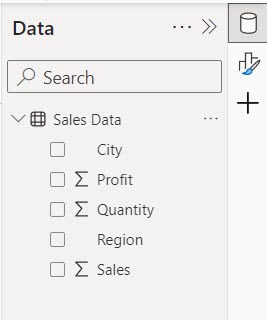
3. Next, click on the +Add data option and choose Region and City to be displayed as Rows. For the Values, select Quantity, Sales, and Profit. Check the screenshot below.
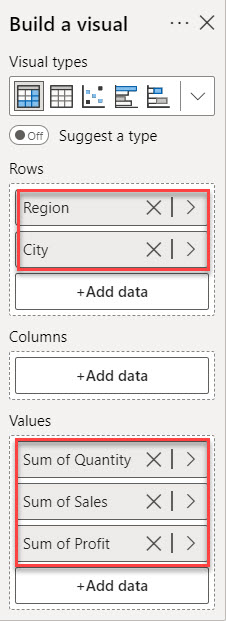
4. To sort the matrix visual, click on the column header. For example, if you want to sort by region in descending order, click the “Region” header.
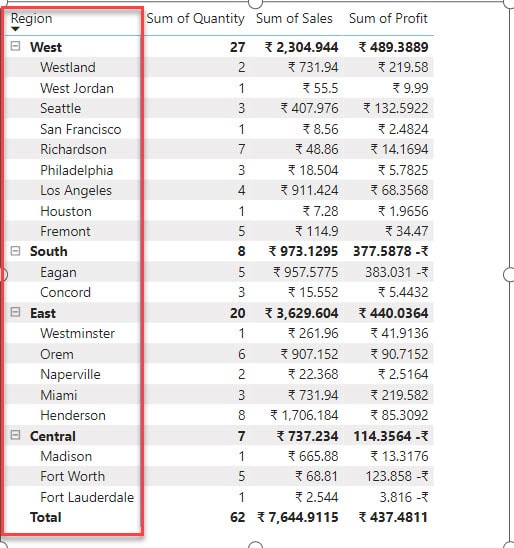
You can sort columns in the Power BI matrix visual this way.
Sort Multiple Columns using Power Query Editor
This example shows how to sort multiple columns using Power BI Power Query Editor.
I hope you load the data in Power BI Desktop. Now follow the below steps:
1. Under the Home tab, click Transform data.

2. In the Power Query editor, pick the table where you want to sort multiple columns, especially if you have multiple tables.
In my situation, since I have several tables, I selected the “Inventory Data 2024” table.

3. After selecting the dropdown menu inside the column you want to sort, click on it. Then, choose “Sort Ascending” or “Sort Descending” and click “OK.”
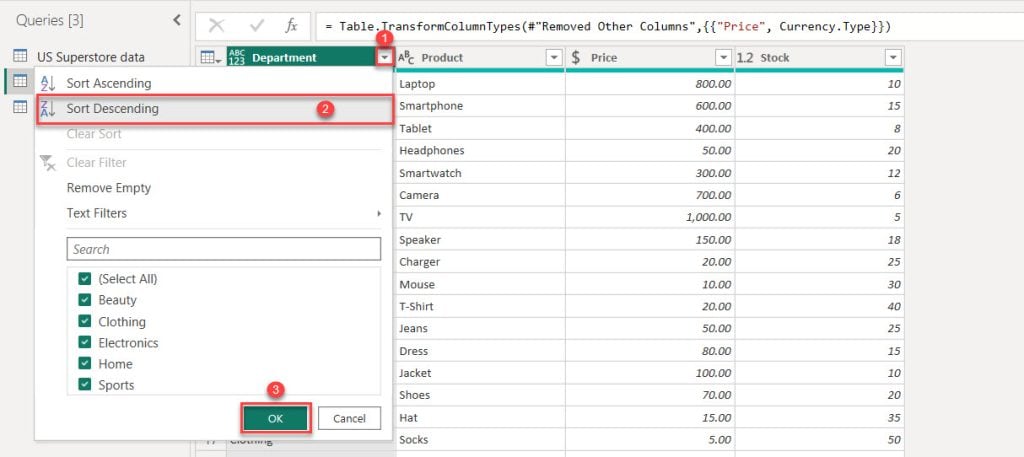
4. Repeat the same process for another column: select the dropdown menu inside the column you want to sort, click on it, choose “Sort Ascending” or “Sort Descending,” and then click “OK.”
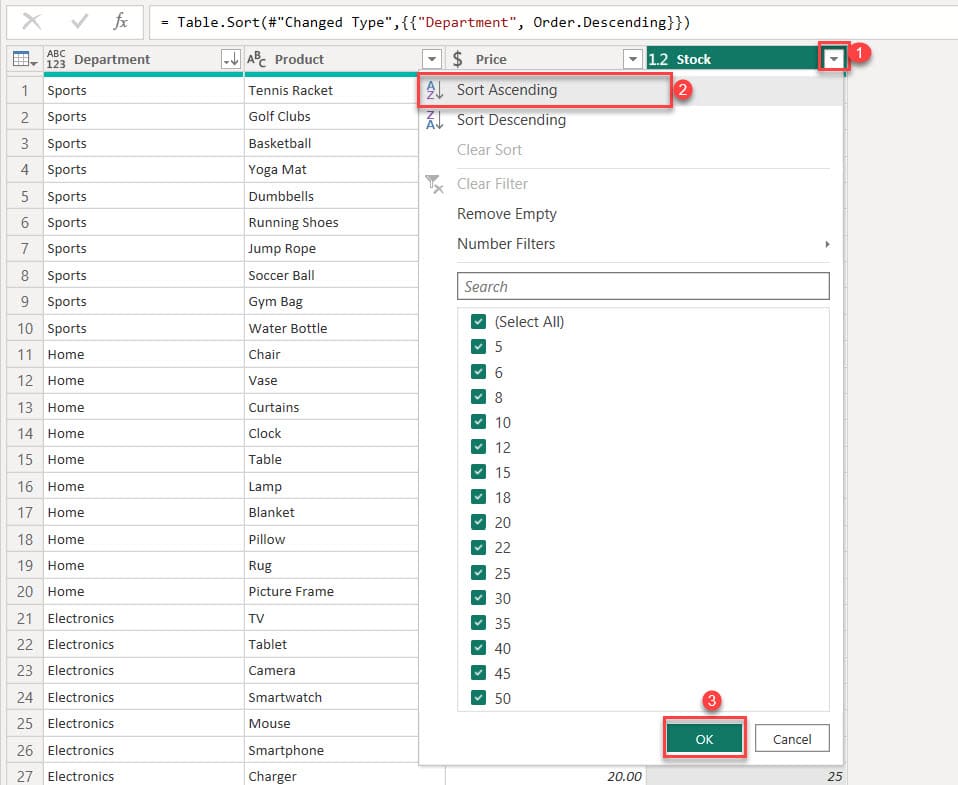
5. Once you’ve done that, you’ll notice arrow indicators on the column header, or you can verify the sorting in the formula bar where the M query shows the column name and the order type.
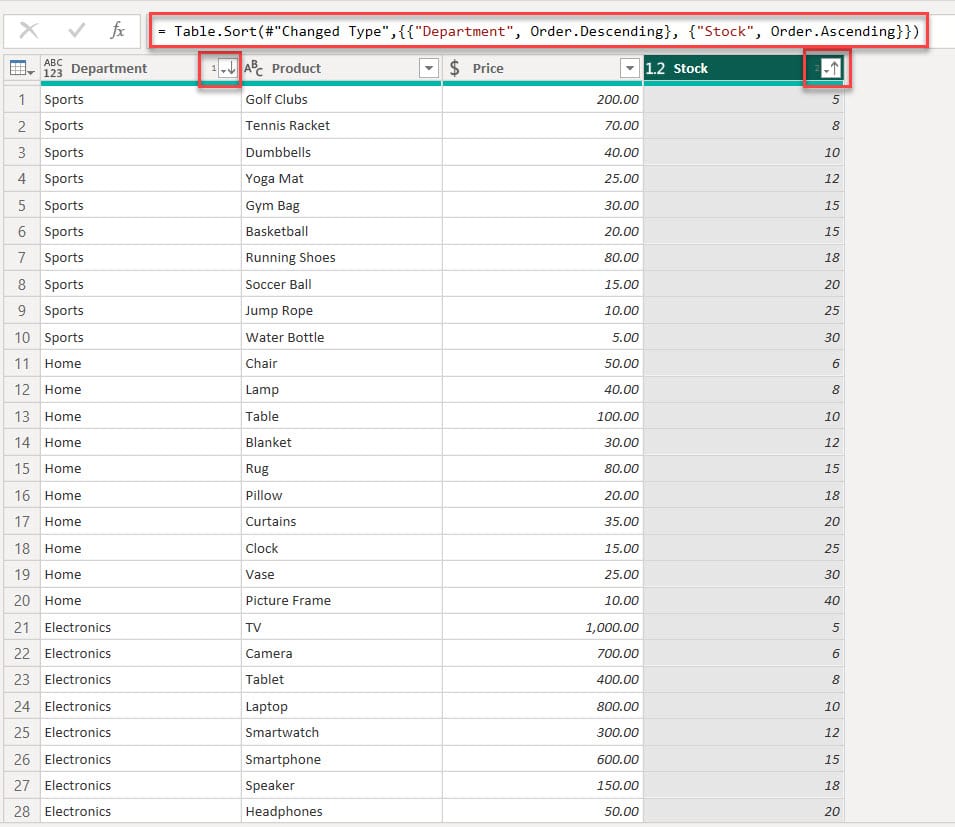
This way, you can sort multiple columns using Power BI Power Query Editor
Power BI Sort by Multiple Columns DAX
This example shows how to sort by multiple columns using the Power BI DAX.
Scenario:
Suppose you have a dataset containing information about employees and their sales performance. Your dataset includes columns such as Employee Name, Product Sold, Sales Amount, and Sales Date.
You want to sort the sales data in your Power BI report by Employee Name in ascending order and then by Sales Date in ascending order. This will allow you to analyze each employee’s sales performance over time easily.
To do this, follow the below steps:
1. Open Power BI Desktop, and under the Home tab, click Enter data.

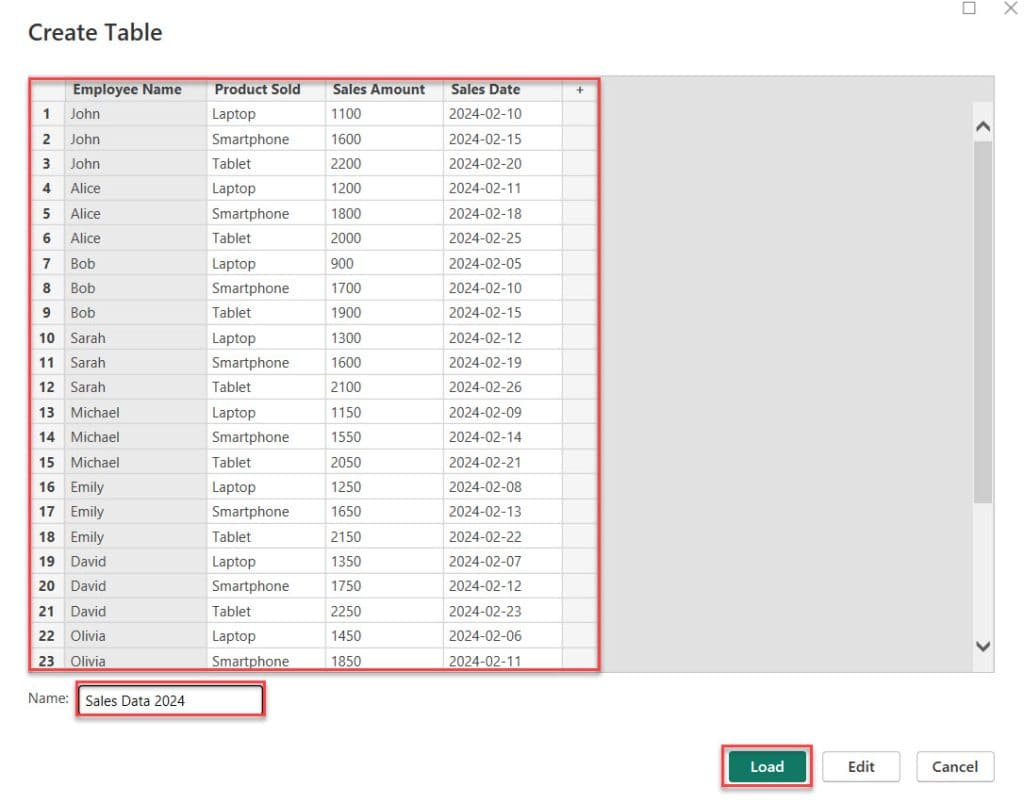
2. After that, you will see a window(Create Table) where you can use the ‘+’ symbols to add new columns and rows. Next, input the data into the table. Once you’ve added the necessary data, give a name to the table (Sales Data 2024), and finally, click on the “Load” button.
3. After that, go to the Table view. Then, click the New column under the “Table tools” tab.
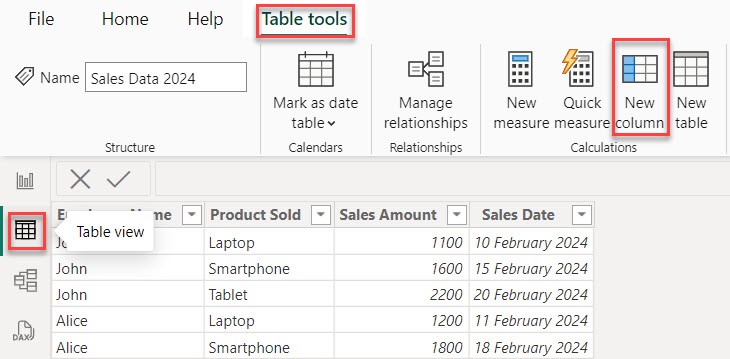
4. In the formula bar, put the below DAX expression. Then click the Commit button.
SortOrder = [Employee Name] & FORMAT([Sales Date], "yyyyMMdd")Where:
- SortOrder = It is a new calculated column named SortOrder.
- [Employee Name] = It refers to the employee names column.
- FORMAT([Sales Date], “yyyyMMdd”) = formats the sales date column as a string in the format yyyyMMdd.
- & = Joins together the employee name and formatted date strings.

5. Then go to Report view. After that, under the Home tab, expand Visual gallery(black box) -> Click the Table visual.

6. Then, using the +Add data option, add Employee Name, Product Sold, Sales Amount, Sales Date, and SortOrder.
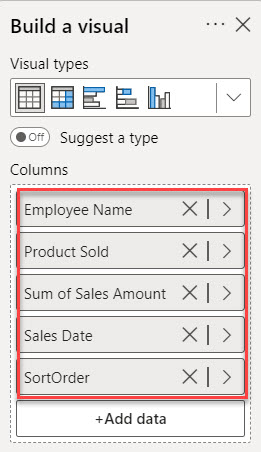
7. Select the ellipsis icon (…) at the top right of the table visual -> Select Sort ascending -> expand Sort by -> select SortOrder.
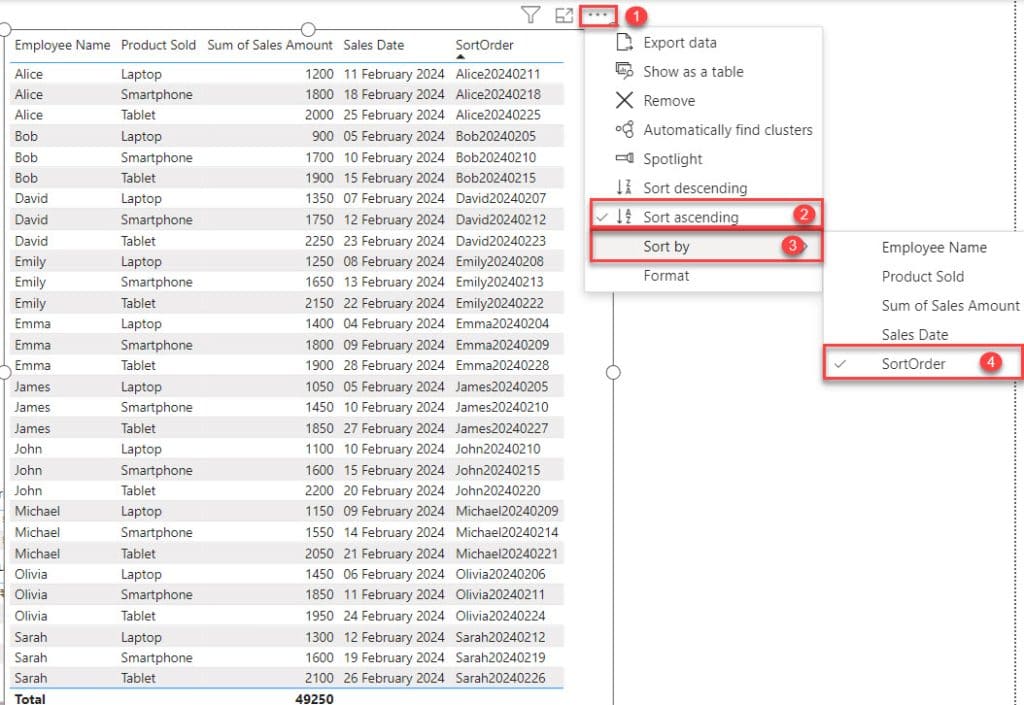
8. You can see the “Employee Name” and “Sales Date” in ascending order.
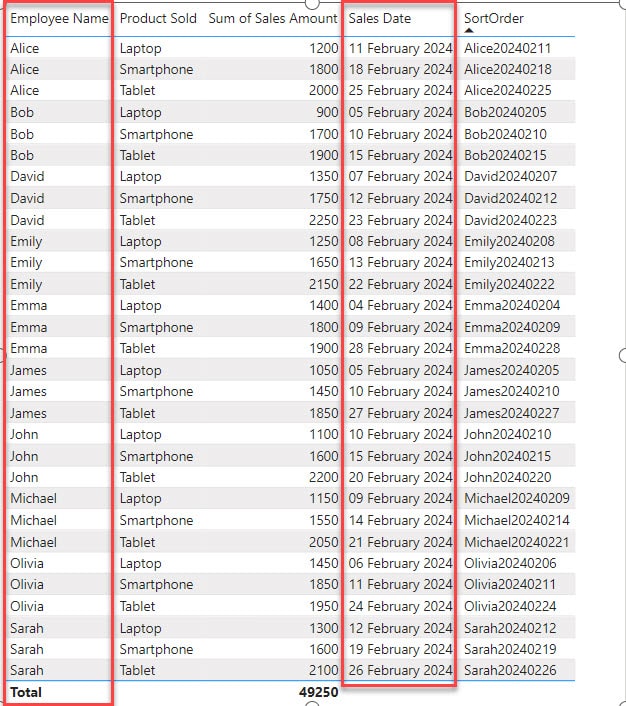
This is how to sort multiple columns using the Power BI Dax.
Conclusion
Now, with the help of sorting multiple columns, you can organize your data more effectively. This makes it easier to analyze and understand your information.
In this tutorial, we learned how to sort multiple columns in Power BI, how to sort by multiple columns in the Power BI table visual, and how to sort multiple columns in the Power BI matrix visual.
Additionally, we explained how to sort multiple columns using Power BI Power Query Editor and sorting by multiple columns using the Power BI DAX.
Also, you may like some more Power BI articles:
- Power BI sort table by Date
- sort slicer by measure in Power BI
- How to sort slicer by another column in Power BI
I am Bijay a Microsoft MVP (10 times – My MVP Profile) in SharePoint and have more than 17 years of expertise in SharePoint Online Office 365, SharePoint subscription edition, and SharePoint 2019/2016/2013. Currently working in my own venture TSInfo Technologies a SharePoint development, consulting, and training company. I also run the popular SharePoint website EnjoySharePoint.com