If you are having trouble organizing your data in Power BI, the Power BI measure table can be helpful.
In this Power BI tutorial, we will look at the idea of a Power BI measure table, how to create a measure table in Power BI, and how to add the measure to the measure table in Power BI.
We’ll also cover how to utilize the measuring table in Power BI visualizations and move measures to the measuring table.
Power BI Measures Table
In Power BI, a Measures table is a special table where you define calculations or measures you want to use in your reports.
These measures can perform calculations like summing, averaging, counting, etc, on your data.
Think of it as a place to store the formulas you need to analyze your data effectively. Instead of keeping your main data tables with these calculations, you organize them neatly in a Measures table for easy access and management.
How to Create a Measure Table in Power BI
Now we see how to create a measure table in Power BI Desktop.
Scenario:
Imagine you are a retail manager responsible for analyzing sales performance in your stores. You want to track important metrics such as total sales revenue, average sales per transaction, and profit margin to understand how well your business performs.
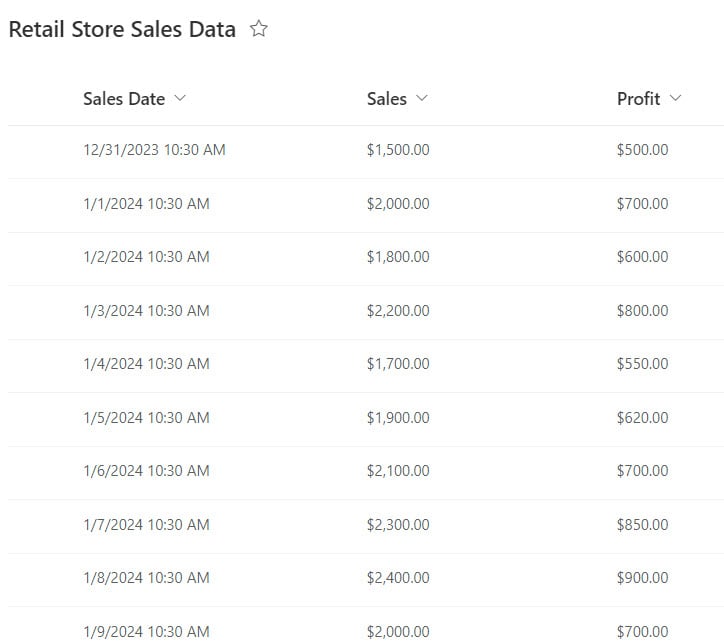
According to this scenario, we have a SharePoint list named Retail Store Sales Data that contains the following columns with various data types:
| Columns | Data Types |
|---|---|
| Sales Data | Data and time |
| Sales Amount | Currency |
| Profit | Currency |
Here are the steps to make a measure table in Power BI:
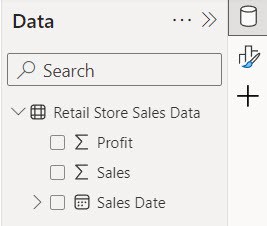
1. Open Power BI Desktop and load the data. Then, you see data in the Data pane.
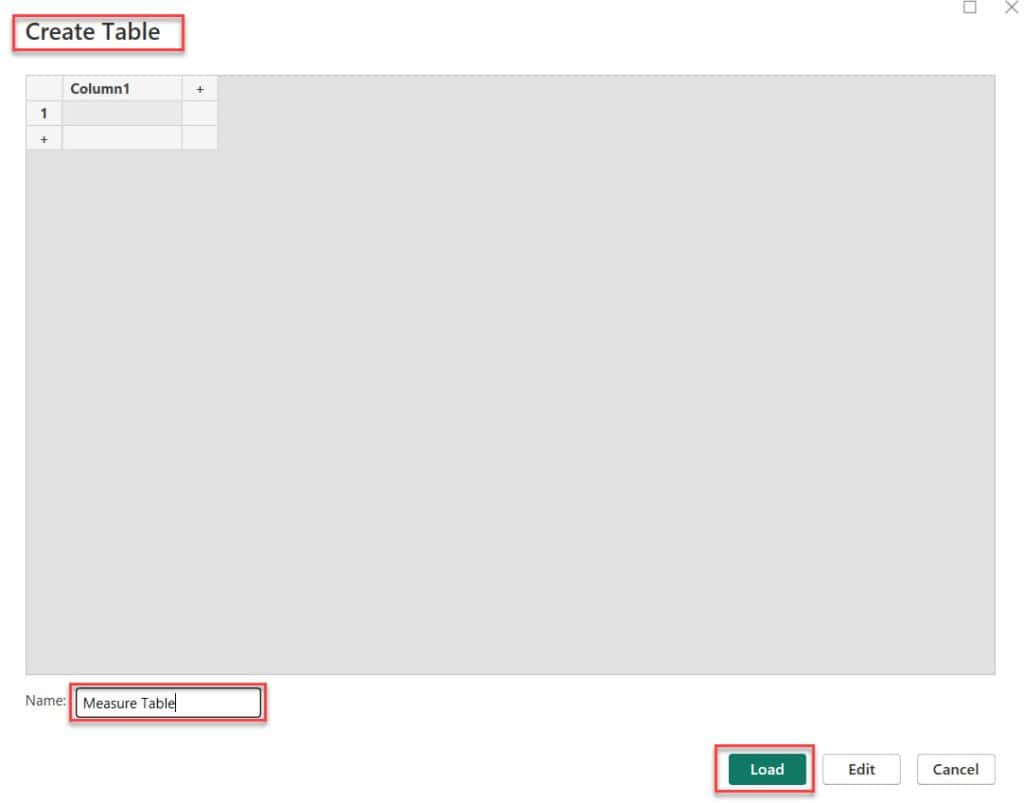
2. Under the Home tab, click Enter data.

3. In the Create Table window, type Measure Table as the name and click the Load button.
4. you can see one table created in the Data Panel.
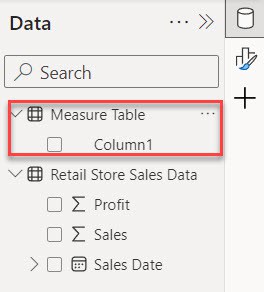
5. After that, select the Measure Table. Then, under the “Table tools” tab, click “New measure.”

6. In the formula bar, click the below expression. Then click Commit.
Total Sales = SUM('Retail Store Sales Data'[Sales])Where:
- Total Sales = This is the name we give to our measure. It represents the total amount of sales.
- SUM() = This DAX function adds all the values in a column. In this case, it adds up the Sales column.
- Retail Store Sales Data = This refers to the table’s name where the Sales column is present.
- Sales = This specifies the Retail Store Sales Data table column we want to summarize.

7. Then, one measure is created in the Data pane within the measure table.
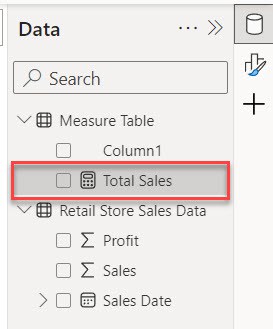
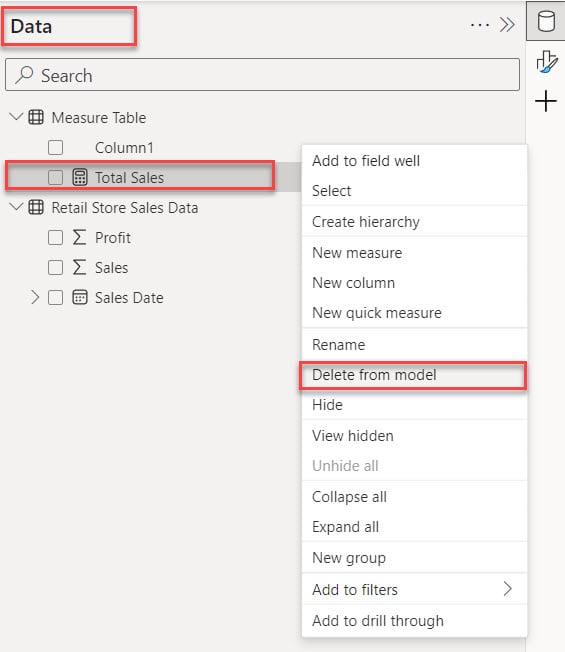
8. Under the Data pane, click Column1 -> then right-click. A box will pop up; inside it, click “Delete from the model.”
9. In the Data Pane, you will see that our Measure Table has been successfully created. Look for a small calculator icon on the left side of the table.
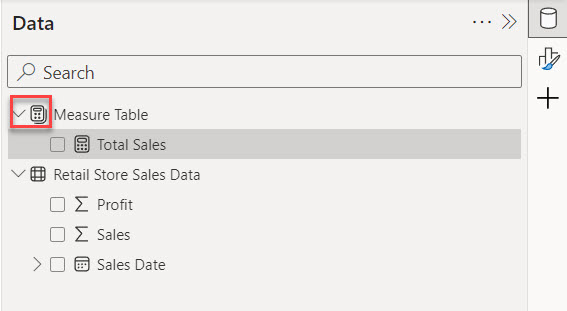
I hope you can easily create a measure table in Power BI using the above steps.
How to Add Measure into Measure Table in Power BI?
Follow the below steps to add the measure to the measure table in Power BI:
1. Select the Measure Table -> under the Table tools, click New measure.

2. In the formula bar, click the below expression. Then click Commit.
Average Sales = AVERAGE('Retail Store Sales Data'[Sales])Where:
- Average Sales = This is the name we give to our measure. It represents the average of sales.
- AVERAGE() = This is a DAX function that calculates the arithmetic mean of a set of numbers.
- Retail Store Sales Data = Refers to the table name where the sales data is stored.
- Sales = Represents the column containing the sales data.

3. After that, you see in the Data pene the Average Sales(Measure) added. Check the screenshot below.
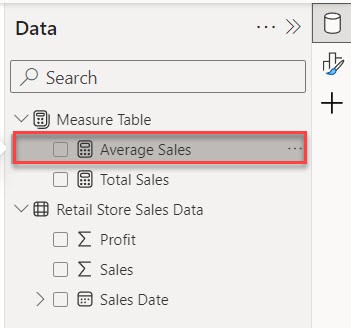
This way, you can add measures in the Power BI measure table.
How to Use Measure Table in Power BI
This example shows how to use the measure table in Power BI visualization.
I hope you create a measure table in your Power BI Desktop.
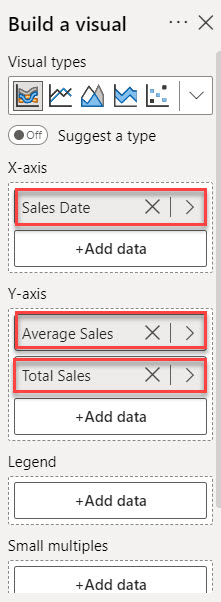
1. Under the Home tab, expand Visual gallery(black box) -> Click the Ribbon chart.

2. Then, using the +Add data option, add Sales Date into the X-axis and Average Sales and Total Sales into the Y-axis.
3. After that, you can see our Ribbon chart created successfully.
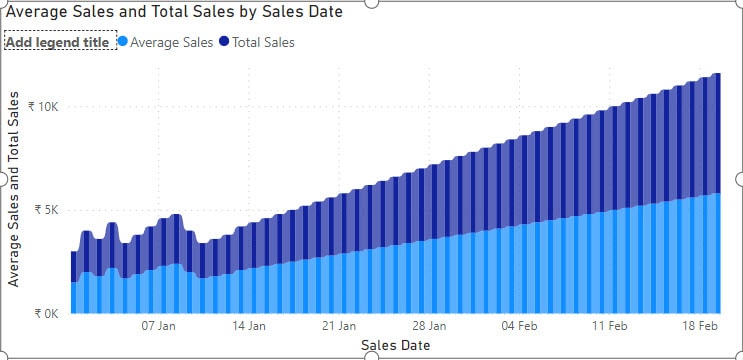
This way, you can use the measure table in any Power BI visualization.
Power BI Move Measure to Measure Table
In this example, we first create a measure in a different table. Then, we move it to the measure table in Power BI.
At this point, I hope you all have created the measure table. Now, follow these steps:
1. Select another table (Retail Store Sales Data) -> under the Table tools, click New measure.

2. In the formula bar, click the below expression. Then click Commit.
Profit Margin =
DIVIDE(
		SUM('Retail Store Sales Data'[Profit]),
		SUM('Retail Store Sales Data'[Sales])
	)
Where:
- Profit Margin = This is the measure’s name that stores profit margin value.
- SUM(‘Retail Store Sales Data'[Profit]) = This formula calculates the total profit by adding all the values in the ‘Profit’ column of the ‘Retail Store Sales Data’ table.
- SUM(‘Retail Store Sales Data'[Sales]) = This formula calculates the total sales by adding all the values in the ‘Sales’ column of the ‘Retail Store Sales Data’ table.
- DIVIDE() = This function divides the result of the first part (total profit) by the result of the second part (total sales).

3. Now, please navigate to the Data pane and select the measure, such as Profit Margine, in my case.
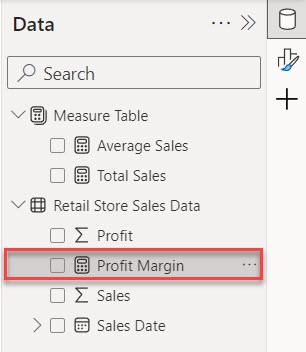
4. Under the Measure tools, expand the Home table and select Measure Table.

5. You will notice that the selected measure (Profit Margin) has been successfully moved to the Measure Table under the Data pane.
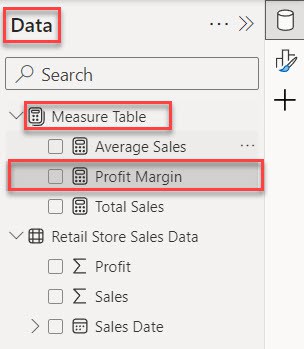
This way, you can move measure one table to measure table in Power BI.
Conclusion
I hope you understand the benefits of using a measure table in Power BI.
This tutorial covered a Power BI measure table, how to create a measure table in Power BI, and how to add measures to it.
Additionally, we learned how to utilize the measuring table in Power BI visualizations and move measures from one table to the measuring table in Power BI.
Also, you may like some more Power BI articles:
I am Bijay a Microsoft MVP (10 times – My MVP Profile) in SharePoint and have more than 17 years of expertise in SharePoint Online Office 365, SharePoint subscription edition, and SharePoint 2019/2016/2013. Currently working in my own venture TSInfo Technologies a SharePoint development, consulting, and training company. I also run the popular SharePoint website EnjoySharePoint.com