Do you know how to center values in Power BI Table? With the help of Specific column Alignment formatting, we can achieve this. One of the important formatting options in a table visual is text alignment in Power BI.
This tutorial teaches us how to center values in the Power BI table visual and how to hide a column in the Power BI table visual.
Power Bi Center Align Values in Table
This example shows how to center values in the Power BI table visual.
Example:
Imagine you are presenting a report in Power BI with a table showing sales figures. Centering values in the table ensures that they’re neatly aligned, making it easier for your audience to read and understand the data.
Here, we have a SharePoint list that contains below columns with various data types:
| Columns | Data Types |
|---|---|
| City | Single line of text |
| Category | Single line of text |
| Sub-Category | Single line of text |
| Product Name | Single line of text |
| Sales | Currency |
| Quantity | Number |
| Profit | Currency |
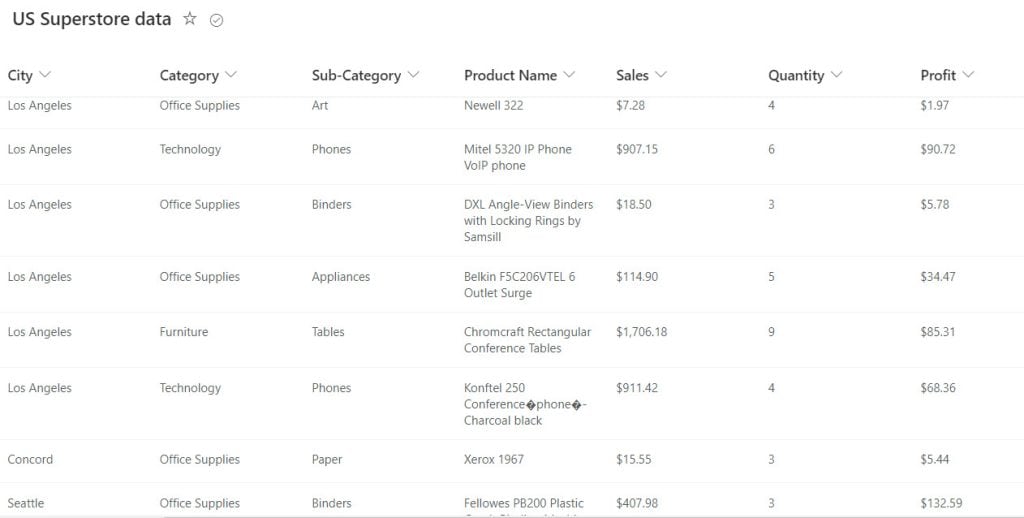
To do Power BI table center values, follow the below steps:
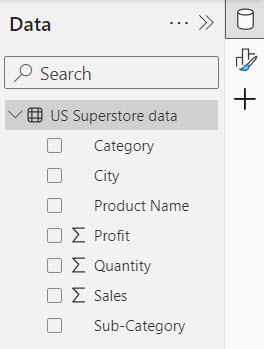
1. Open Power BI Desktop and load data using the Get data option. Then, we can see the data set in the Data Panel.
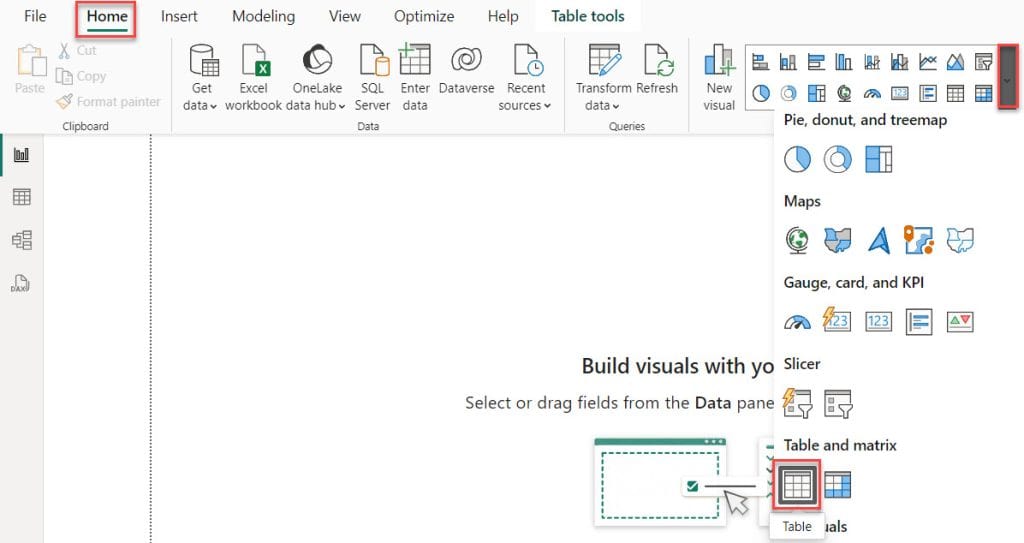
2. Under the Home tab, expand Visual gallery(black box) -> Click the Table visual.
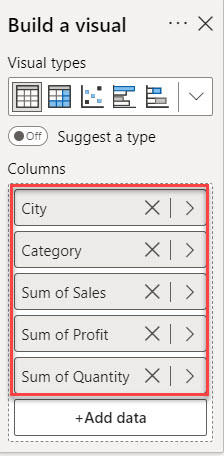
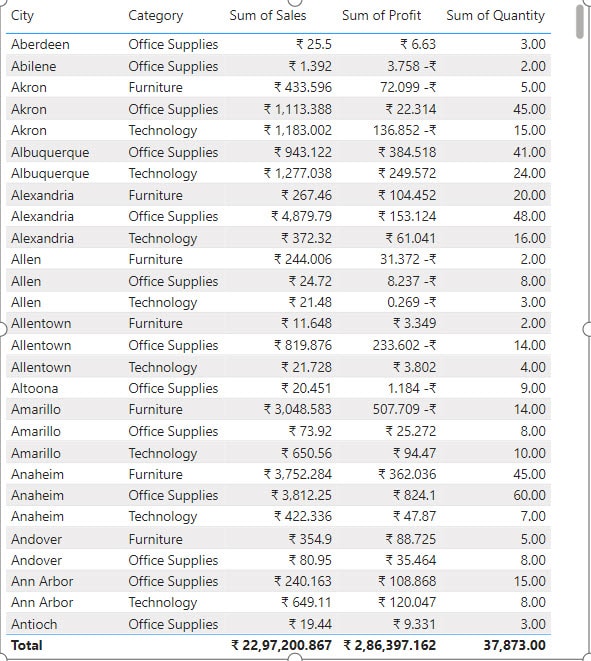
3. Then, using the +Add data option, add City, Category, Sales, Profit, and Quantity in the Column field.
4. Now you can see that our table has been completed.
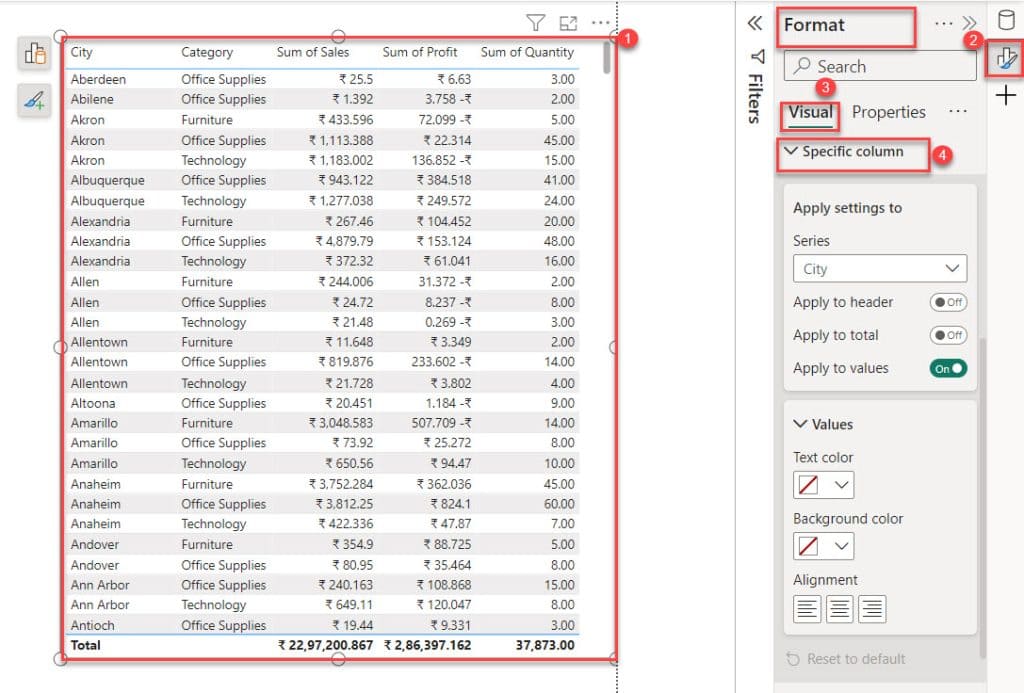
5. Select the table visual -> Click the Format Pane -> click Visual -> Expand Specific column.
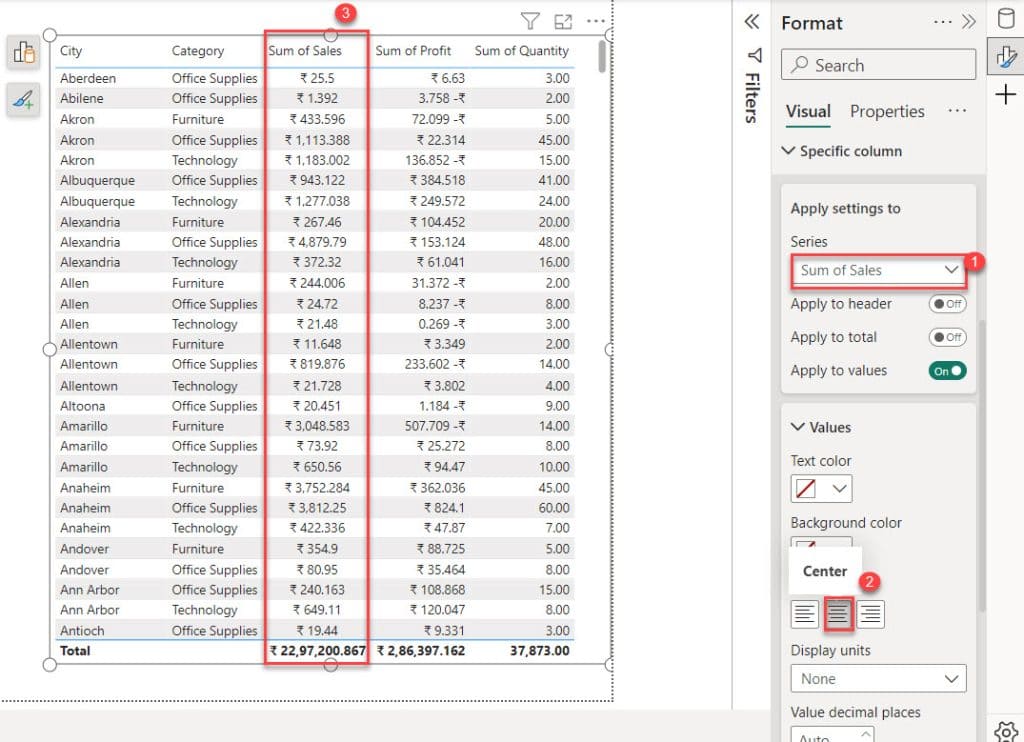
6. Now, choose which series/column you want to apply the alignment. In my case, I choose ‘Sales‘ and click on center alignment.
7. In the same way, you can apply City, Quality and Profit value. Check the Screenshot below.
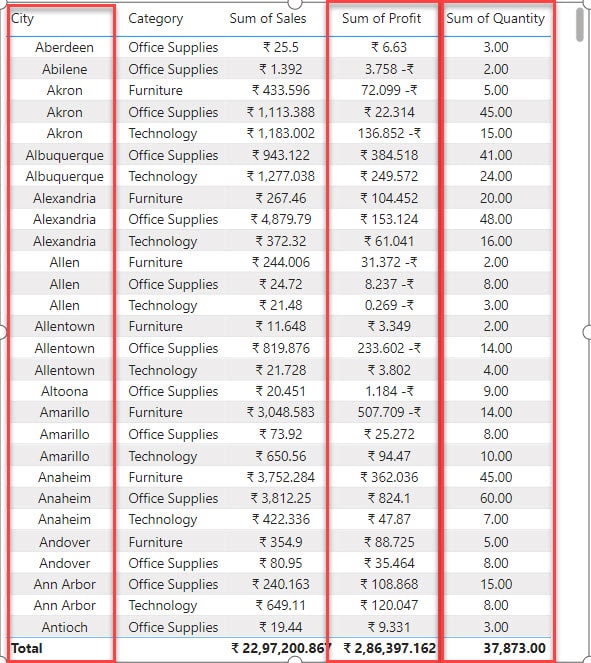
In the same way, if you want to center-align column headers, you can do so by using column header formatting.
Hide a Column in Power BI Table Visual
Now we see how to hide a column in the Power BI table visual. To do this, follow the below steps:
I hope you created a Power BI table visual.
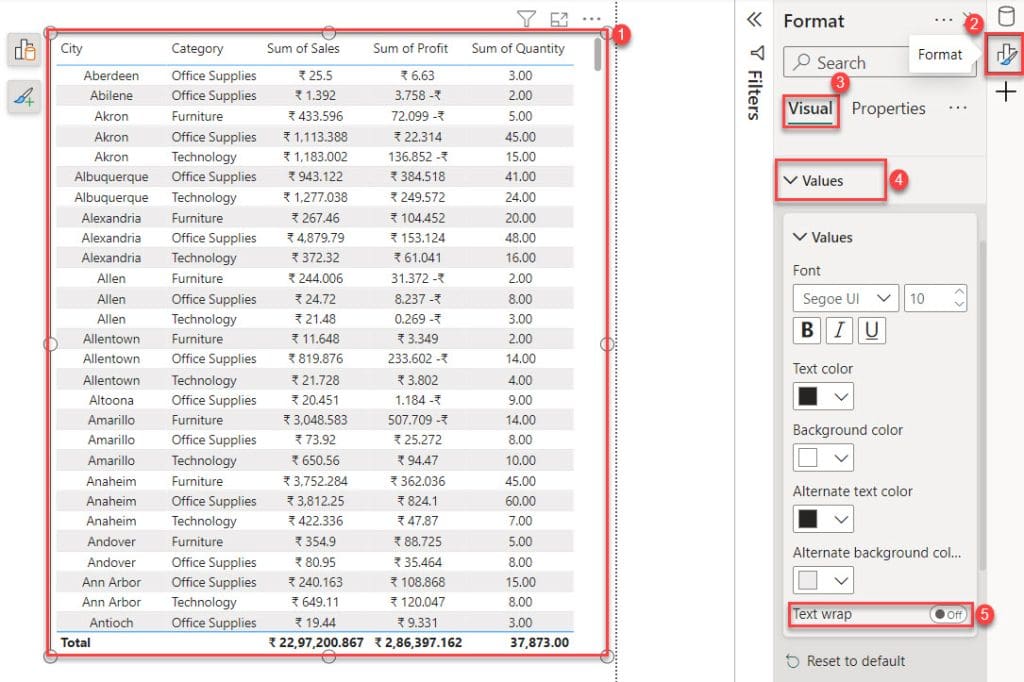
1. Select the table visual -> Click the Format Pane -> click Visual -> Expand Values -> disable Text wrap.
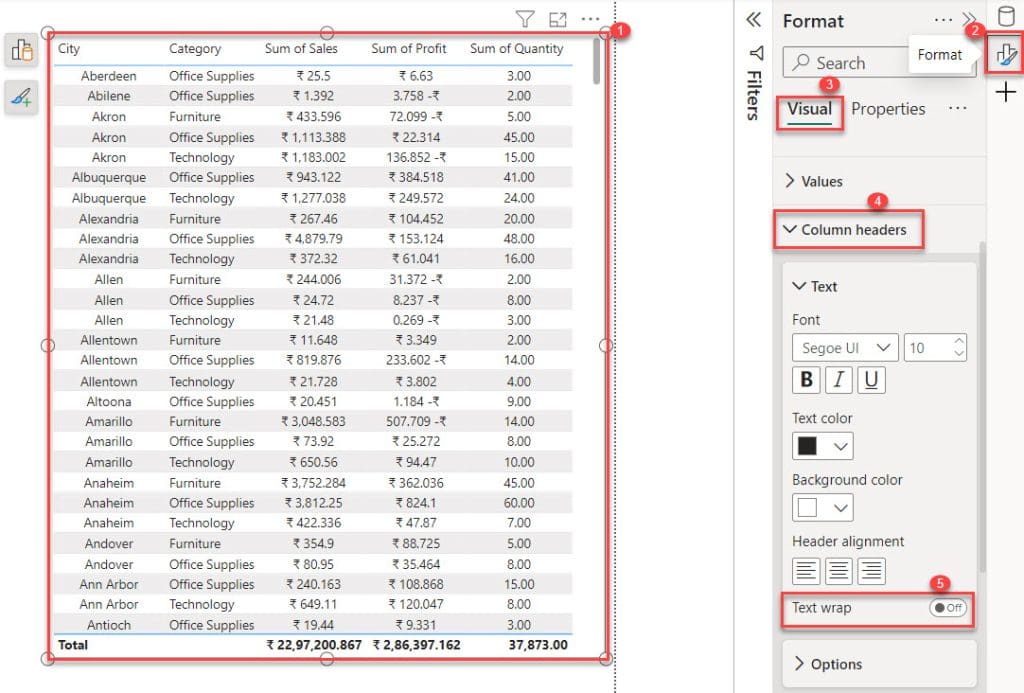
2. Next, Select the table visual -> Click the Format Pane -> click Visual -> Expand Column headers -> Disable Text wrap.
3. Move your mouse cursor over the column header you want to hide. Move your mouse to the right until it changes to two diverging arrows. Click and drag to the left until the column hides.
Following the above steps, you can hide any column in the Power BI table visual.
Conclusion
I hope this tutorial has been helpful for you in understanding value alignment. I have explained how to center values in the Power BI table visual and how to hide a column in the Power BI table visual.
You may also like:
I am Bijay a Microsoft MVP (10 times – My MVP Profile) in SharePoint and have more than 17 years of expertise in SharePoint Online Office 365, SharePoint subscription edition, and SharePoint 2019/2016/2013. Currently working in my own venture TSInfo Technologies a SharePoint development, consulting, and training company. I also run the popular SharePoint website EnjoySharePoint.com