In this Power bi tutorial, we will discuss how to sort slicer by measure in Power BI.
We will see a few examples of sort slicer by measure in power bi.
If you are new to power bi measure, check out an article on How to create a measure in Power BI and Power bi measure examples (20 useful examples)
Sort the slicer by measure in Power BI
Let us see how we can sort the Power bi slicer visual by measure in the Power Bi report.
In this example, we are going to use the sales table data, to sort the data based on the slicer visual by measure in Power Bi.
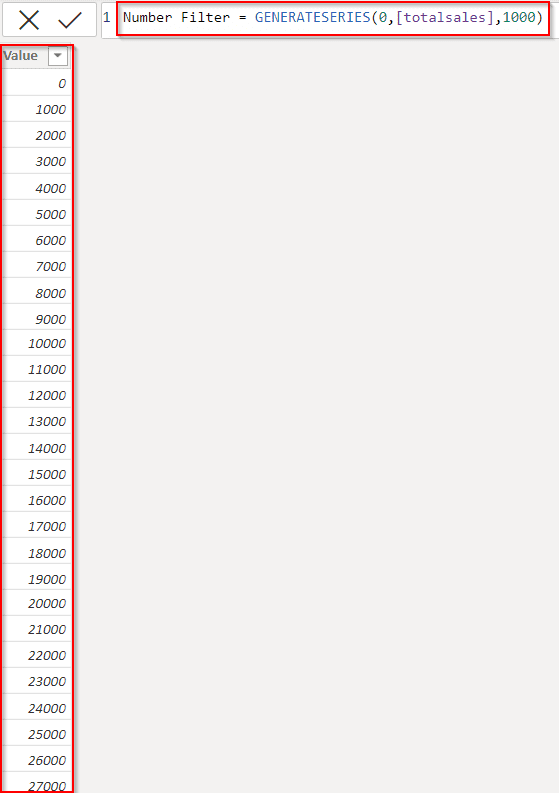
- Initially, Open the Power Bi desktop, and load the data into it using the get data option. Once the data has been loaded, create a new table under the modeling tab and apply the below measure formula.
Number Filter = GENERATESERIES(0,[totalsales],1000)Where,
- Number Filter = New Table Name
- GENERATESERIES = Function name
- In the below screenshot, we can see that the new table generates the series starting from 0 till the maximum total sales value by incrementing 1000.
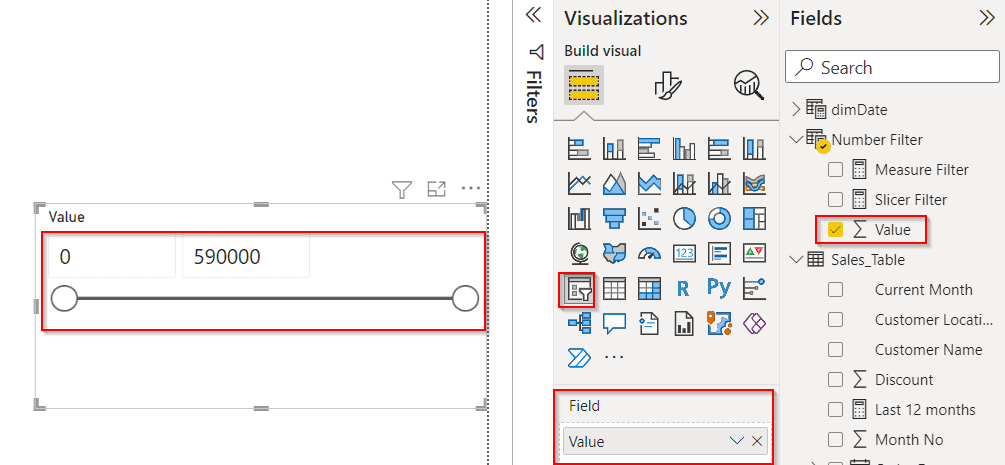
- Now in the Power bi report section, select a slicer visual and drag and drop the Value field from the field pane as below:
- We can see that the slicer displays the value from 0 to the maximum sales value count.
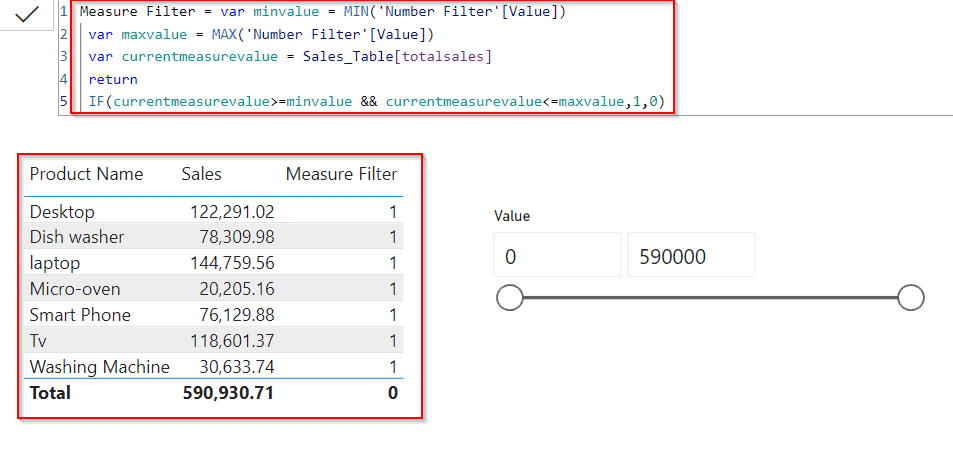
- Now create a new measure to filter the table values, for that select the new measure option under the modeling tab and apply the below formula:
Measure Filter = var minvalue = MIN('Number Filter'[Value])
 var maxvalue = MAX('Number Filter'[Value])
 var currentmeasurevalue = Sales_Table[totalsales]
 return
 IF(currentmeasurevalue>=minvalue && currentmeasurevalue<=maxvalue,1,0)
Where,
- Measure Filter = New Measure name
- min value, max value, currentmeasurevalue = Variable names
- Sales_Table = Table Name
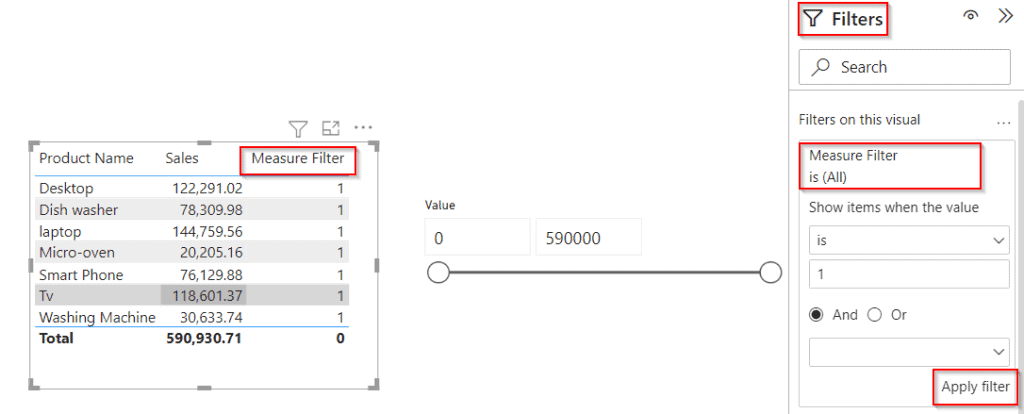
- Now expand the filter pane and add the date field as the created measure value and condition to show the value if the items have the value as 1 and click on the apply filter option as below:
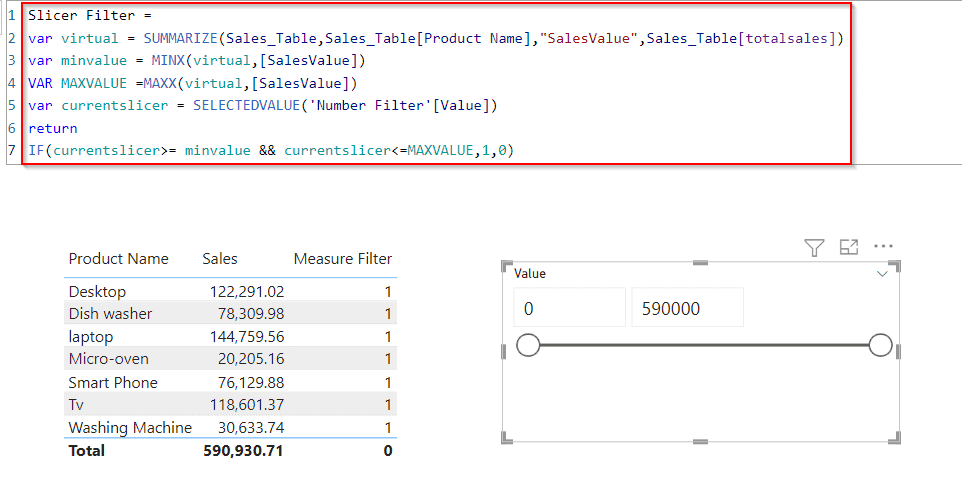
- In the same way, create another measure for the slicer visual to sort the values. select the new measure option under the modeling tab and apply the below formula:
Slicer Filter =
var virtual =
 SUMMARIZE(Sales_Table,Sales_Table[Product Name],"SalesValue",Sales_Table[totalsales])
var minvalue = MINX(virtual,[SalesValue])
VAR MAXVALUE =MAXX(virtual,[SalesValue])
var currentslicer = SELECTEDVALUE('Number Filter'[Value])
return
IF(currentslicer>= minvalue && currentslicer<=MAXVALUE,1,0)
Where,
- Slicer Filter= New Measure name
- min value, max value, virtual, current slicer = Variable names
- Sales_Table = Table Name
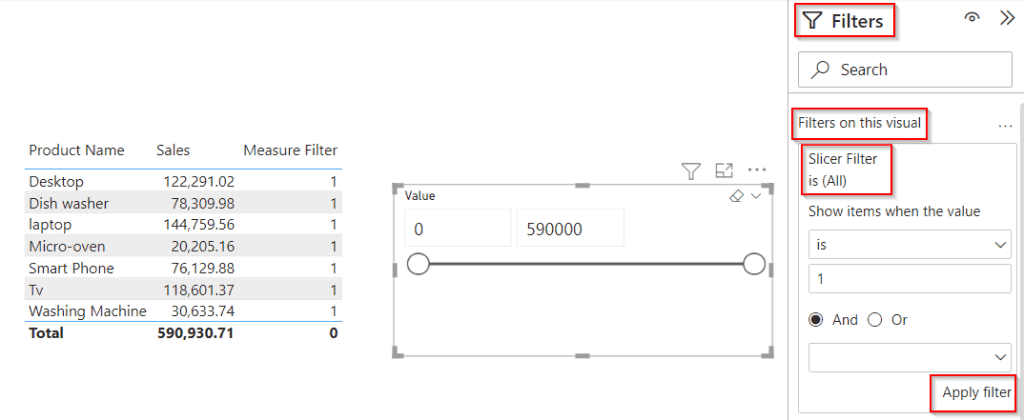
- Now select the slicer visual and expand the filter pane and add the date field as the created slicer filter measure value and condition to show the value if the items have the value as 1 and click on the apply filter option as below:
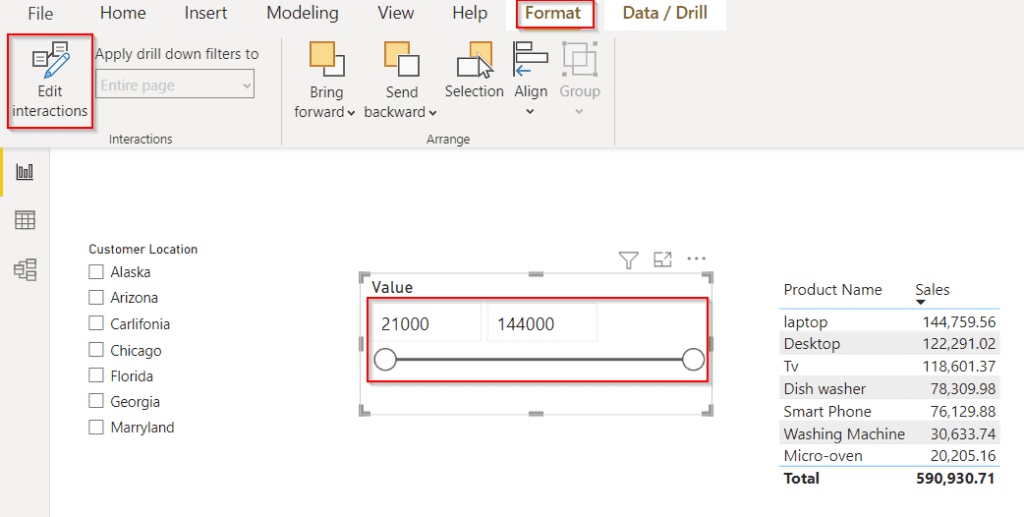
- And now select the slicer visual, and under the Format, option chooses Edit interactions to interact with other visuals presented in the Power Bi report.
- Now in the report section, you can see that the slicer visually displays the value based on the created measure for the selected customer location.
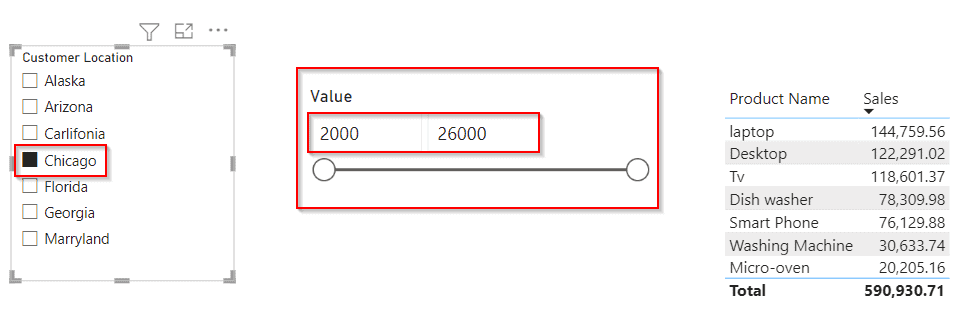
- In the below screenshot, you can see that visual filters and displays the value based on the slicer selections sales range value for the selected customer location.
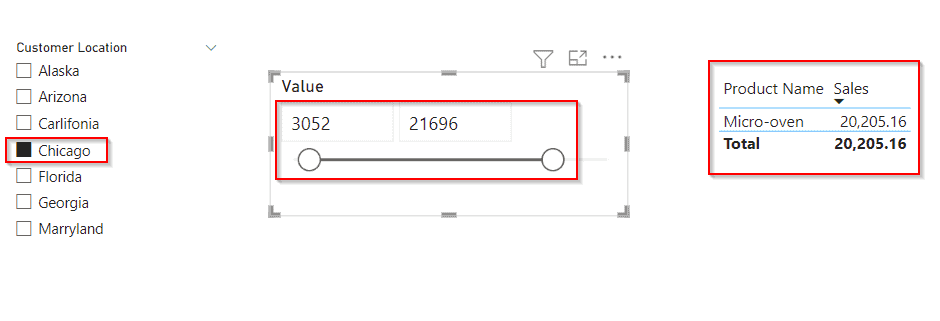
- In the same way, if we select any other location, the slicer visually sorts the minimum and maximum value for the selected customer location based on the created measure value.
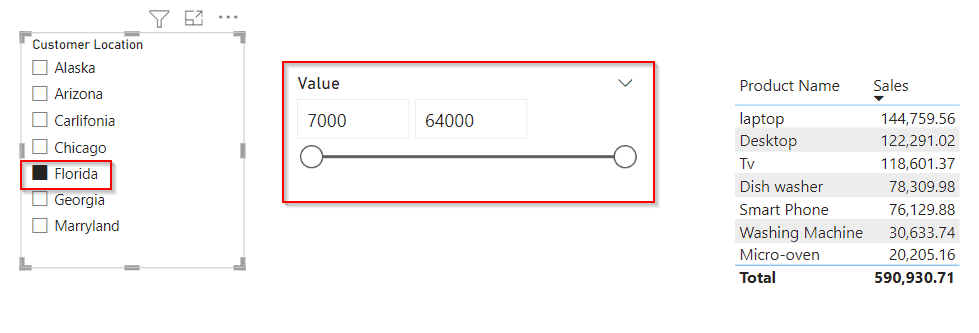
The screenshot below, filters and displays the data based on the slicer selection.

This is how to sort a Power bi slicer visual by measure in a Power Bi report.
This Microsoft Power Bi article described how to sort slicers by Power Bi measure in a Power Bi report.
You may like the following Power BI tutorials:
- How to sort slicer by another column in Power BI
- Power BI Slicer Sort Descending
- Power BI Date slicer only shows dates with data
- Power BI Date Slicer By Month
- How to Add a Dropdown Slicer in Power BI
I am Bijay a Microsoft MVP (10 times – My MVP Profile) in SharePoint and have more than 17 years of expertise in SharePoint Online Office 365, SharePoint subscription edition, and SharePoint 2019/2016/2013. Currently working in my own venture TSInfo Technologies a SharePoint development, consulting, and training company. I also run the popular SharePoint website EnjoySharePoint.com