In this Power bi article, we will discuss What Power Bi Count if is and how to work with Power Bi Count if true with examples in Power bi. And also, we will discuss the below points:
- Power bi count if true and false
- Power bi count rows if true
Power BI count if
- The Count if is a function used in Excel to count the values in the range based on the condition. In Power Bi, the Count if Function is not available.
- So, in Power bi, we can apply the same logic of the Count if function by using the CountAX function and CountRows function
Power Bi Syntax of CountAX function is :
COUNTAX(<table>,<expression>)Power Bi Syntax of CountRows function is :
COUNTROWS([<table>])Power bi count if true
Here we will discuss the Power bi count if true with an example. You can download the sample data table from here.
In this example, we will find the count of true values using the Power BI COUNTAX function in the Power Bi report.
- Open the Power bi desktop and then Load the data using the get data option, Click on the new measure from the ribbon in the power bi desktop.
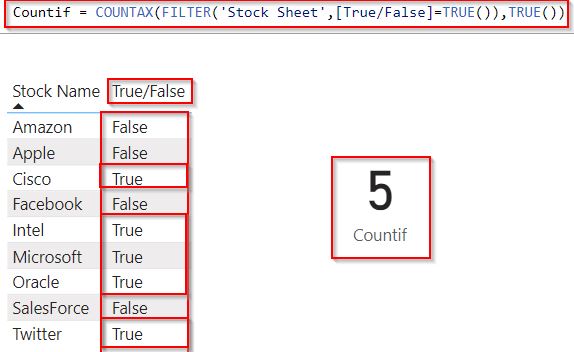
- Then apply the below measure formula to count the true values:
Countif = COUNTAX(FILTER('Stock Sheet',[True/False]=TRUE()),TRUE())Where,
- Countif = Measure name
- COUNTAX = Function name
- Stock Sheet = Table name
- True/False = Column name
- Now to see the output, select the table visual from the visualization pane. drag and drop the stock name and true/false field from the field pane.
- In the same way, select the card visual and drag-drop the created measure value. In the below screenshot, you can see that the card visually displays the number of true value counts.

This is how to work with the Power bi count if true in Power BI.
Power bi Count of True and False
Let us see how to work with the Power BI count of true and false count values using the Power Bi DAX Count function in Power BI.
In this example, we will create two measure values to find the total number of true values and false values presented in the table.
- Load the table data into the Power BI desktop using the get data option, once the data has been loaded. Click on the new measure under the modeling tab.
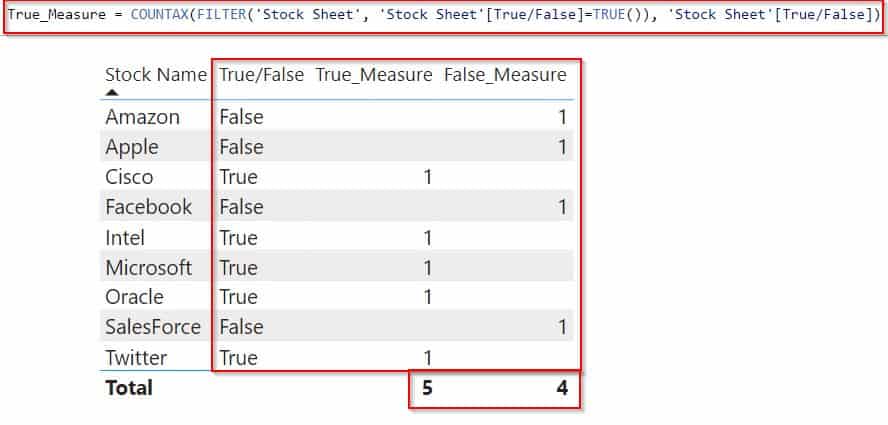
- In the measure formula bar, apply the below formula to check the true value count and click on the check icon.
True_Measure = COUNTAX(FILTER('Stock Sheet', 'Stock Sheet'[True/False]=TRUE()), 'Stock Sheet'[True/False])where,
- True_Measure = Measure name
- COUNTAX = Function name
- Stock Sheet = Table name
- True/False = Column name
In the same way, select another new measure and apply the below formula to check the false value count and click on the check icon.
False_Measure = COUNTAX(FILTER('Stock Sheet', 'Stock Sheet'[True/False]=FALSE()), 'Stock Sheet'[True/False])where,
- False_Measure= Measure name
- COUNTAX = Function name
- Stock Sheet = Table name
- True/False = Column name
- Now to see the output, select the table visual from the visualization pane. drag and drop the stock name and true/false field from the field pane. And also the created measure values into it.
- In the below screenshot, you can see that the True_measure returns the number of true value counts and the False_measure returns the number of false value counts presented in the existing column.

This is how to work with the Power BI count of true and false count values using the Power Bi DAX Count function in Power BI.
Power Bi Count Rows if True
Here we will see how to count rows if true using the count rows function in Power BI.
In this example, we will find the count of true values using the Power BI COUNT ROWS function in the Power Bi report.
- Log in to the Power bi desktop and then Load the data using the get data option, Click on the new measure from the ribbon in the power bi desktop.
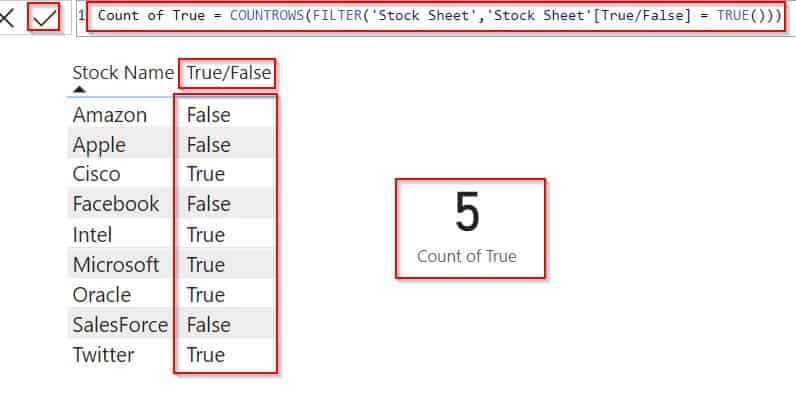
- Then apply the below measure formula to count the true values using the count row function:
Count of True = COUNTROWS(FILTER('Stock Sheet','Stock Sheet'[True/False] = TRUE()))Where,
- Count of True = Measure name
- COUNTAX = Function name
- Stock Sheet = Table name
- True/False = Column name
- Now select the table visual from the visualization pane. drag and drop the stock name and true/false field from the field pane.
- In the same way, select the card visual and drag-drop the created measure value. In the below screenshot, you can see that the card visually displays the number of true value counts.

This is how to count rows if true using the count rows function in Power BI.
In this Power bi article, we have discussed What Power Bi Count if is and how to work with Power Bi Count if true with examples in Power bi. And also, covered the below points:
- Power bi count of true and false
- Power bi count rows if true
You may also liek the following power bi tutorials:
- Power BI DAX ISBLANK vs ISEMPTY
- Concatenate with Space in Power BI
- Power BI Conditional Formatting Based on Measure
- Power Query Check If Text is Date
I am Bijay a Microsoft MVP (10 times – My MVP Profile) in SharePoint and have more than 17 years of expertise in SharePoint Online Office 365, SharePoint subscription edition, and SharePoint 2019/2016/2013. Currently working in my own venture TSInfo Technologies a SharePoint development, consulting, and training company. I also run the popular SharePoint website EnjoySharePoint.com