This Power BI tutorial will teach us to sum and display values using the group by function and how to sum values with the Power Query group by function.
Additionally, we will discuss the topics below:
- Power BI sum group by column
- Power BI sum group by DAX
- Power BI sum group by multiple columns
- Power BI: measure sum by group
- Power BI DAX sum group by with filter
Power BI Sum Group By Column
Imagine you’re an analyst for an online retail store. You want to understand your sales performance across different product categories. You have a SharePoint list with product details, such as category (e.g., Clothing, Electronics, Books, Beauty), Sales Quantity, and Sales Amount for each product.
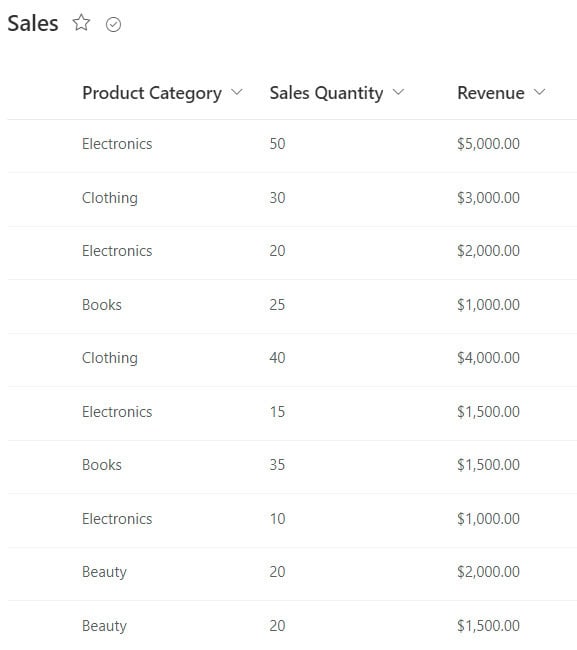
You want to calculate the total sales for each product category.
Now follow the below steps to do this:
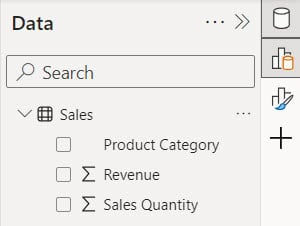
1. First, open Power BI Desktop and load the SharePoint list. Then, you will see the dataset in the Data pane.
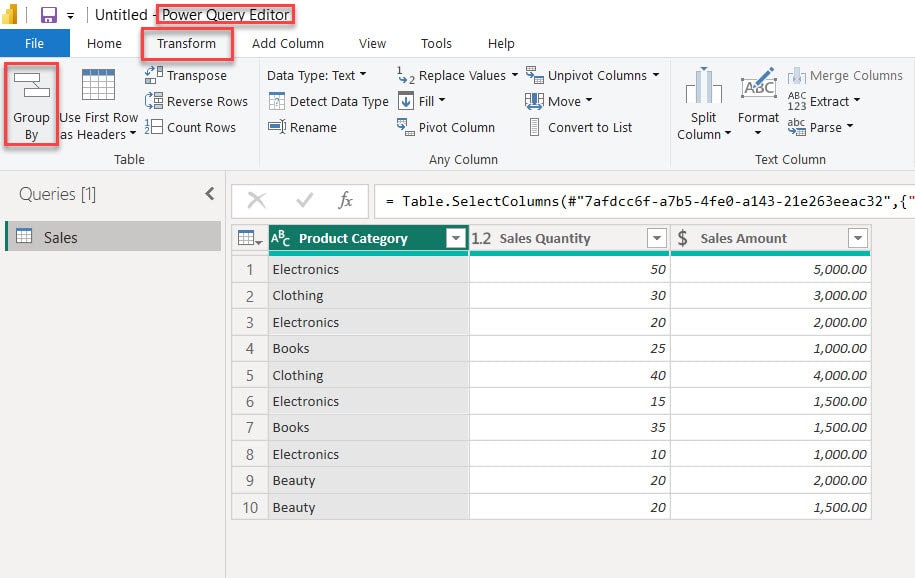
2. Under the Home tab, click Transform date.

3. Under the Transform tab, click the Group By option in the Power Query Editor.
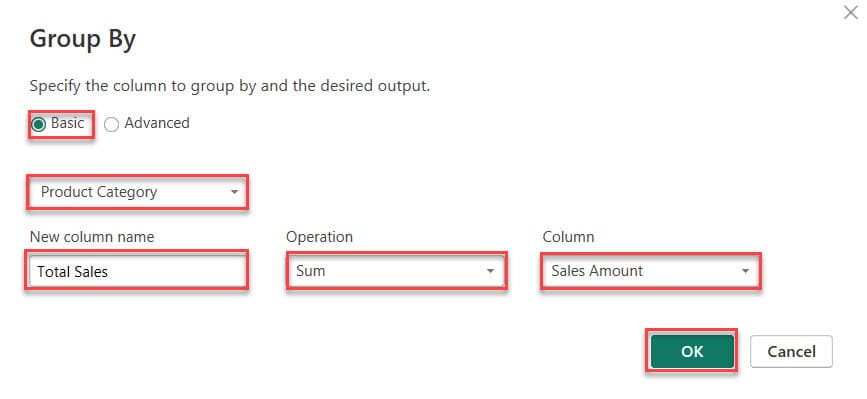
4. Once the Group By window opens, choose the “Basic” option. After that, select the “Product Category” columns. Next, name the column and choose “Sum” as the operation. Finally, select the “Sales Amount” column. Then click OK.
5. You can see the Total Sales value based on the Product category column using Power Query.
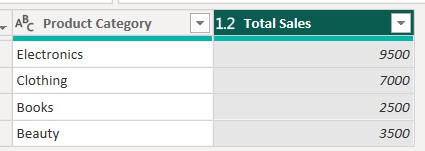
This is how to sum group by column in the Power BI.
Power BI Sum Group By using DAX
Suppose you are working as a Data Analyst at an IT company that sells various software and hardware products and provides some services. The company wants to analyze the sales performance of its products, specifically to understand the total sales amount for each product category.
According to this scenario, we have a dataset in Power BI. Please check the screenshot below.
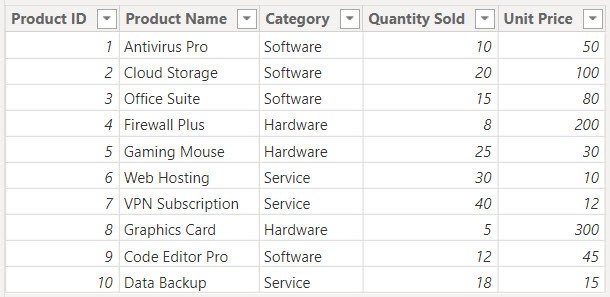
Now follow the below steps:
Navigate to the Table view and click “New table” under the Home tab.
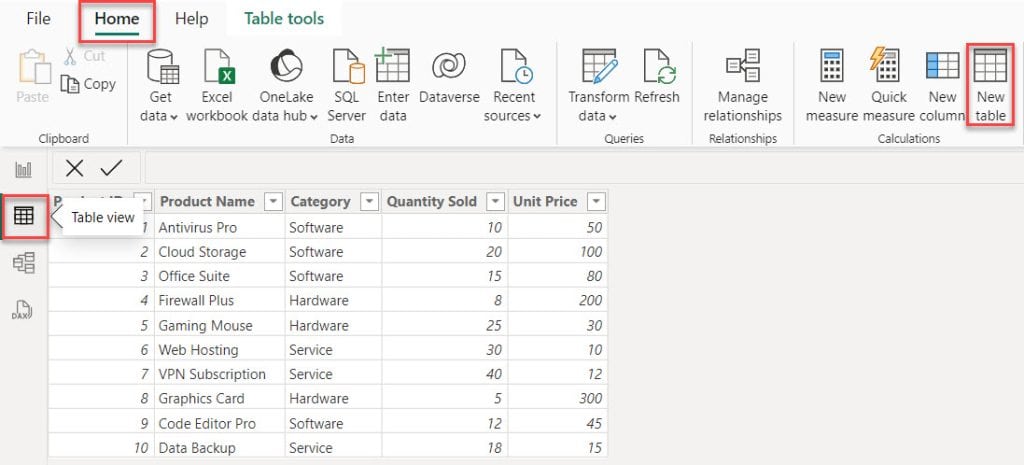
Then, in the formula bar, put the below DAX expression.
SalesSummary =
GROUPBY(
    'Product Sales',
    'Product Sales'[Category],
    "TotalSalesAmount", SUMX(CURRENTGROUP(), 'Product Sales'[Quantity Sold] * 'Product Sales'[Unit Price])
)
Where:
- SalesSummary = This part names the table we create, summarizing sales data by category.
- GROUPBY() = This function creates a summary table that groups data by one or more columns. It allows for custom aggregations within each group.
- ‘Product Sales'[Category] = This specifies the column by which we are grouping the data. In this case, it’s the ‘Category’ column from the ‘Product Sales’ table.
- “TotalSalesAmount” = This is the name of the new column we’re creating within each group. It will contain the total sales amount for that category.
- SUMX(CURRENTGROUP(), ‘Product Sales'[Quantity Sold] * ‘Product Sales'[Unit Price])= This part defines the calculation for the “TotalSalesAmount” column.
- SUMX() = This function performs row-by-row calculations and then summarizes the results.
- CURRENTGROUP() = This function returns the table that represents the current group being processed by GROUPBY.
- ‘Product Sales'[Quantity Sold] * ‘Product Sales'[Unit Price] = This multiplies the quantity sold by the unit price for each row in the current group to get the total sales amount for that row.

Then you can see in the table view a new table created.

This way, you can create a Power BI sum group by using DAX.
Power BI Sum Group By Multiple Columns
Imagine you’re running an e-commerce store and want to understand how sales perform across different regions and product categories. You want to calculate the total order amount for each region and product category combination.
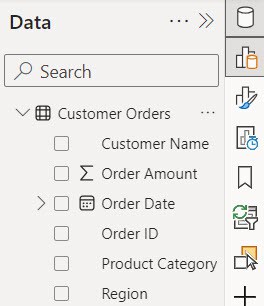
According to this scenario, a SharePoint list named Customer Orders contains the following columns. Check the screenshot below.
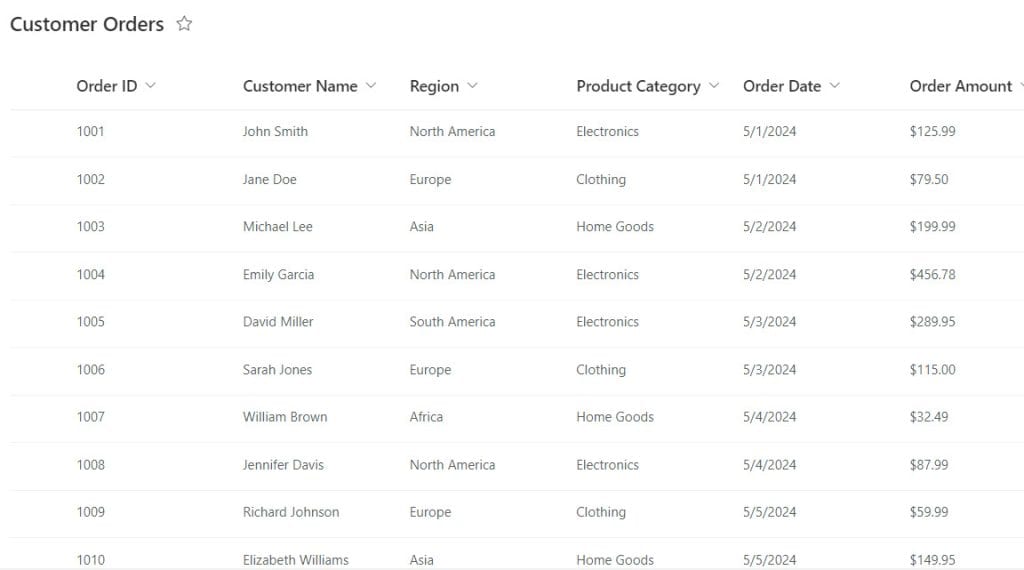
Now follow the below steps:
1. Open Power BI Desktop and load the above SharePoint List in Power BI Desktop. Then, you can see the data presented in the Data pane.
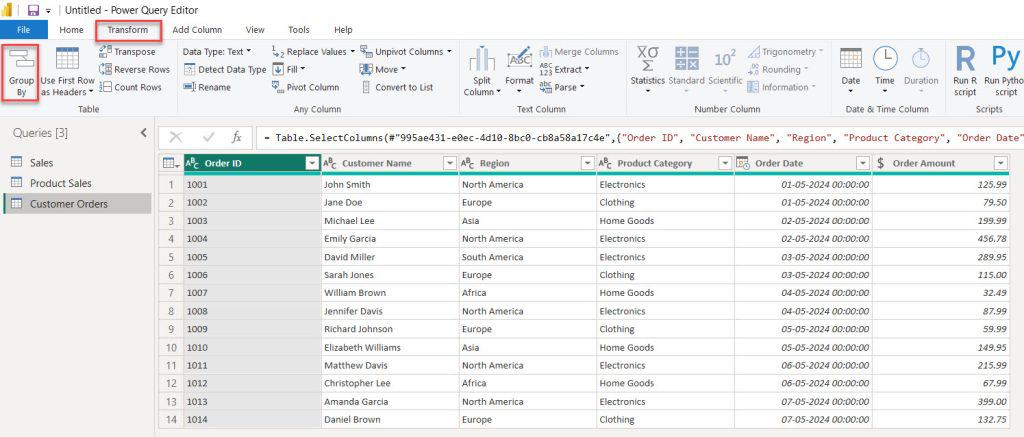
2. Under the Home tab, click Transform date.

3. In the Power Query Editor, under the Transform tab, click Group By.
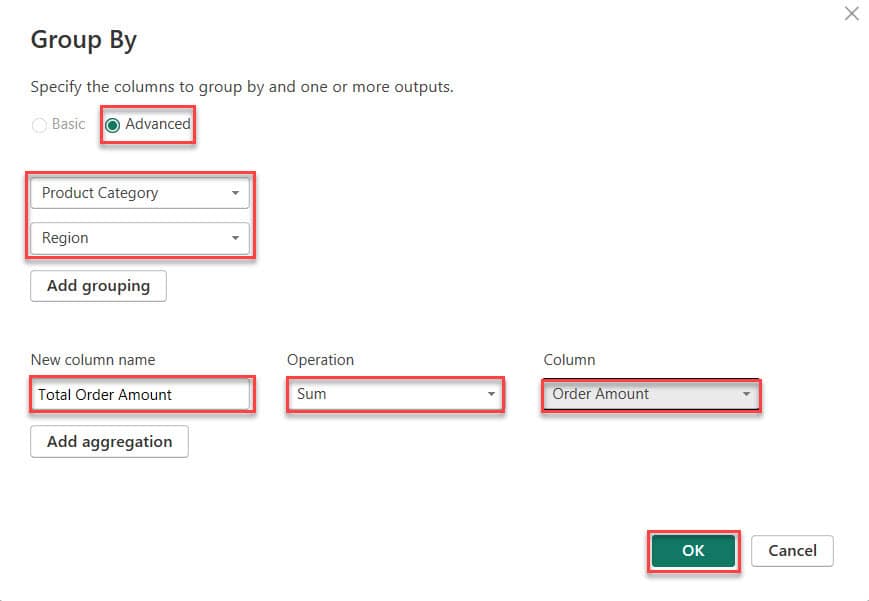
4. After opening the Group By window, click on “Advanced options,” select the “Product Category” column, add it as a grouping, and then choose the “Region” column. Enter a new column name, select “Sum” as the operation, and choose “Order Amount” as the column. Finally, click “OK.”
5. Now, in the screenshot below, you can see that the two columns are grouped and display the Total Order Amount.

This is how to sum and group by Multiple columns in Power BI.
Power BI Measure Sum by group
You can’t directly use the “Group By” function within a measure in Power BI because measures are designed to return single values, not tables with multiple rows and columns.
Instead, you typically use a combination of functions like SUMX, FILTER, and ALLEXCEPT to achieve a sum by group.
Example:
You have a table with sales data, and you want to calculate the sum of sales by category; you would create a measure that iterates over each row of the table, filters it based on the category, and then sums up the sales for that category.
You can use below DAX expression:
Total Sales by Category =
SUMX(
    VALUES('Sales'[Category]),
    CALCULATE(
        SUM('Sales'[SalesAmount]),
        ALLEXCEPT('Sales', 'Sales'[Category])
    )
)
Where:
- Total Sales by Category = This part names the measure we’re creating, representing each category’s total sales amount.
- SUMX() = This function iterates through a table and calculates a sum for each row.
- VALUES(‘Sales'[Category]) = This function returns a single-column table containing all the unique values from the ‘Category’ column in the ‘Sales’ table.
- CALCULATE(): This function evaluates an expression in a context modified by filters.
- SUM(‘Sales'[SalesAmount]): This calculates the sum of the ‘SalesAmount’ column in the ‘Sales’ table.
- ALLEXCEPT(‘Sales’, ‘Sales'[Category]): This removes all filters from the ‘Sales’ table except for the ‘Category’ column.
Power BI DAX Sum Group By with Filter
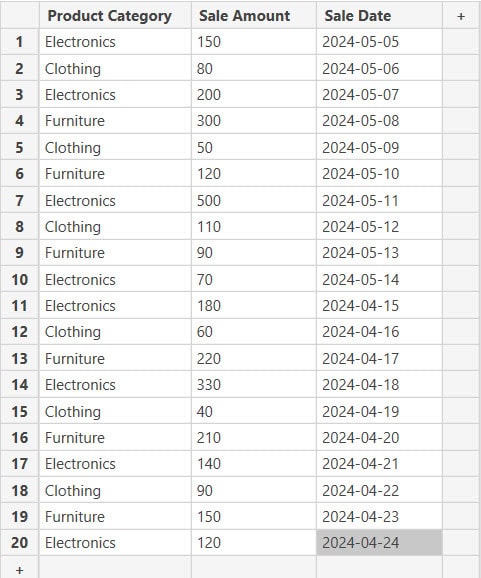
Imagine you are an analyst at a retail company. Your company has sales data, and you need to calculate the total sales for each product category only for the current month. You also need to include a filter to consider only sales where the amount is greater than 100.
To do this, follow the below steps:
1. Open Power BI Desktop, then under the Home tab, click Enter data.

2. Then the below Create Table dialog box will appear. We use the ‘+‘ symbols to add new columns and rows.
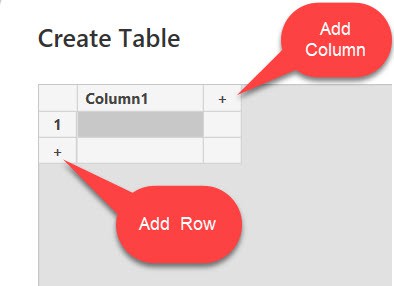
3. We can add data to the table by typing it into the grid.
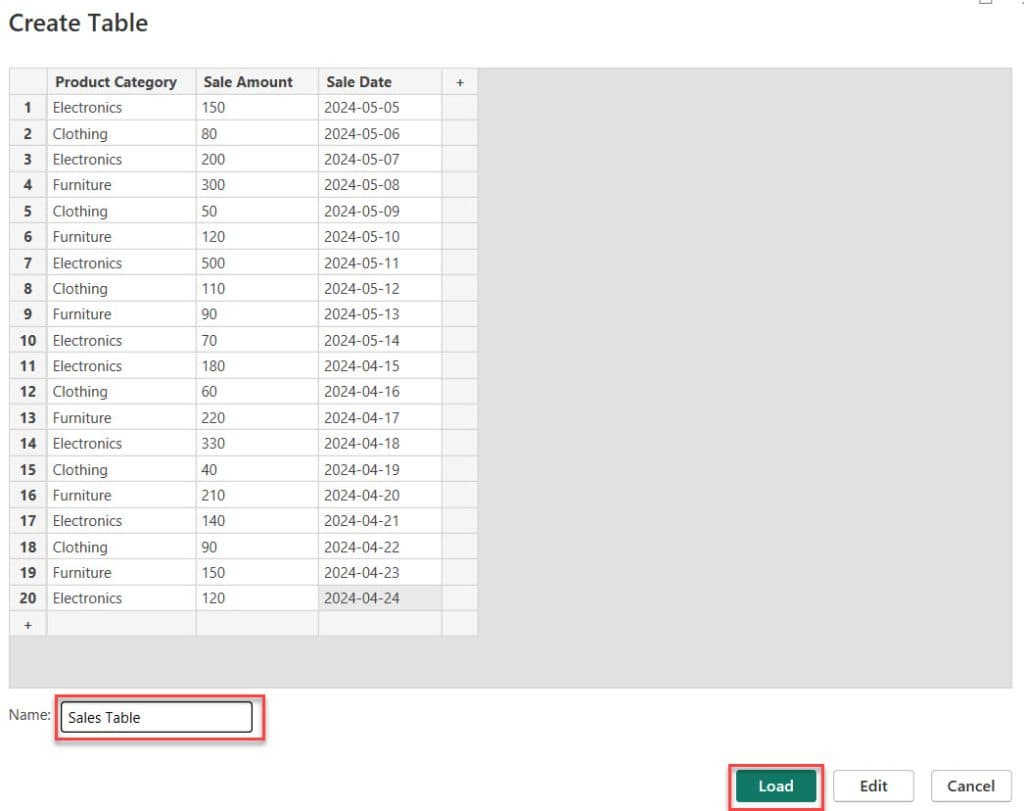
4. Now, our table is created. Then, specify the table name under the Name field and Click Load.
5. Go to the “Modeling” tab and click on “New Table.” In the formula bar, enter the following DAX expression:
FilteredSales =
FILTER(
    'Sales Table',
    'Sales Table'[Sale Date] >= DATE(YEAR(TODAY()), MONTH(TODAY()), 1) &&
    'Sales Table'[Sale Date] < DATE(YEAR(TODAY()), MONTH(TODAY()) + 1, 1) &&
    'Sales Table'[Sale Amount] > 100
)
Where:
- FilteredSales = This part names the table we create, representing the filtered sales data.
- FILTER() = This Filter() function returns a table that includes only the rows that meet the specified conditions.
- ‘Sales Table’ = This is the table we are filtering. It contains the sales data.
- ‘Sales Table'[Sale Date] >= DATE(YEAR(TODAY()), MONTH(TODAY()), 1) = This condition filters the rows to include only those where the ‘Sale Date’ is greater than or equal to the first day of the current month.
- ‘Sales Table'[Sale Date] < DATE(YEAR(TODAY()), MONTH(TODAY()) + 1, 1) = This condition filters the rows to include only those where the ‘Sale Date’ is less than the first day of the next month.
- ‘Sales Table'[Sale Amount] > 100 = This condition filters the rows to include only those where the ‘Sale Amount’ is greater than 100.

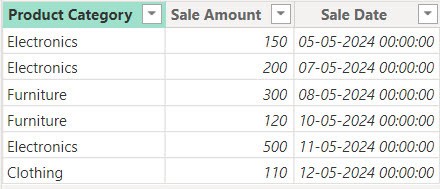
6. Then, you can see a table with sales greater than 100, all from the current month.
Now we create the GroupedSales table:
7. Go to the “Modeling” tab and click on “New Table.” In the formula bar, enter the following DAX expression:
GroupedSales =
GROUPBY(
    FilteredSales,
    FilteredSales[Product Category],
    "TotalSales", SUMX(CURRENTGROUP(), FilteredSales[Sale Amount])
)
Where:
- GroupedSales = This part names the table or expression we’re creating, which summarizes sales data by product category.
- GROUPBY() = This function creates a summary table that groups data by one or more columns. It allows for custom aggregations within each group.
- FilteredSales = This specifies the table we’re grouping, which is the previously filtered sales data.
- FilteredSales[Product Category] = This specifies the column by which we are grouping the data. In this case, it’s the ‘Product Category’ column from the ‘FilteredSales’ table.
- “TotalSales” = This is the name of the new column we’re creating within each group. It will contain the total sales amount for that category.
- SUMX(CURRENTGROUP(), FilteredSales[Sale Amount]) = This part defines the calculation for the “TotalSales” column.

8. You can see the Total Sales value based on the Product category column.

This way, you can calculate the Power BI Dax sum group with a filter.
This Power BI tutorial taught us how to sum and display values using the group by function, including its application in Power Query. We also discussed utilizing DAX for summing with group by, summing with group by across multiple columns, measuring sums by group, and applying DAX sum group by with filters.
You may also like the following tutorials:
- Power BI Count Group by
- Power BI Group by Column
- Power BI Group by Measure
- Merge Columns in Power BI
I am Bijay a Microsoft MVP (10 times – My MVP Profile) in SharePoint and have more than 17 years of expertise in SharePoint Online Office 365, SharePoint subscription edition, and SharePoint 2019/2016/2013. Currently working in my own venture TSInfo Technologies a SharePoint development, consulting, and training company. I also run the popular SharePoint website EnjoySharePoint.com
Quite honestly, PowerBI is by far the greatest piece of on this planet. Everything is so super complicated and those bloody mf’s over at MS have not spent one second thinking about user experience. Things I can do in tools like KNIME in secs take extensive formulas in PowerBI. Hate this tool from the depth of my heart. How can you promote such a bunch of bs?