Are you interested in learning how to filter the table data based on the Power BI DAX IF condition? Then this Microsoft Power BI tutorial will guide you to filter the data using the Power BI DAX Filter function in Power BI.
Recently I was working with the Power BI report, where I needed to filter the data using the Power Bi Dax filter if function.
Also, we will see below more examples related to the Power BI Dax filter if functions:
- How to filter values with multiple conditions using Power BI Dax Filter if
- Working with Power BI DAX filter true false
- How to work with Power BI DAX filter if contains text
- How to check if no filter is selected Power BI DAX
- Working with Power BI DAX if statement with filter
- What is Power BI DAX if filter selected
Power BI DAX filter multiple conditions
Let us see how we can use filter multiple conditions using the Power Bi Dax filter function in Power Bi.
In this example, we use the sales table to apply multiple filters to obtain the desired sum value of sales based on the filter condition.
- Open the Power Bi desktop and load the table data into it, From the ribbon click on the new measure option and apply the below formula:
Multiple filter conditions = CALCULATE(
SUM('Sales_Table'[Sales]),
FILTER('Sales_Table',Sales_Table[Product Name] in {"Laptop", "Desktop"
}),
FILTER('Sales_Table','Sales_Table'[Customer Location] in {"Marryland", "Florida"})
)
Where,
- Multiple filter conditions = Measure name
- Sales Table = Table name
- Sales, Product Name, Customer Location = Column names
- Now, in the report section, select the table and card visual from the visualizations.
- In the table visual, drag and drop the Product name, Customer location, and sales value from the field pane, and in the visual card drag and drop the created Measure value.
- The screenshot below shows that the card visually displays the filtered value based on the multiple filters condition applied.
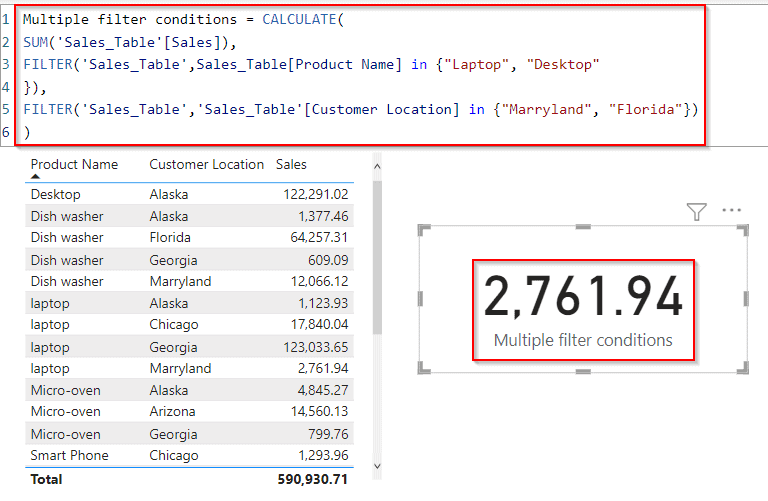
This is how to use filter conditions using the Power Bi Dax filter function in Power Bi.
Also Read: Power BI Dax Filter [With 15+ Examples]
Power BI DAX filter true false
Let us see how we can use the filter function to check the true or false value based on the condition in Power Bi.
In this example, we use the Vehicles table data to apply filters to obtain the result value as true or false based on the filter condition.
- Open the Power Bi desktop and load the table data into it, From the ribbon click on the new measure option and apply the below formula:
SUM Value =
VAR total =
    CALCULATE(
        SUM(Cars[Price]),
        FILTER(ALLSELECTED(Cars),
            IF(
                CONTAINSSTRING(LOWER(Cars[Car Names]),"Ford") ||
                CONTAINSSTRING(LOWER(Cars[Car Names]),"Audi"), "True", "False"
            )
        )
    )
RETURN
 IF ( total > 1000000, "True", "False" )
Where,
- SUM Value = Measure name
- total = Variable name
- Cars = Table name
- Car Names, Price = Column name
- Now in the report section, select the table visual from the visualizations.
- In the table visual, drag and drop the Car name, Model, price from the field pane, and the created Measure value.
- The screenshot below shows the filtered value based on the condition applied as either car names called Ford or Audi and displays the true or false value based on the condition applied.
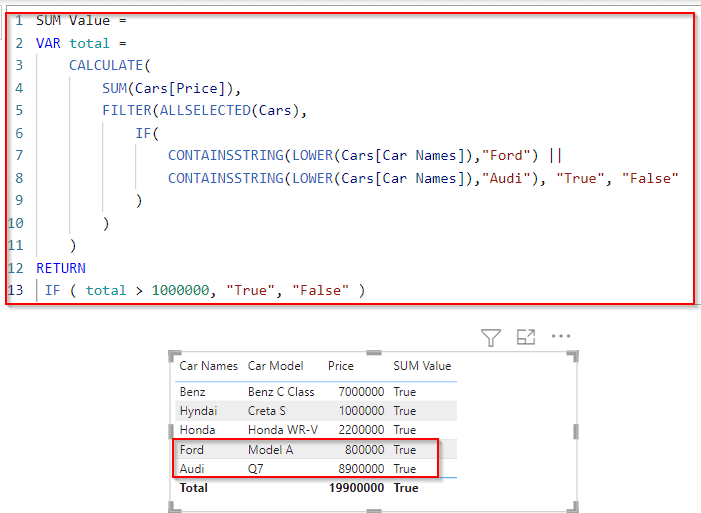
This is how to use the filter function to check the true or false value based on the condition in Power Bi.
Check out: Power Query Add Column Date [15 Examples]
Power BI DAX filter if contains text
Let us see how we can filter the table data value using the contains string and Power Bi Dax filter function in Power bi.
In this example, we will use the vehicle table data, we will calculate the car price value by passing the text or string value of the car names to filter the value based on the text or string contains.
- Open the Power Bi desktop and load the table data into it, From the ribbon click on the new measure option and apply the below formula:
SUM Value =
VAR total =
    CALCULATE(
        SUM(Cars[Price]),
        FILTER(ALLSELECTED(Cars),
            IF(
                CONTAINSSTRING(LOWER(Cars[Car Names]),"Ford") ||
                CONTAINSSTRING(LOWER(Cars[Car Names]),"Audi"), "True", "False"
            )
        )
    )
RETURN
 total
Where,
- SUM Value = Measure name
- total = Variable name
- Cars = Table name
- Car Names, Price = Column name
- Contains string = function name
- Now in the report section, select the table visual from the visualizations.
- In the table visual, drag and drop the Car name, Model, price from the field pane, and the created Measure value.
- The screenshot below shows that the card visually displays the filtered value based on the condition applied as either car names called Ford or Audi and displays the true or false value based on the condition applied.
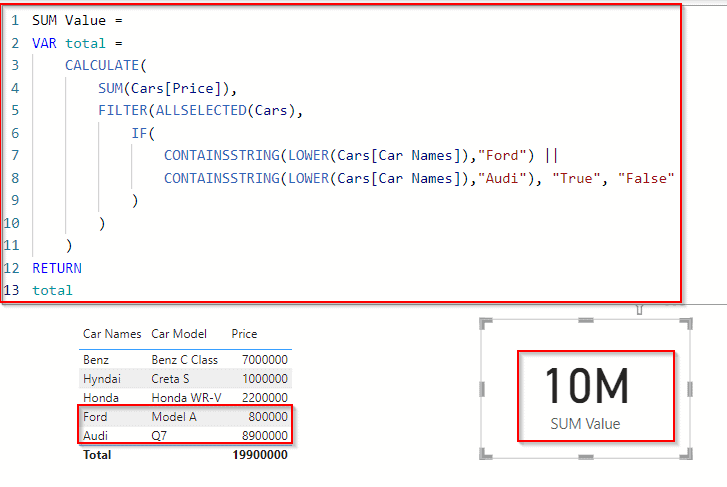
This is how to filter the table data value using the contains string and Power Bi Dax filter function in Power bi.
Have a look: Power Query Add Column If Statement
If no filter is selected Power BI DAX
Let us see how we can display nothing selected in the filter, using the Power Bi Dax filter function in Power BI.
In this example, we will create two measures to check the no filter selected in the filter in Power BI.
- Initially, open the Power BI desktop and load the data into the Power BI desktop, and from the ribbon click on the new measure option and apply the below formula:
Flag =
ISFILTERED ( Cars[Car Model] )
Where,
- Flag = Measure Name
- ISFILTERED = function name
- Cars = Table name
- Car Model = column name
- Now in the report section, select the slicer visual from the visualizations, and drag and drop the Car Model from the field pane.
- Now create another measure and add the below-mentioned formula to check the no filtered value.
Check NoFilter =
IF ( [Flag], SUM (Cars[Price] ), "NO Filter Selected" )
Where,
- Check NoFilter = Measure name
- Flag = Previously created measure value
- Cars = Table name
- Price = Column name
- Now select the card visual from the visualization, drag and drop the created Measure value.
- The screenshot below shows that the card visually displays the filtered value based on the value selected in the slicer visual.
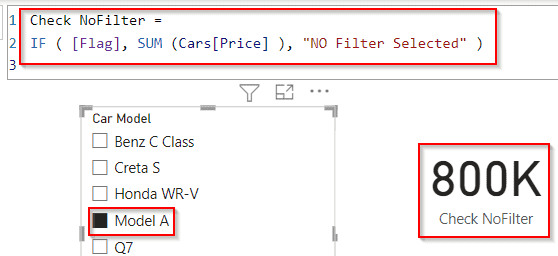
- The screenshot below shows that the card visually displays the no filtered value when none of the data is filtered from the slicer visual.
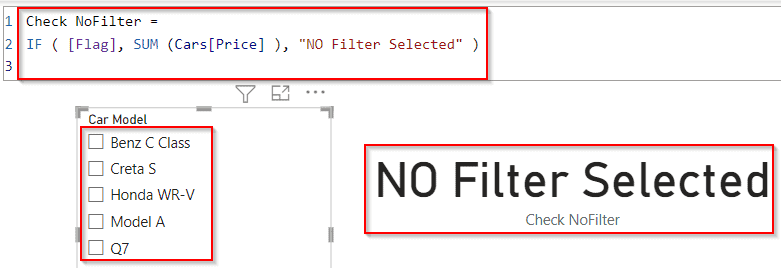
This is how to display nothing selected in the filter, using the Power Bi Dax filter function in Power BI.
Read: How to duplicate multiple columns using Power Query
Power BI DAX if filter selected
Let us see how we can display the selected filter value using the Power Bi Dax filter function in Power BI.
- Initially, open the Power BI desktop and load the data into the Power BI desktop, and from the ribbon click on the new measure option and apply the below formula:
Selected Filter = IF(ISFILTERED ( Cars[Car Model] ),SUM (Cars[Price] ), "False")Where,
- Selected Filter = Measure name
- Flag = Previously created measure value
- Cars = Table name
- Price = Column name
- Now in the report section, select the slicer visual from the visualizations, and drag and drop the Car Model from the field pane.
- Now select the card visual from the visualization, drag and drop the created Measure value.
- The screenshot below shows that the card visually displays the filtered value based on the value selected in the slicer visual.
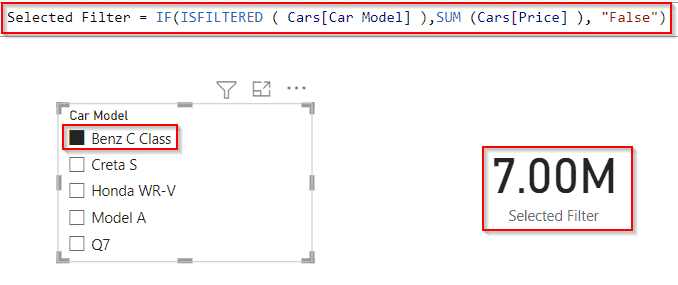
This is how to display the selected filter value using the Power Bi Dax filter function in Power Bi.
Read: How to add an empty column in Power BI
Power BI DAX if statement with filter
Let us see how we can use the filter function with the if statement condition in Power Bi.
In this example, we use the Vehicles table data to apply filters to obtain the result value as true or false based on the if filter condition.
- Open the Power Bi desktop and load the table data into it, From the ribbon click on the new measure option and apply the below formula:
IF filter =
VAR sumvalue =
    CALCULATE (
        SUM(Cars[Price]),
        FILTER (
            Cars,
            Cars[Car Model]="Q7" || Cars[Car Model]="Creta S"
        )
    )
RETURN
    IF ( sumvalue >= 800000, "False", "True" )
Where,
- IF filter = Measure name
- sum value = Variable name
- Cars = Table name
- Car Names, Price = Column name
- Now in the report section, select the table visual from the visualizations.
- In the table visual, drag and drop the Car name, Model, price from the field pane, and the created Measure value.
- The screenshot below shows that the card visually displays the filtered value based on the condition applied as either a car model called Q7or Creta S and displays the true or false value based on the condition applied.
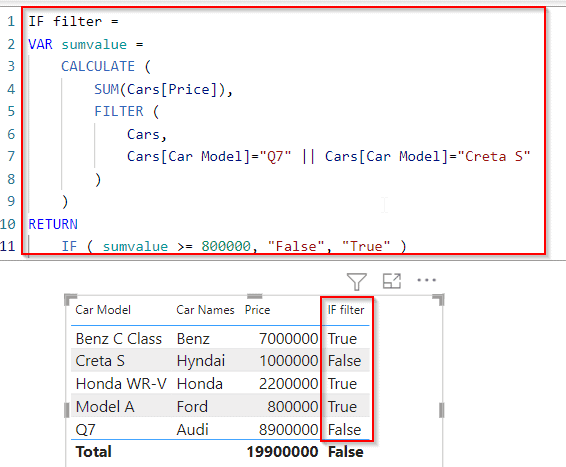
This is how to use the filter function with the if statement condition in Power Bi.
Additionally, you may like some more Power BI Tutorials:
- Power BI DAX Filter Table [With Real Examples]
- How To Remove Filter From Power BI DAX
- How to Filter Blank Value in Power BI
- How to add a column with a dropdown list in Power Query
- How to add a column with the same value in Power BI
- How to add column with a fixed value in Power BI
- How to add column from another table in Power BI [3 Different ways]
- Power Query Add Column [35+ Examples in Power BI]
- How to Append Columns in Power Query
This Power BI tutorial explains how to work with the Power BI Dax filter If functions based on the condition applied in the Power Bi Dax or measure with examples. Also, we discussed a few more topics mentioned below:
- Power BI DAX filter multiple conditions
- Power BI DAX filter true false
- Power BI DAX filter if contains text
- if no filter is selected Power BI DAX
- Power BI DAX if statement with filter
- Power BI DAX if filter selected
I am Bijay a Microsoft MVP (10 times – My MVP Profile) in SharePoint and have more than 17 years of expertise in SharePoint Online Office 365, SharePoint subscription edition, and SharePoint 2019/2016/2013. Currently working in my own venture TSInfo Technologies a SharePoint development, consulting, and training company. I also run the popular SharePoint website EnjoySharePoint.com