Are you familiar with the Power BI DAX filter based on condition filtering options? If not, We will learn everything about the Power BI DAX filter based on conditions in this Power BI tutorial.
Additionally, we will cover a few related headings as mentioned below:
- Power BI filter rows based on condition DAX
- Power BI filter OR condition
- Power BI DAX filter AND condition
- Power BI DAX filter contains
- Power BI DAX filters all
- Power BI DAX filter all except
- Power BI DAX count with filter
- Filter power bi DAX based on condition by the date
- Power bi DAX filter based on condition multiple conditions
- power bi Dax filter based on condition true false
- power bi if condition in the filter
- power bi DAX filter based on condition count
- Filter power bi DAX based on condition blank
- Power bi DAX filter based on condition based on another column
- Power bi Dax filter based on condition calculate
- Power bi DAX filter based on condition distinct
- Power bi Dax filter based on condition first value
- Power bi Dax filter based on condition greater than date
Power BI filter rows based on condition DAX
Let us see how we can filter rows based on conditions using Power BI DAX in Power BI.
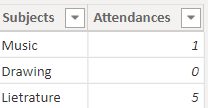
In this example, I have used the below-mentioned two tables to filter the rows based on the condition using the Power BI DAX formula.
Table 1:
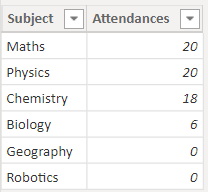
Table 2:
- Open the Power BI desktop and load the data into it, Click on the Table Tools tab -> New Table from the ribbon.
- Then write the below-mentioned Dax Expression in the formula bar and click on the check icon:
Filters rows =
FILTER ( UNION ( Sciences, Arts ), [Attendances] = 0 )
where,
- Filters rows = New Table
- Sciences, Arts = Existing Table
- Attendances = Column names
In the below screenshot, you can see that it filters the rows based on the condition and displays them in the new table:

This is how to filter rows based on conditions using Power BI DAX in Power BI.
Also Read: How to Append Columns in Power Query
Power BI filter OR condition
Let us see how we can filter rows based on the OR conditions using Power BI DAX in Power BI.
In this example, I have used the below-mentioned Subject table data to filter the rows based on the condition using the Power BI DAX formula.
- Open the Power BI desktop and load the data into it, Click on the Table Tools tab -> New Column from the ribbon.
- Then write the below-mentioned Dax Expression in the formula bar and click on the check icon:
FilterCondition =
IF (
    'Common'[Attendances] = 0 || 'Common'[Subject] = "Physics",
    "Filter",
    "Not Filter"
)
where,
- FilterCondition = New Column Name
- Common = Existing Table
- Attendances,Subject = Existing Column names
In the below screenshot, you can see that it filters the rows based on the condition and displays them in the new calculated column:
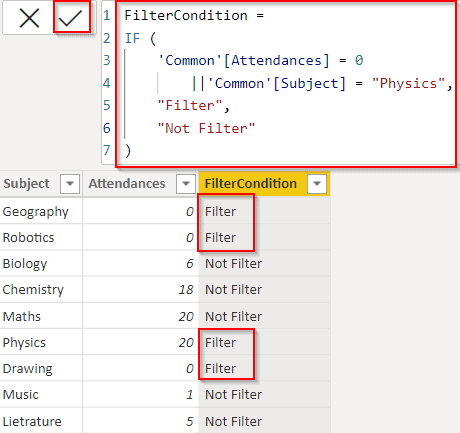
This is how to filter rows based on the OR conditions using Power BI DAX in Power BI.
Check out: How to Filter Date using Power BI DAX
Power BI DAX filter AND condition
Let us see how we can filter rows based on the AND conditions using Power BI DAX in Power BI.
In this example, I have used the below-mentioned Subject table data to filter the rows based on the condition using the Power BI DAX formula.
- Open the Power BI desktop and load the data into it, Click on the Table Tools tab -> New Column from the ribbon.
- Then write the below-mentioned Dax Expression in the formula bar and click on the check icon:
FilterCondition =
IF (
    'Common'[Attendances] = 0 && Common'[Subject] = "Physics",
    "Filter",
    "Not Filter"
)
where,
- FilterCondition = New Column Name
- Common = Existing Table
- Attendances,Subject = Existing Column names
In the below screenshot, you can see that it filters the rows based on the condition and displays them in the new calculated column:
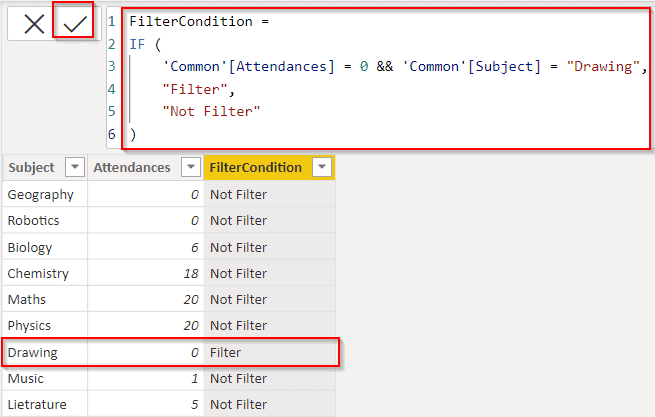
This is how to filter rows based on the AND conditions using Power BI DAX in Power BI.
Read: How to merge columns in Power Query
Power BI DAX filter contains
Let us see how we can filter rows based on the condition contains using Power BI DAX in Power BI.
In this example, I have used the below-mentioned Subject table data to filter the rows based on the condition using the Power BI DAX formula.
- Open the Power BI desktop and load the data into it, Click on the Table Tools tab -> New Column from the ribbon.
- Then write the below-mentioned Dax Expression in the formula bar and click on the check icon:
Filter contains= IF(
	ISERROR(
		SEARCH("Physics", Common[Subjects])
	),
	"false",
	"true"
)
where,
- Filter contains = New Column Name
- Common = Existing Table
- Subjects = Existing Column names
In the below screenshot, you can see that it filters the rows based on the condition matches and displays them in the new calculated column:
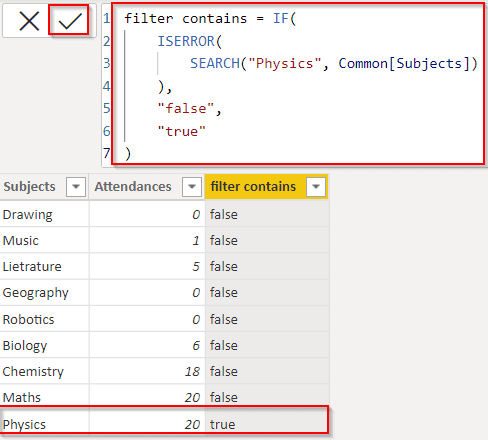
This is how to filter rows based on the condition contains using Power BI DAX in Power BI.
Have a look: How to Merge Column in Power BI
Power BI DAX filters all
Let us see how we can filter all functions using Power BI DAX in Power BI.
In this example, I have used the financials table data to filter the rows based on the condition using the Power BI DAX formula.
- Open the Power BI desktop and load the data into it, Click on the Table Tools tab -> New Measure from the ribbon.
- Then write the below-mentioned Dax Expression in the formula bar and click on the check icon:
Filter ALL = calculate(sum(financials[ Sales]),Filter(All(financials),financials[Country]="Canada"))where,
- Filter ALL = Measure Name
- financials = Existing Table
- Sales, Country= Existing Column names
- In the below screenshot, you can see that it filters the rows based on the condition matches and displays the data value:
- Select the Card visual and drag and drop the created measure value as shown below:

This is how to use all functions to filter the data using Power BI DAX in Power BI.
Read out: Power BI Slicer Multiple Columns
Power BI DAX filter all except
Let us see how we can filter the data using filter all except function the Power BI DAX in Power BI.
In this example, I have used the financials table data to filter the rows based on the condition using the Power BI DAX formula.
- Open the Power BI desktop and load the data into it, Click on the Table Tools tab -> New Measure from the ribbon.
- Then write the below-mentioned Dax Expression in the formula bar and click on the check icon:
Filter ALLExcept = CALCULATE(SUM(financials[ Sales]),FILTER(ALLEXCEPT(financials,financials[Product]),financials[Country]="Mexico"))where,
- Filter ALLExcept = Measure Name
- financials = Existing Table
- Sales, Product, Country= Existing Column names
- In the below screenshot, you can see that it filters the rows based on the condition matches and displays the data value.
- Select the Card visual and drag and drop the newly created measure value as shown below:

This is how to filter the data using filter all except function the Power BI DAX in Power BI.
Check: Power BI Create Table From Another Table
Power BI DAX count with filter
Let us see how we can use the count with filter function using the Power BI Dax function in Power BI.
In this example, I have used the below-mentioned Subject table data to filter the rows based on the condition using the Power BI DAX formula.
- Open the Power BI desktop and load the data into it, Click on the Table Tools tab -> New Column from the ribbon.
- Then write the below-mentioned Dax Expression in the formula bar and click on the check icon:
Count = COUNTROWS(FILTER(Common,Common[Attendances]=0))where,
- Count = Measure name
- Common = Existing Table
- Attendances = Existing Column names
- In the below screenshot, you can see that it filters the rows based on the condition and displays the data value.
- Select the Table visual and drag and drop the newly created measure value as shown below:
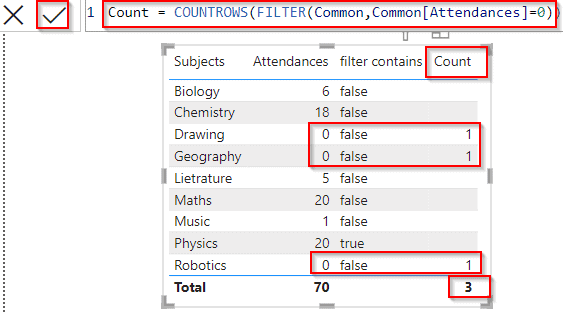
This is how to use the count with filter count function using the Power BI Dax function in Power BI.
Filter power bi DAX based on condition by the date
Let us see how we can filter based on conditions by the data using the Power BI Dax formula in Power BI.
In this example, I have used the two mentioned below sample table data. In Table 1 (Value Table) Date and Value columns are presented, and in Table 2 (Date Table) only the Date column has been separated.
Table 1: (Value Table)

Table 2: (Date Table)

- Open the Power BI desktop and load these two tables’ data into it, Click on the Table Tools tab -> New Measure from the ribbon.
- Then write the below-mentioned Dax Expression in the formula bar and click on the check icon, which calculates the Sum of the Values presented in the Values Table, and also displays the date before two dates based on the condition applied.
Date Filter= CALCULATE(SUM('Value'[value]),FILTER('Value','Value'[Date]>=MAX('Date'[Date])-2 &&'Value'[Date]<=MAX('Date'[Date])))where,
- Date Filter = Measure name
- Value,Date = Existing Table
- value, Date= Existing Column names
- In the below screenshot, you can see that it filters the rows based on the condition and displays the sum value based on the selected date filter.
- Select the Table visual and drag and drop the newly created measure value as shown below:
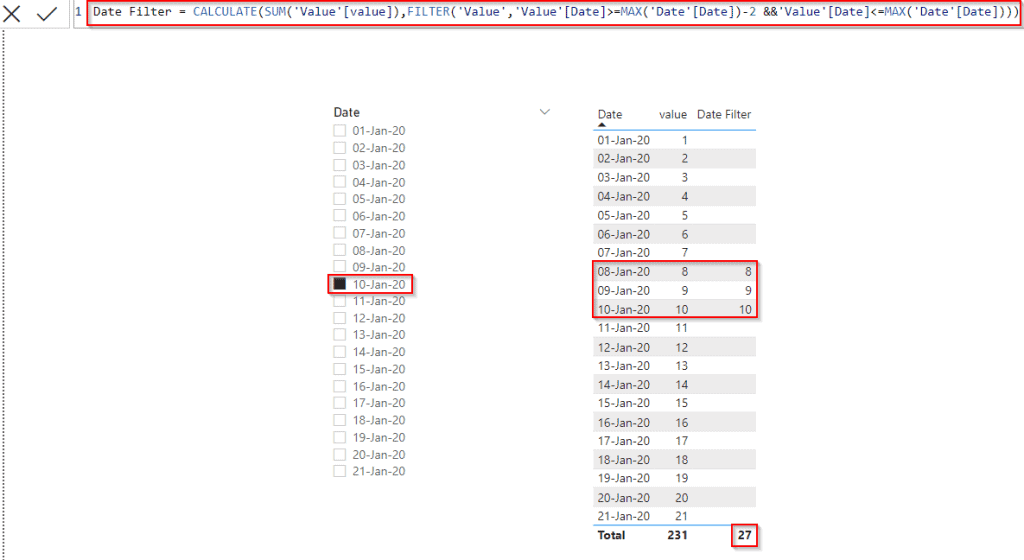
This is how to filter based on conditions by the data using the Power BI Dax formula in Power BI.
Also read: Power BI filter between two dates [With 15+ Examples]
Power bi DAX filter based on condition multiple conditions
Let us see how we can filter the data based on multiple conditions using the Power BI Dax formula in Power BI.
In this example, I have used the financials table to sum the sales value based on the Multiple countries using multiple conditions, based on condition and then we will add those values (i.e. from Germany and Canada country)”
- Open the Power BI desktop and load these two tables’ data into it, Click on the Table Tools tab -> New Measure from the ribbon.
- Then write the below-mentioned Dax Expression in the formula bar and click on the check icon.
Sum of Sales = CALCULATE(
SUM(financials[ Sales]),ALL(financials[ Sales]),
financials[Country] in {"Germany","Canada"}
)
where,
- Sum of Sales = Measure Name
- financials = Existing Table
- Sales, Country= Existing Column names
- In the below screenshot, you can see that it filters the rows based on the condition matches and displays the data value.
- Select the Card visual and drag and drop the newly created measure value as shown below:
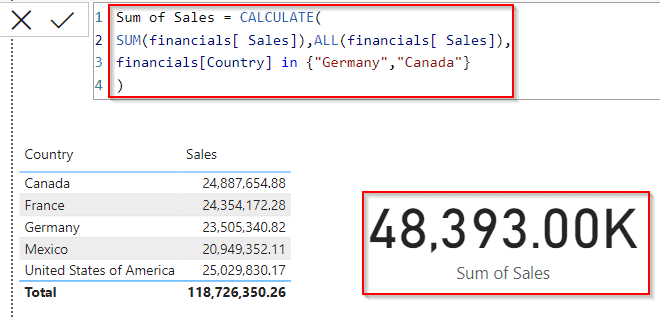
This is how to filter the data based on multiple conditions using the Power BI Dax formula in Power BI.
Power bi Dax filter based on condition true false
Let us see how we can filter rows based on the condition contains using Power BI DAX in Power BI.
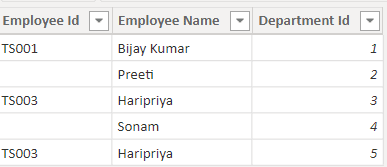
In this example, I have used the below-mentioned Employee table data to filter the rows based on the condition using the Power BI DAX formula.
- Open the Power BI desktop and load the data into it, Click on the Table Tools tab -> New Column from the ribbon.
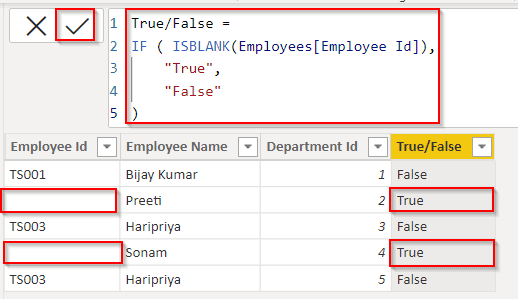
- Then write the below-mentioned Dax Expression in the formula bar and click on the check icon:
True/False =
IF ( ISBLANK(Employees[Employee Id]),
    "True",
    "False"
)
where,
- True/False = New Column Name
- Employees = Existing Table
- Employee Id = Existing Column names
- In the below screenshot, you can see that it filters the rows based on the condition matches and displays the true or false as a result value.
This is how to filter rows based on the condition true or False using Power BI DAX in Power BI.
Check out: Power BI Sum Group by
Power BI if condition in the filter
Let us see how we can filter using the if condition using Power BI DAX in Power BI.
- Open the Power BI desktop and load the data into it, Click on the Table Tools tab -> New Column from the ribbon.
- Then write the below-mentioned Dax Expression in the formula bar and click on the check icon:
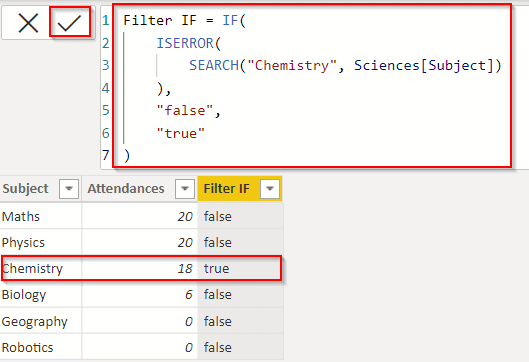
Filter IF = IF(
	ISERROR(
		SEARCH("Physics", Sciences[Subjects])
	),
	"false",
	"true"
)
where,
- Filter contains = New Column Name
- Sciences= Existing Table
- Subjects = Existing Column names
- In the below screenshot, you can see that it filters the rows based on the condition matches and displays them in the new calculated column:
This is how to filter using if condition using Power BI DAX in Power BI.
Power bi DAX filter based on condition count
Let us see how we can filter using the Power BI DAX Count function in Power BI.
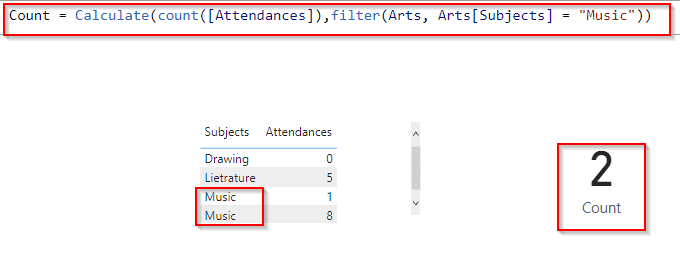
In this example, I have used Arts table data, to count the subjects using the Power BI count function.
- Open the Power BI desktop and load the data into it, Click on the Table Tools tab -> New Measure from the ribbon.
- Then write the below-mentioned Dax Expression in the formula bar and click on the check icon:
Count = Calculate(count([Attendances]),filter(Arts, Arts[Subjects] = "Music"))where,
- Count = New Measure Name
- Arts= Existing Table
- Attendances ,Subjects= Existing Column names
- In the below screenshot, you can see that it filters the rows based on the condition matches and displays the data value.
- Select the Table visual from the visualization, drag, and drop created measure in the Table visual.
This is how to filter based on conditions using the Power BI DAX Count function in Power BI.
Read: Power BI Compares Two Columns in Different Tables
Filter power bi DAX based on condition blank
Let us see how we can filter Power Bi DAX based on condition blank using the Power BI Dax formula in Power Bi.
In this example, I have used the Employees table data to filter the null values data using the Power Bi Blank function.
- Open the Power BI desktop and load the data into it, Click on the Table Tools tab -> New Measure from the ribbon.
- Then write the below-mentioned Dax Expression in the formula bar and click on the check icon:
Blank =
CALCULATE (
    DISTINCTCOUNT ( 'Employees'[Employee Id] ),
    FILTER ( 'Employees', 'Employees'[Employee Id] <> BLANK () )
)
where,
- Count = New Measure Name
- Employees = Existing Table
- Employee Id = Existing Column names
- In the below screenshot, you can see that it filters the rows based on the condition matches and displays the data value.
- Select the Card visual from the visualization, drag, and drop created measure in the Card visual.
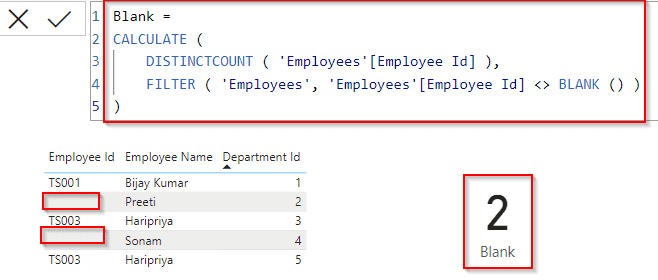
This is how to filter Power Bi DAX based on condition blank using the Power BI Dax formula in Power Bi.
Power bi DAX filter based on condition based on another column
Let us see how we can filter the data value based on the condition, based on the other columns using Power BI DAX in Power BI.
In this example, I have used the financials table data to filter the rows based on the condition using the Power BI DAX formula.
- Load the data into the Power BI desktop, Click on the Table Tools tab -> New Measure from the ribbon.
- Then write the below-mentioned Dax Expression in the formula bar and click on the check icon:
Another Column = CALCULATE(SUM(financials[ Sales]),FILTER(ALLEXCEPT(financials,financials[Country]),financials[Product]="VTT"))where,
- Another Column = Measure Name
- financials = Existing Table
- Sales, Product, Country= Existing Column names
- In the below screenshot, you can see that it filters the rows based on the condition matches and displays the data value.
- Select the Slicer value, and drag and drop the country column in it. so based on the country it displays the Product value (VTT) in the card visual.
- Select the Card visual and drag and drop the newly created measure value as shown below:

- In the same way, below screenshot, you can see that I have selected different countries in the slicer, based on the condition it displays the VTT product value for the selected country in the card visual.

This is how to filter the data value based on the Power BI condition applied, based on the other columns using Power BI DAX in Power BI.
Power bi Dax filter based on condition calculate
Let us see how we can filter based on the condition using Calculate Power BI DAX calculate function in Power BI,
In this example, I have used the financials table data to filter the rows based on the condition using the Power BI DAX formula.
- Load the data into the Power BI desktop, Click on the Table Tools tab -> New Measure from the ribbon.
- Then write the below-mentioned Dax Expression in the formula bar and click on the check icon:
Calculate Sales Amount = calculate(sum(financials[ Sales]),Filter(All(financials),financials[Country]="Mexico"))where,
- Calculate Sales Amount = Measure Name
- financials = Existing Table
- Sales, Country= Existing Column names
- In the below screenshot, you can see that it filters the rows based on the condition matches and displays the data value:
- Select the Card visual and drag and drop the created measure value as shown below:

This is how to filter based on the condition using Calculate Power BI DAX calculate function in Power BI.
Read How to duplicate multiple columns using Power Query
Power bi DAX filter based on condition distinct
Let us see how we can filter based on the Power BI Dax distinct function in Power BI.
In this example, you can see that there are two duplicate employee names called Haripriya in the below-mentioned table data. Here we will see how we can filter and count the unique values.
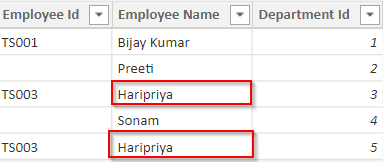
- Load the data into the Power BI desktop, Click on the Table Tools tab -> New Measure from the ribbon.
- Then write the below-mentioned Dax Expression in the formula bar and click on the check icon:
Distinct Count = DISTINCTCOUNT(Employees[Employee Name])where,
- Distinct Count = Measure Name
- Employees = Existing Table
- Employee Name = Existing Column names
- In the below screenshot, you can see that it filters the rows based on the condition and displays the data value which is unique:
- Select the Card visual and drag and drop the created measure value as shown below, so that it displays the unique values count for the selected column.
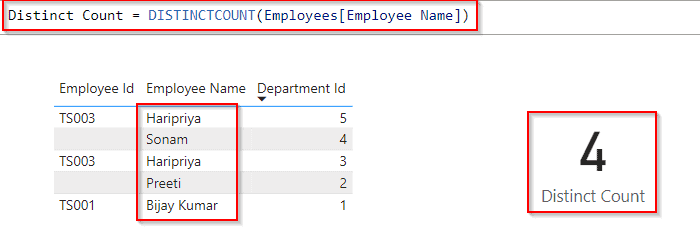
This is how to filter based on the Power BI Dax distinct function in Power BI.
Power bi Dax filter based on condition first value
Let us see how we can filter the first value based on the condition using Power BI DAX in Power BI,
In this example, I am going to filter the first value ID 1, so that it filters and displays the data based on the condition.
- Load the data into the Power BI desktop, Click on the Table Tools tab -> New Column from the ribbon.
- Then write the below-mentioned Dax Expression in the formula bar and click on the check icon:
ID 1 =
IF(
    NOT(
        ISEMPTY(
            CALCULATETABLE(
                Employees,
                ALLEXCEPT( Employees, Employees[Employee Name] ),
                Employees[Employee Id] = "TS001"
            )
        )
    ),
    "True","False"
)
where,
- Distinct Count = Measure Name
- Employees = Existing Table
- Employee Name = Existing Column names
- In the below screenshot, you can see that it filters the rows based on the condition and displays the data value for the first value:
- If it matches with the string, it displays the value true, else it displays false as below:
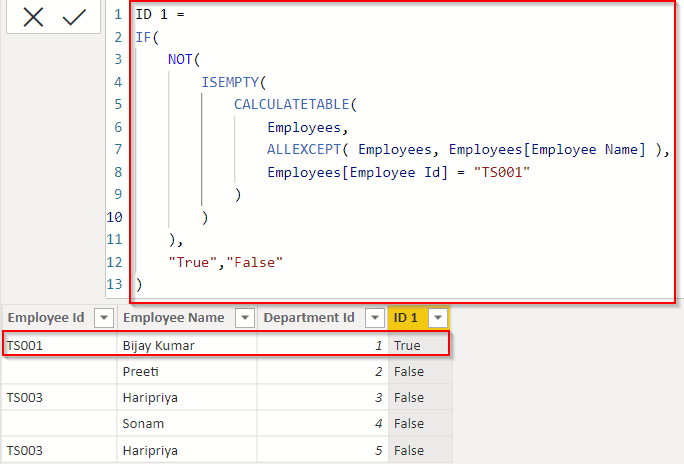
This is how we can filter the first value based on the condition using Power BI DAX in Power BI.
Power bi Dax filter based on condition greater than date
Let us see how we can filter value based on the condition using Power BI DAX in Power BI,
In this example, I am going to sum and filter the Employee’s salary value greater than today’s date (ie, Today’s Date is 27-09-2022), so that it filters and displays the data based on the condition.
- Load the data into the Power BI desktop, Click on the Table Tools tab -> New Measure from the ribbon.
- Then write the below-mentioned Dax Expression in the formula bar and click on the check icon:
Greater than date = Calculate(sum([Emp Salary]),Filter(All(Employees), [Date of Joining].[Date]>Today()))where,
- Greater than date = Measure Name
- Employees = Existing Table
- Emp Salary, Date of Joining = Existing Column names
- In the below screenshot, you can see that it filters the rows based on the condition sum and displays the employee’s salary value :
- Select the card visual, drag and drop the created measure in the field section as below:

This is how to filter value based on the condition using Power BI DAX in Power BI.
Also, you may like the below Power BI tutorials:
- How to remove rows in power query editor [With various examples]
- Power BI Sum Multiple columns [With 21 Useful Examples]
- Power BI divides two columns [With 14 real examples]
- Power BI Bookmarks [With 21 Examples]
This Power BI tutorial explains how to filter the data value based on the requirement using Power BI DAX in Power BI. Also, it covered the below-mentioned headings:
- Power BI filter rows based on condition DAX
- Power BI filter OR condition
- Power BI DAX filter AND condition
- Power BI DAX filter contains
- Power BI DAX filters all
- Power BI DAX filter all except
- Power BI DAX count with filter
- Filter power bi DAX based on condition by the date
- Power bi DAX filter based on condition multiple conditions
- Power bi Dax filter based on condition true false
- power bi if condition in the filter
- power bi DAX filter based on condition count
- Filter power bi DAX based on condition blank
- Power bi DAX filter based on condition based on another column
- Power bi Dax filter based on condition calculate
- Power bi DAX filter based on condition distinct
- Power bi Dax filter based on condition first value
- Power bi Dax filter based on condition greater than date
I am Bijay a Microsoft MVP (10 times – My MVP Profile) in SharePoint and have more than 17 years of expertise in SharePoint Online Office 365, SharePoint subscription edition, and SharePoint 2019/2016/2013. Currently working in my own venture TSInfo Technologies a SharePoint development, consulting, and training company. I also run the popular SharePoint website EnjoySharePoint.com