In this Power BI tutorial, we’ll learn how to compare two columns from different tables. We’ll examine the data in each column and find any similarities or differences between them.
We will also learn how to compare two columns in Power BI, and Dax will compare two columns in different tables in Power BI.
Additionally, we will discuss the topics below:
- Power BI: calculate the difference between two columns in different tables
- How to compare two columns in Power BI?
- Power BI measure to compare two columns
- Power BI: match data from two tables
Power BI Compare Two Columns in Different Tables
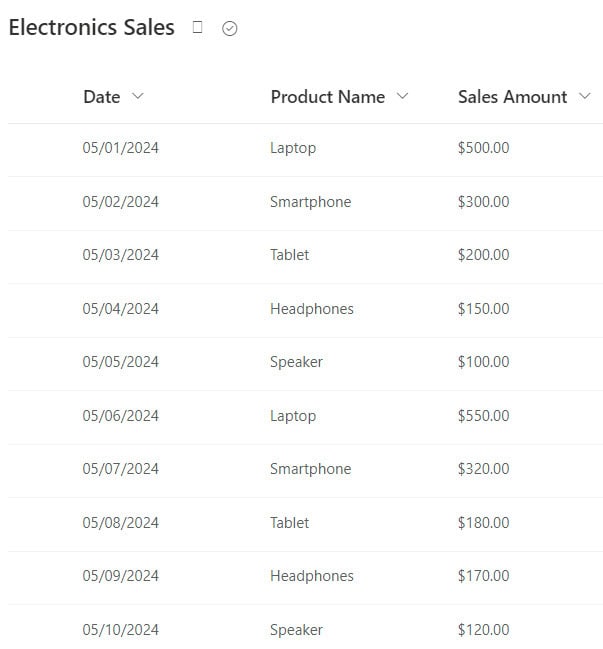
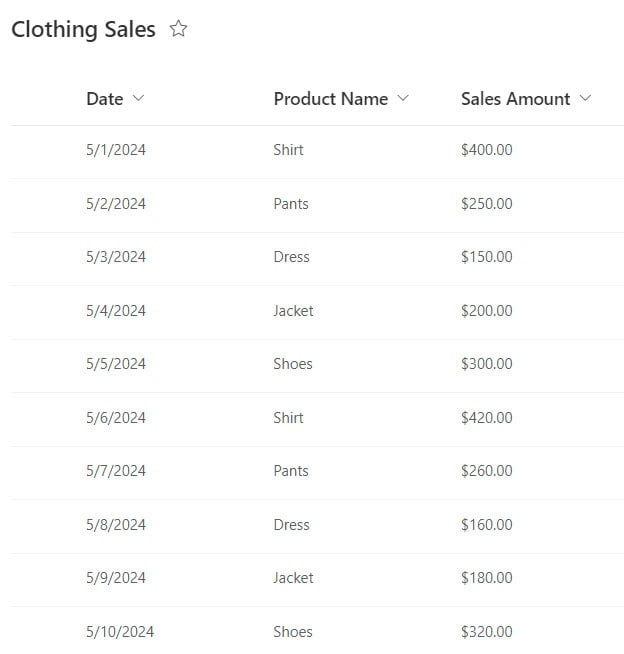
Let’s imagine you want to compare the sales figures of two different product categories over a certain period. Let’s say you have one SharePoint List that contains sales data for electronics and another SharePoint List that contains sales data for clothing.
Electronics Sales Table:
Clothing Sales Table:
You want to compare the total sales amounts for each category to see which one performed better.
Now follow the below steps:
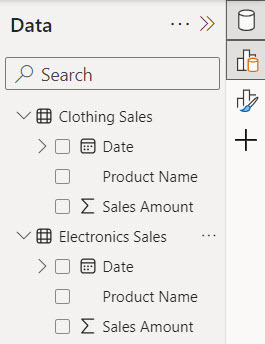
1. Open Power BI Desktop and load the above SharePoint List in Power BI Desktop. Then, you can see the data presented in the Data pane.
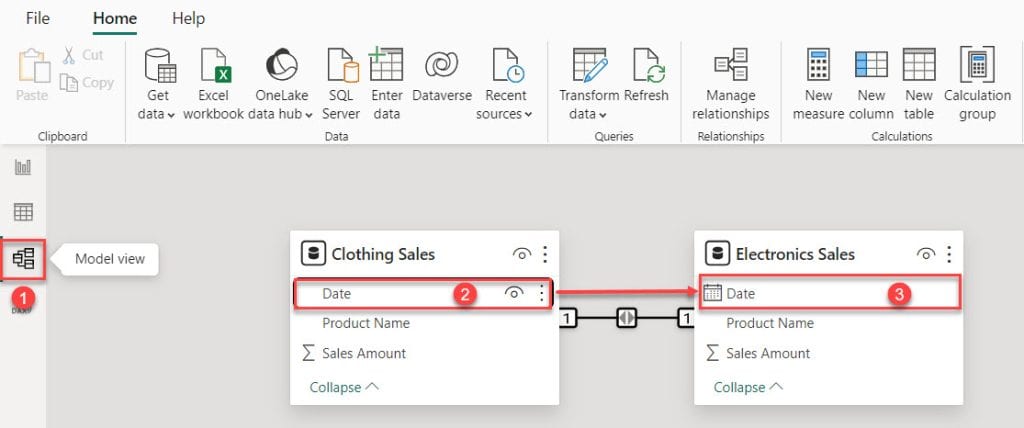
2. In the Model view, drag and drop the Date column from the Clothing Sales table onto the Electronic Sales table. You’ll notice a one-to-one relationship being established between these tables.
3. Under the Home tab, expand Visual gallery(black box) -> Click the Stacked column chart.

4. Then, using the +Add data option, add the clothing table Product Name to the X-axis and the Sales Amount to the Y-axis.
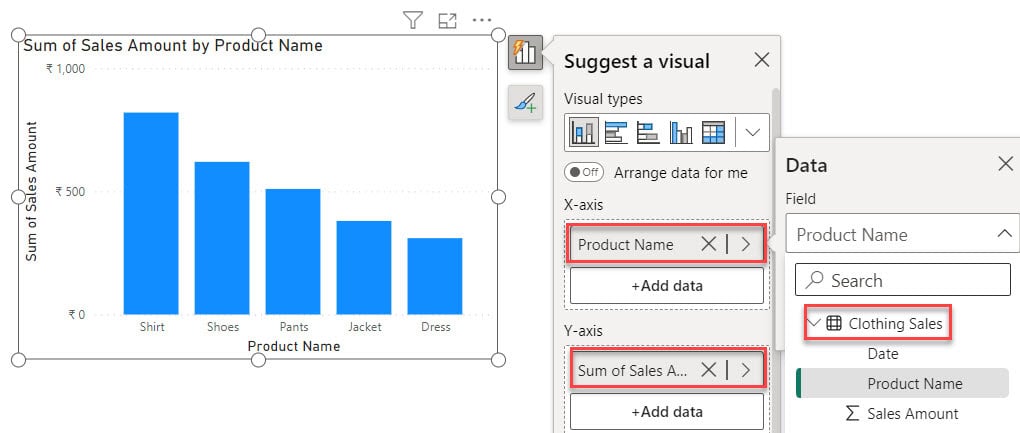
5. Again under the Home tab, expand Visual gallery(black box) -> Click the Stacked column chart.

6. Then, using the +Add data option, add the electronics table Product Name to the X-axis and the Sales Amount to the Y-axis.
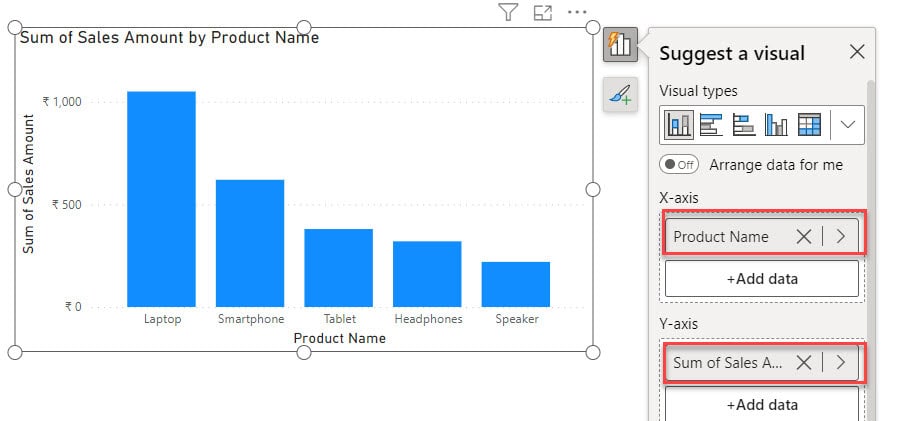
7. Then, Add a Date Slicer in the report view.
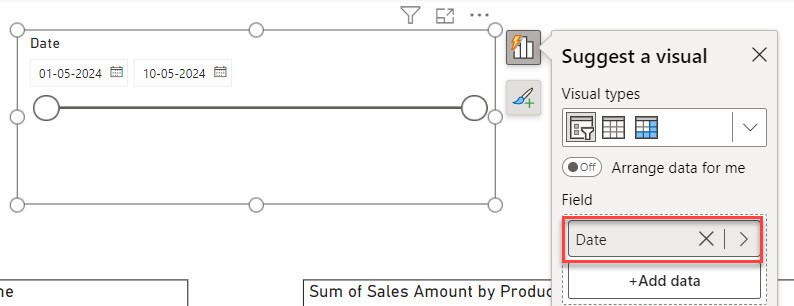
8. When you select a specific date range, you’ll notice changes in the column chart.
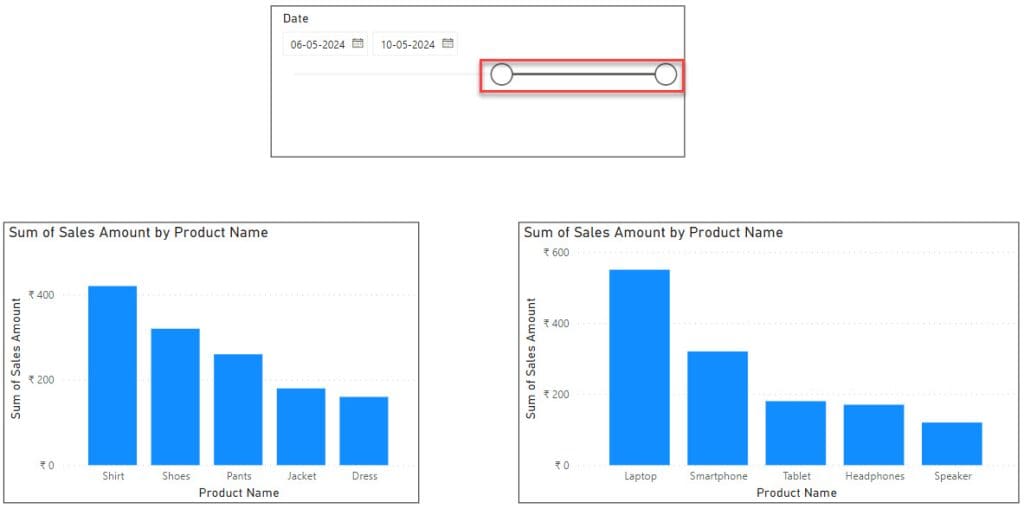
Using this slicer, you can compare two different tables of sales.
DAX Compare Two Columns in Different Tables in Power BI
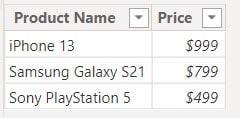
Imagine you have two tables in your Power BI model. One table contains information about your products, including their names and prices. The other table contains data about the sales made, including the product names and the quantity sold.
Products Table:
Sales Table:

You want to compare the product prices in the products table with the prices at which they were sold in the sales table to see if there are any discrepancies (Differences).
Now follow the below steps:
1. Open Power BI Desktop and load the two tables. You will find the data in the Data pane.
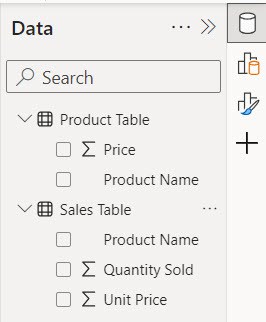
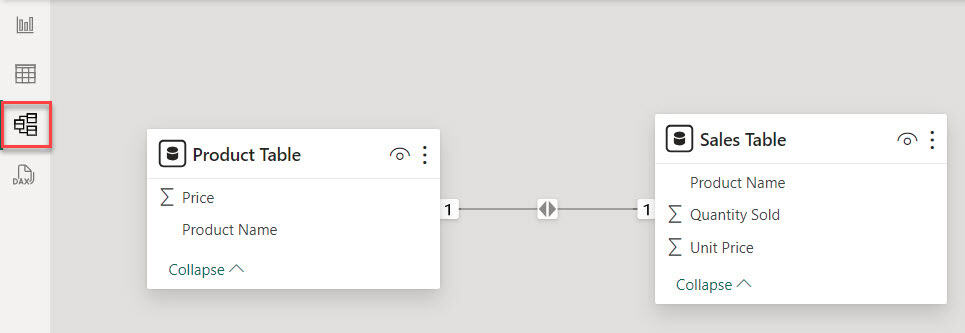
2. Ensure that the two tables have a relationship based on a common column, such as the product name. To check this, go to the Model view.
Note:
If there’s no existing relationship, drag and drop the ‘Product Name’ from the ‘Product Table’ onto the ‘Sales Table’.
3. Then go to the Table view. In the Data pane, select Sales Table. Under the Table tools, click the New column.

4. Put the below DAX expression in the formula bar. Then click the Commit button.
Product Price = RELATED('Product Table'[Price])Where:
- Product Price = This is the name we use for the calculation we are creating.
- RELATED() = This is a function in DAX that helps to fetch related data from another table.
- ‘Product Table'[Price] = This refers to the column named “Price” in the “Product Table” from where we’re fetching the related data.

5. Then, you will notice a new column in the Sales Table. It contains the prices from the Product Table.

6. Now, we create another calculated column in the Sales Table to compare the actual selling price with the listed price. To do this, I am using the below DAX expressions.
Price Discrepancy = IF('Sales Table'[Unit Price] <> 'Sales Table'[Product Price], "Discrepancy", "No Discrepancy")Where:
- Price Discrepancy = This is the name we use for the calculation we are creating.
- IF = This function checks a condition and returns one value if it’s true and another if it’s false.
- ‘Sales Table'[Unit Price] =This refers to the “Unit Price” column in the “Sales Table”
- ‘Sales Table'[Product Price] = This refers to the “Product Price” column in the “Sales Table”.
- Discrepancy = The value returned if the unit price is not equal to the product price.
- No Discrepancy = The value returned if the unit price is equal to the product price.

7. Now, see when the price matches the Product Table, and the Sales Table shows No Discrepancy, which means no difference; otherwise, it gives a Discrepancy, which means a difference.

This way, you can compare two columns in different tables in Power BI DAX.
Power BI Calculate Difference Between Two Columns in Different Tables
Imagine you’ve received data from a grocery store. You want to monitor inventory changes for grocery products. You have one SharePoint list showing the current stock levels of each product and another list recording the stock levels from the previous month.
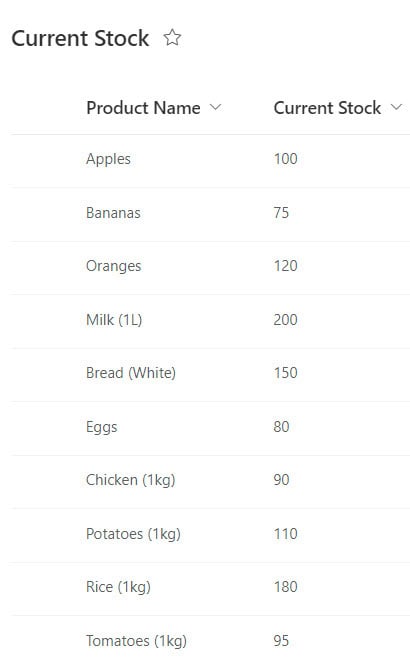
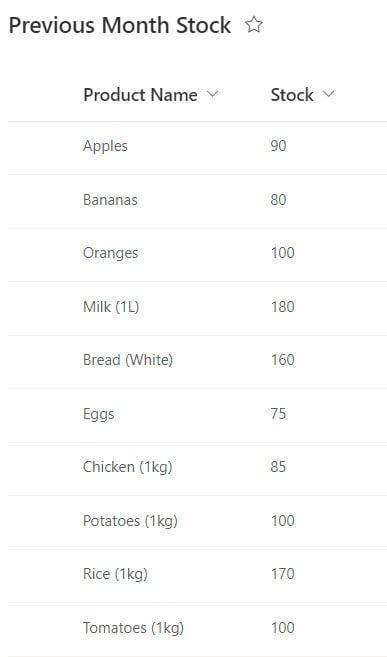
To see which products have increased or decreased in stock, you need to calculate the difference between the current stock levels and the previous month’s levels.
Now follow the below steps:
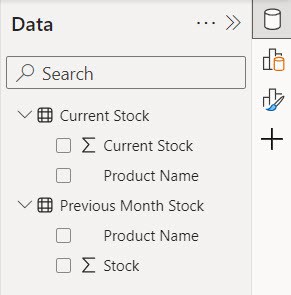
1. Open Power BI Desktop and load the above SharePoint List in Power BI Desktop. Then, you can see the data presented in the Data pane.
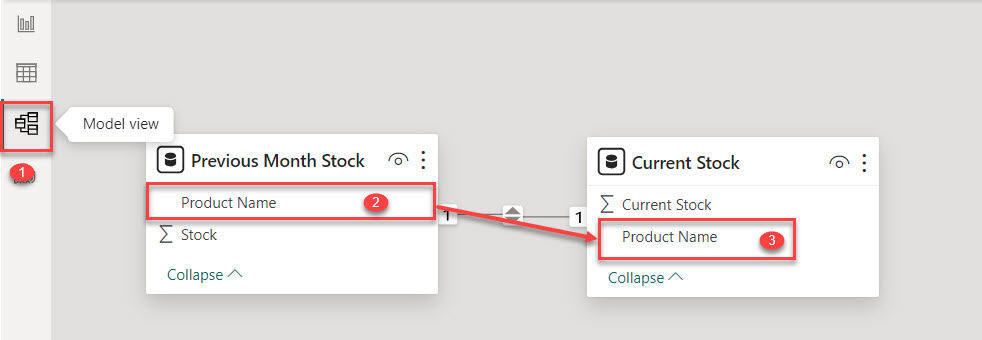
2. Go to Model view, then drag and drop ‘Product Name‘ from the ‘Previous Month Stock‘ table onto the ‘Current Stock‘ table.
3. Then go to the Table view. In the Data pane, select Current Stock. Under the Table tools, click the New column.

4. Put the below DAX expression in the formula bar. Then click the Commit button.
Difference = 'Current Stock'[Current Stock] - RELATED('Previous Month Stock'[Stock])Where:
- Difference = This calculates the variance between two values.
- ‘Current Stock'[Current Stock] = It refers to the current stock value from the ‘Current Stock’ table.
- RELATED(‘Previous Month Stock'[Stock]) = This function fetches the stock value from the ‘Previous Month Stock’ table related to the current row.

5. Now, you will notice a ‘Difference’ column added to the current stock table. It displays numbers indicating whether the stock for each product has increased or decreased. A positive number means the stock has increased, while a negative number means the stock has decreased.
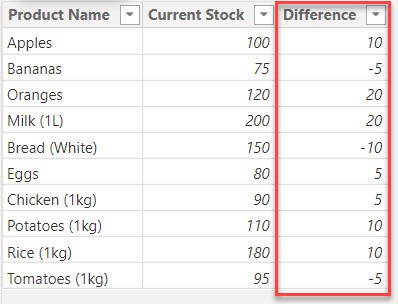
This way, you can calculate the difference between two columns in different tables in Power BI.
How to Compare Two Columns in Power BI?
Now, I will explain how to compare two columns in Power BI using an example.
Scenario:
Imagine you’re managing a sales team, and you want to incentivize them based on their performance compared to their sales targets.
If an employee meets or exceeds their sales target, they’ll receive a 5% salary hike. If they exceed the target by more than 10%, they’ll receive a 10% hike. If they fall short of the target, there won’t be any hike.
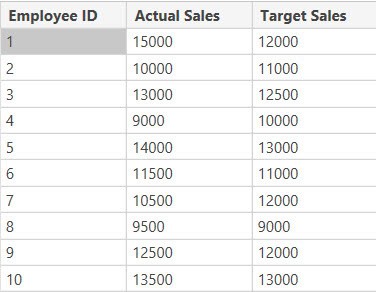
According to this scenario, we have a table named Sales Performance that contains the Employee ID, Actual Sales, and Target Sales columns:
Now follow the below steps:
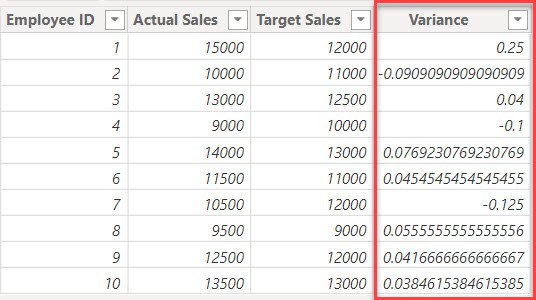
First, load the dataset into Power BI. Then, create a new calculated column using the following DAX expression.
Variance = ([Actual Sales] - [Target Sales]) / [Target Sales]Where:
- Variance = Name of the calculated column that we creating.
- [Actual Sales] = Name of the column that is presented in the Sales Performance dataset.
- [Target Sales] = Name of the column that is presented in the Sales Performance dataset.

You can see that the following column has been included in the Sales Performance table.
Again, create a new calculated column using the following DAX expression.
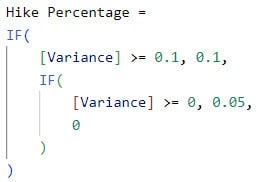
Hike Percentage =
IF(
    [Variance] >= 0.1, 0.1,
    IF(
        [Variance] >= 0, 0.05,
        0
    )
)
Where:
- Hike Percentage = This DAX formula calculates the “Hike Percentage” based on a given “Variance.”
- IF([Variance] >= 0.1, 0.1, …) = If the difference between two values (variance) is 10% or more, the hike percentage is set to 10%.
- IF([Variance] >= 0, 0.05, …) = If the difference between two values (variance) is positive but less than 10%, the hike percentage is set to 5%.
- 0 = If the difference between two values (variance) is negative, there’s no hike percentage applied.
You can see that the following column (Hike Percentage) has been included in the Sales Performance table.
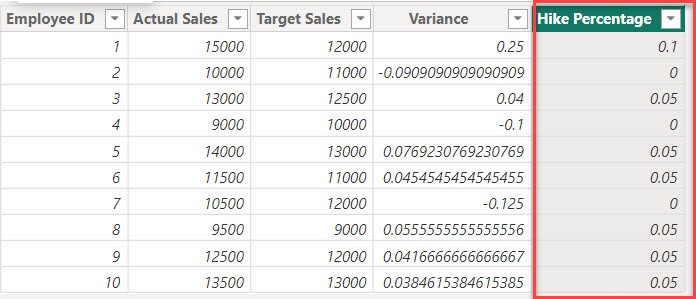
After that, choose the ‘Hike Percentage‘ column, then click on the percentage (%) icon under ‘Column tools‘.
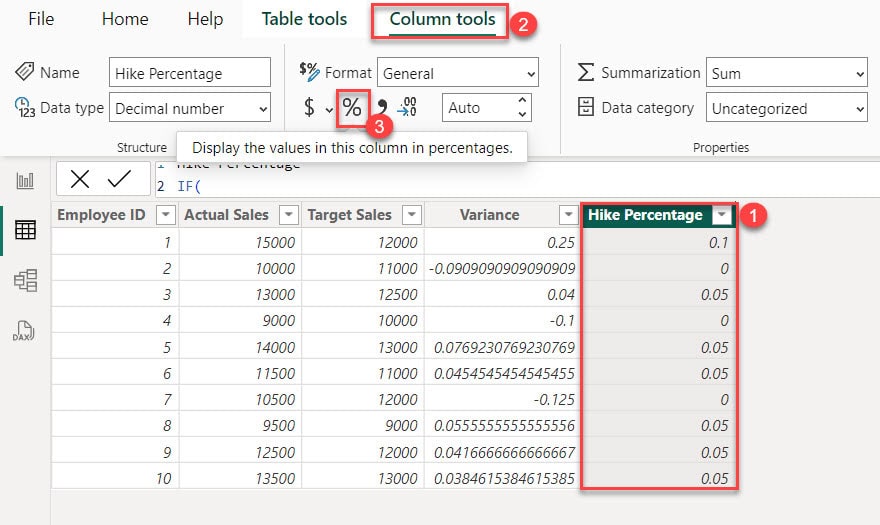
After doing that, you will be able to see the ‘Hike Percentage‘ in the Sales Performance table.
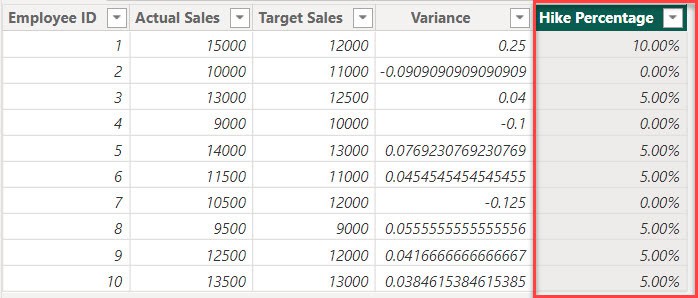
With these steps and sample data, you can easily analyze your sales team’s performance and decide on salary hikes using Power BI.
Power BI Measure Compare Two Columns
Let’s say you want to compare the sales performance of two different products, Sneakers and boots.
Here, I have a table in Power BI Desktop that contains the Product Name, Sales Quantity, and Sales Amount column.
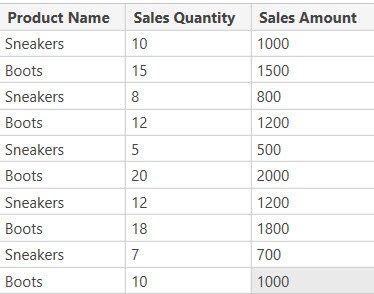
Now, we create a measure for Total Boot Sales using the below DAX expression.
Total Boot Sales = SUMX(FILTER('Sales Data', 'Sales Data'[Product Name] = "Boots"), 'Sales Data'[Sales Amount])Where:
- Total Boot Sales = The measure where we want to calculate the total sales for the product “Boots.”
- SUMX() = This is a function that adds up values based on a specified expression, in this case, the filtered sales amounts for “Boots”.
- FILTER(‘Sales Data,’ ‘Sales Data'[Product Name] = “Boots”) = This function selects only the rows from the ‘Sales Data’ table where the product name is “Boots.”
- ‘Sales Data'[Sales Amount] = specifies the column containing the sales amounts.

Next, we will make a measure for the total amount of Sneaker Sales in the sales table. To do this, use the below DAX expression.
Total Sneaker Sales = SUMX(FILTER('Sales Data', 'Sales Data'[Product Name] = "Sneakers"), 'Sales Data'[Sales Amount])Where:
- Total Sneaker Sales = The measure where we want to calculate the total sales for the product “Sneakers”.
- SUMX() = This is a function that adds up values based on a specified expression, in this case, the filtered sales amounts for “Sneakers”.
- FILTER(‘Sales Data’, ‘Sales Data'[Product Name] = “Sneakers”) = This function selects only the rows from the ‘Sales Data’ table where the product name is “Sneakers.”
- ‘Sales Data'[Sales Amount] = specifies the column containing the sales amounts.

Now that we have the individual sales of two products, in order to compare the sales performance of these two products, we will create a measure using the following DAX expression.
Sales Comparison = [Total Boot Sales] - [Total Sneaker Sales]
After that, utilize the Power BI Card visual to view the sales comparison between the two products.
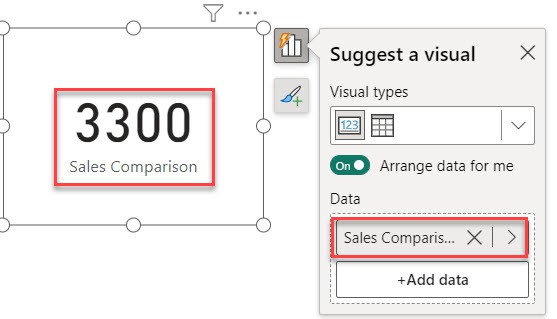
These steps should help you compare the sales performance of Boot and Sneaker using Power BI measures.
Power BI Match Data From Two Tables
Let’s see how we can see two table data match or not in Power BI.
For this, we already loaded two tables in Power BI Desktop:
Table 1:
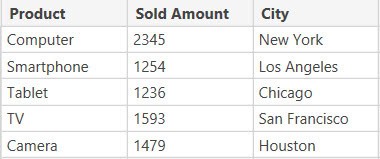
Table 2:
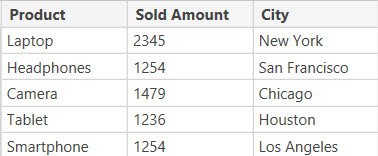
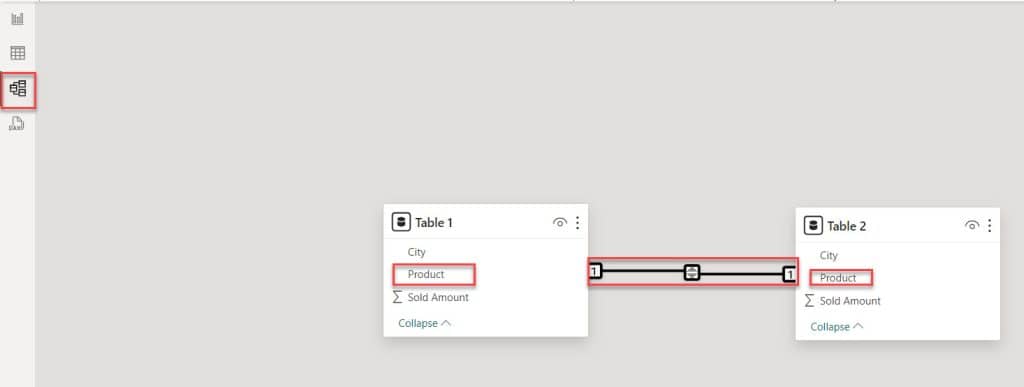
When you navigate to the model view, you’ll observe that Table 1 and Table 2 are connected with a one-to-one relationship because the ‘Product’ column contains identical data in both tables.
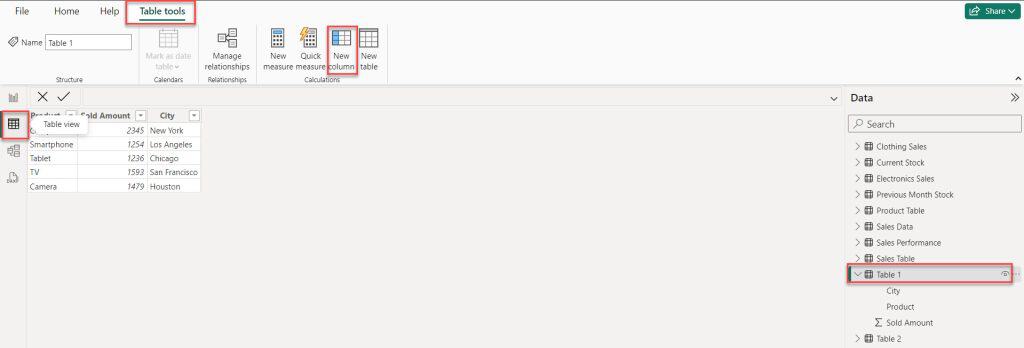
Then go to the Table view. In the Data pane, select Table 1. Under the Table tools, click the New column.
Put the below DAX expression in the formula bar. Then click the Commit button.
Matched Column = IF(RELATED('Table 2'[Product])='Table 1'[Product],"Matches","UnMatch")Where:
- Matched Column = This is the name of a new column called ‘Matched Column’ that holds the outcome of the IF condition.
- IF()= This is a function that checks a condition and returns one value if it is true and another value if it is false.
- RELATED(‘Table 2′[Product]) = retrieves the value of the ‘Product’ column from ‘Table 2’ that matches the current row in ‘Table 1’.
- ‘Table 1′[Product] = refers to the ‘Product’ column in ‘Table 1’.
- Matches = specifies the value to return if the product in ‘Table 1’ matches the product in ‘Table 2’.
- UnMatch = specifies the value to return if the product in ‘Table 1’ does not match the product in ‘Table 2’.

If the rows in the column are identical in both tables, it shows the result as ‘Matches’; otherwise, it shows the result as ‘UnMatch’ for values that don’t match.
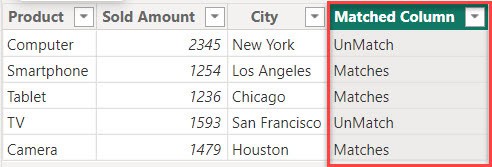
This way, you can match data from two tables in Power BI.
Conclusion
In the article, we explored how to use Power BI to compare columns in different tables, focusing on:
- Comparing two columns in different tables using DAX.
- Calculating the difference between two columns in different tables.
- Techniques for comparing columns in Power BI.
- Creating a Power BI measure to compare two columns.
- Matching data from two tables in Power BI.
You may also like the following Power BI tutorials:
- How to Filter Between Two Dates in Power BI
- Power BI Sum Multiple Columns
- Power BI Divide Two Columns
- How to Create Date Hierarchy in Power BI?
- Power BI Split Column by Text Contains
I am Bijay a Microsoft MVP (10 times – My MVP Profile) in SharePoint and have more than 17 years of expertise in SharePoint Online Office 365, SharePoint subscription edition, and SharePoint 2019/2016/2013. Currently working in my own venture TSInfo Technologies a SharePoint development, consulting, and training company. I also run the popular SharePoint website EnjoySharePoint.com
Dear Bijay , excellent tutorial, but Sample excel miss some columns, country example.
Maybe some edit your shared file