A Power BI slicer lets you filter data easily. You can use multiple columns to slice and dice your data for clearer insights.
In this tutorial, we will learn how to create a slicer with multiple columns in Power BI and a Power BI slicer with a vertical list of multiple columns.
Additionally, we will discuss the topics below:
- Power BI slicer with multiple fields
- Power BI slicer search
- Power BI slicer multiple columns without hierarchy
Power BI Slicer Multiple Columns
Power BI Slicer Multiple Columns is a feature in Power BI that allows you to filter data based on more than one column simultaneously. Think of it as a tool that helps you narrow down data in your report by selecting criteria from multiple categories.
For example, you can use it to filter sales data by both product type and region at the same time, making your data analysis more flexible and specific.
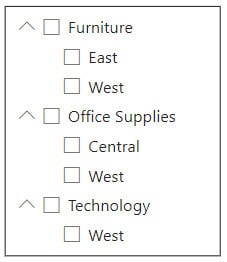
How to Create Slicer With Multiple Columns in Power BI?
Imagine you are a sales manager for a company, and you need to analyze sales data across different regions and product categories. You want to create a slicer that allows you to filter your sales report based on combinations of regions and product categories.
According to this scenario, we have a SharePoint list named Retail Sales that contains the following columns with various data types:
| Columns | Data types |
|---|---|
| Date | Data and time |
| Region | Single line of text |
| Category | Single line of text |
| Sales | Currency |
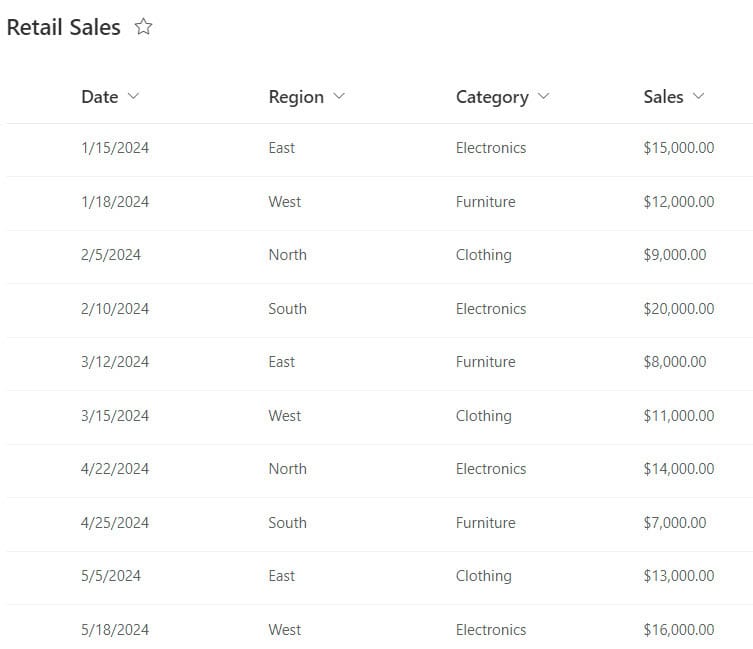
Now follow the below steps:
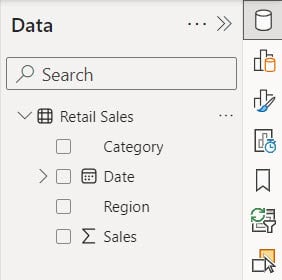
1. Open Power BI Desktop and load the above SharePoint List in Power BI Desktop. Then, you can see the data presented in the Data pane.
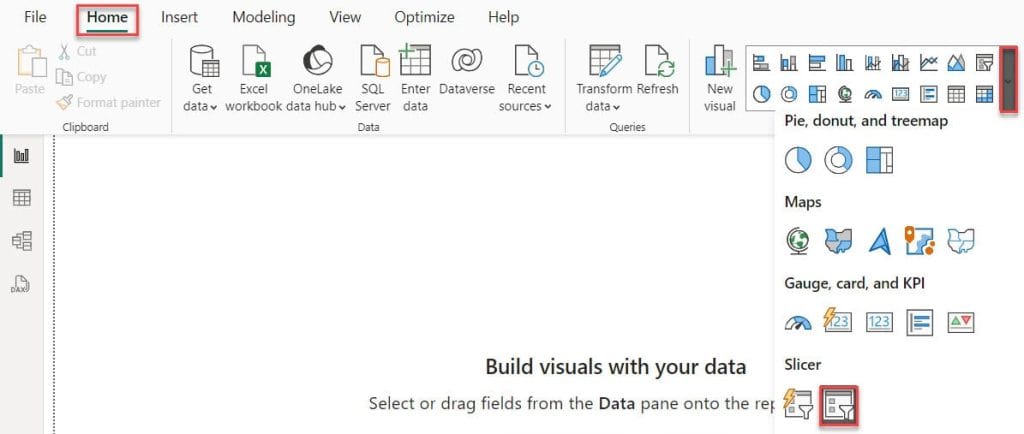
2. Under the Home tab, expand Visual gallery -> Click the Slicer visual.
Here, do not use Silcer (new) because we do not add more than of field in Slicer (new).
3. Then, using the +Add data option, add Category and Region into the Field.
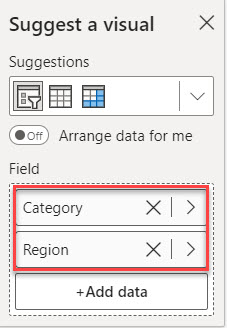
4. You will see that our multiple-column slicer has been created successfully.
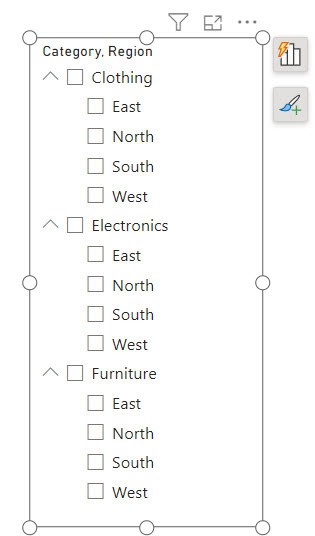
This way, you can create a slicer with multiple columns in Power BI.
Power BI Slicer with Multiple Fields
Let’s see how to use the Slicer visual with multiple fields in Power BI.
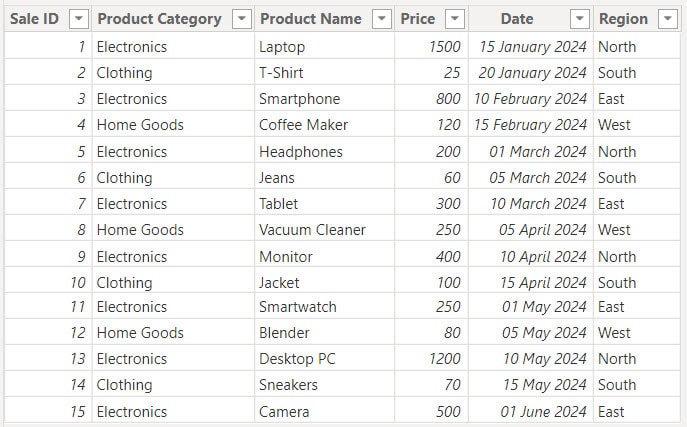
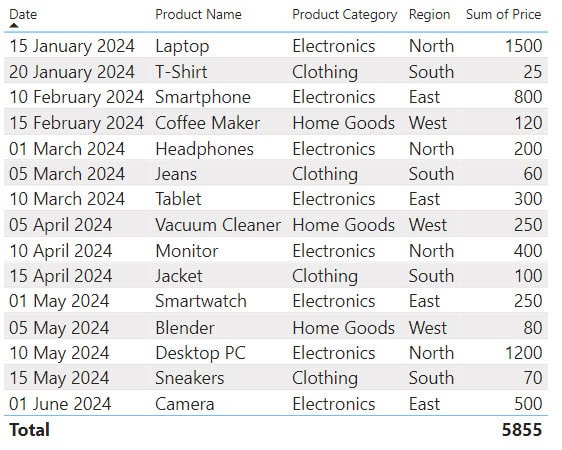
To do this, I already loaded the below data set in Power BI:
Now follow the below steps:
1. Here, First, we created a Product hierarchy that contains the Product Category, Region, and Product Name columns.
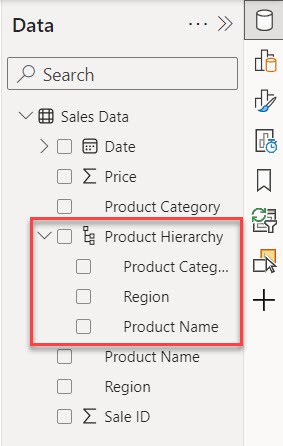
If you don’t know how to create a hierarchy, check out our hierarchy tutorial.
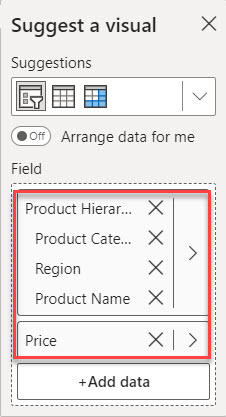
2. Under the Home tab, expand Visual gallery -> Click the Slicer visual. Then, using the +Add data option, add Product hierarchy and Price into the Field.
3. Here, I created a table visual that contains the Date, Product Name, Product Category, Region, and Price columns.
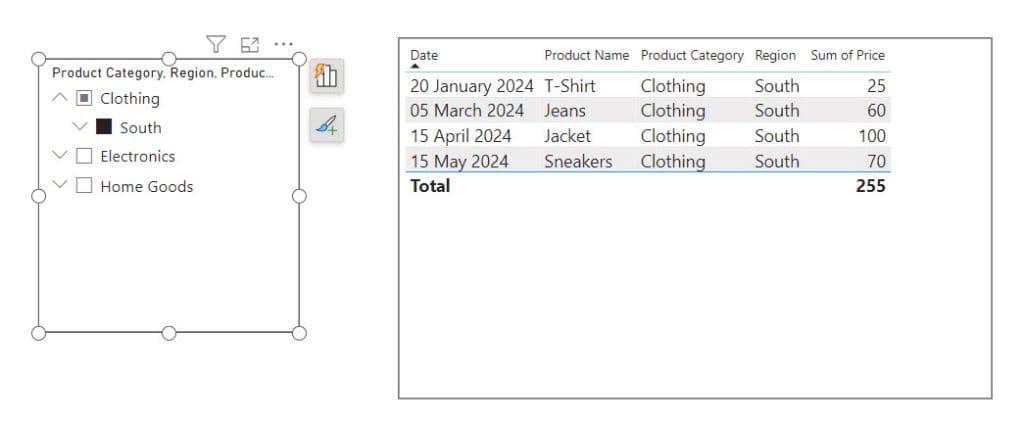
4. Expand the Clothing category in the slicer visual. Then, when I select South, only Clothing products and sales items from the South region will be displayed in the table visually.
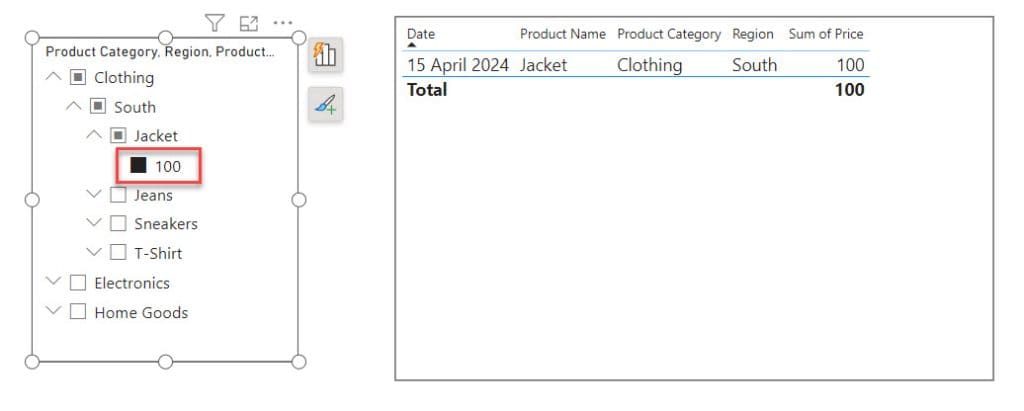
5. If you expand further and select the price, the table visual will show only the items with the selected price.
This is how to use the Slicer visual with multiple fields in Power BI.
Power BI Slicer Vertical List Multiple Columns
Now we see how to create a vertical list of multiple columns Power BI Slicer.
Imagine you’re making a slicer with multiple columns containing Product Categories and Product Names. However, you notice that the slicer isn’t displaying as a vertical list with multiple columns.
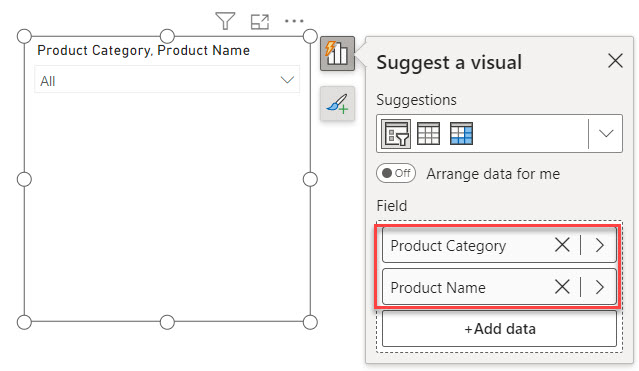
To do a vertical list of multiple columns, follow the below steps:
1. Select the slicer visual -> click format option -> expand the Slicer settings -> select Vertical list.
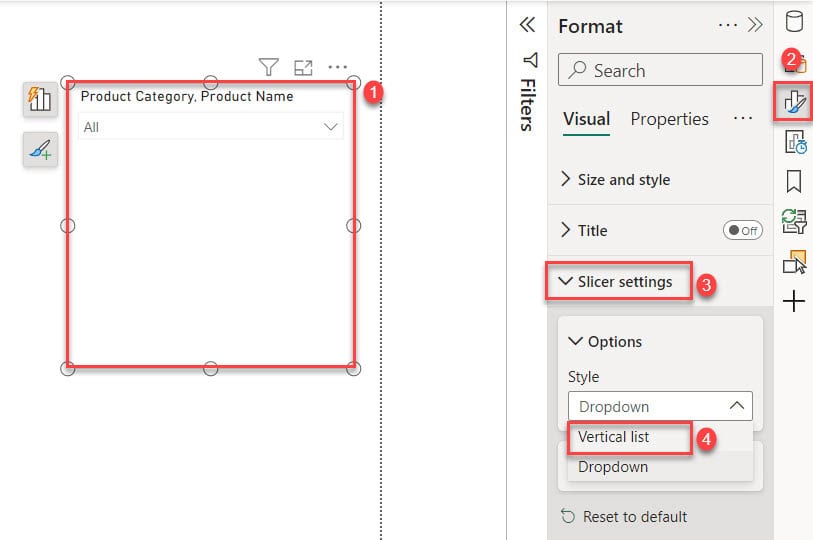
2. Then, you can see the Slicer vertical list of multiple columns created.
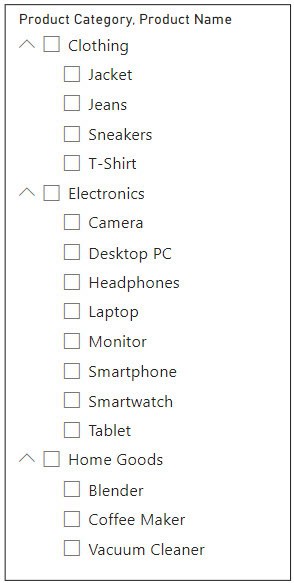
This way, you can display the Power BI slicer vertical list of multiple columns.
Power BI Slicer Search
This example shows how to find a search option in Power BI Slicer.
Here, I created a Power BI slicer that shows all the Product names.
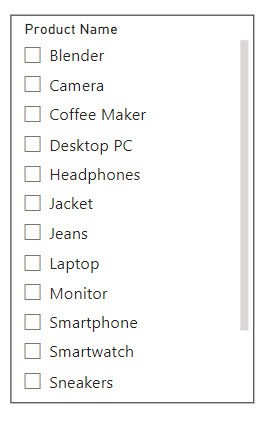
To add a search box to the slicer, follow the below steps:
1. Select the slicer and click the three dots at the top. Then, choose ‘Search’.
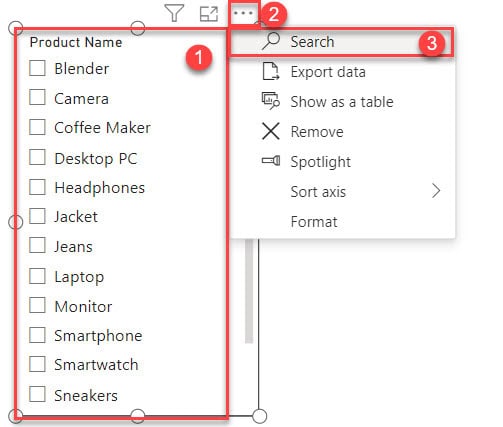
2. Then, you can see a search box added to the slicer.
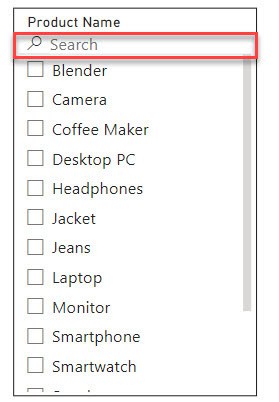
This way, you can add a search box to the Power BI slicer.
Power BI Slicer Multiple Columns Without Hierarchy
This example shows how to create slicer multiple columns without hierarchy.
Here, we are using the above data set containing the Date, Product Name, Product Category, Region, and Price columns.

Now follow the below steps:
1. Under the Modeling tab, expand the New parameter and click Fields.
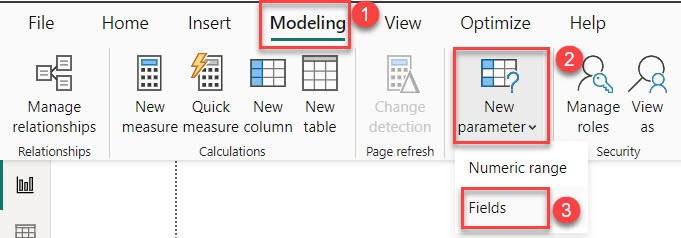
2. In the Parameters window, name your fields and select the columns you want for the multiple-column slicer. Then, click ‘Create’.
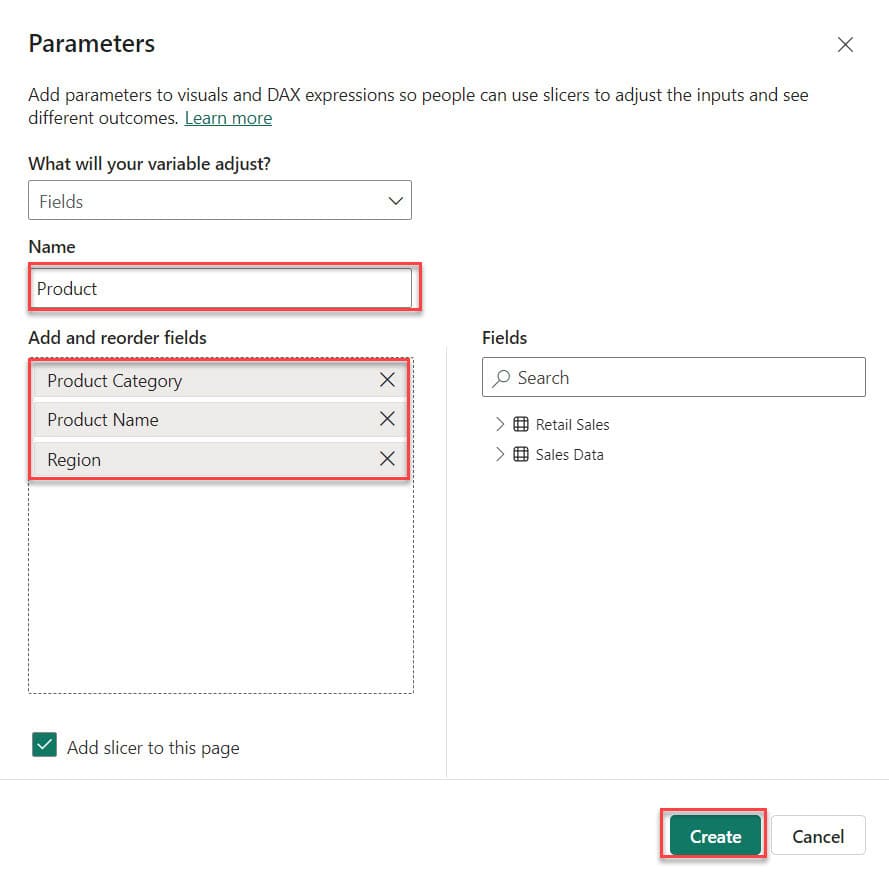
3. Then you can see it automatically created a slicer.
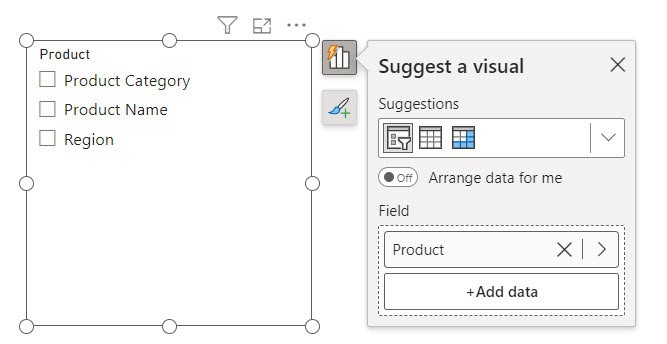
4. A new table will be created in the data panel. You can use this table to create any visual. Here, I’ve created a column chart and added the product from the new table.
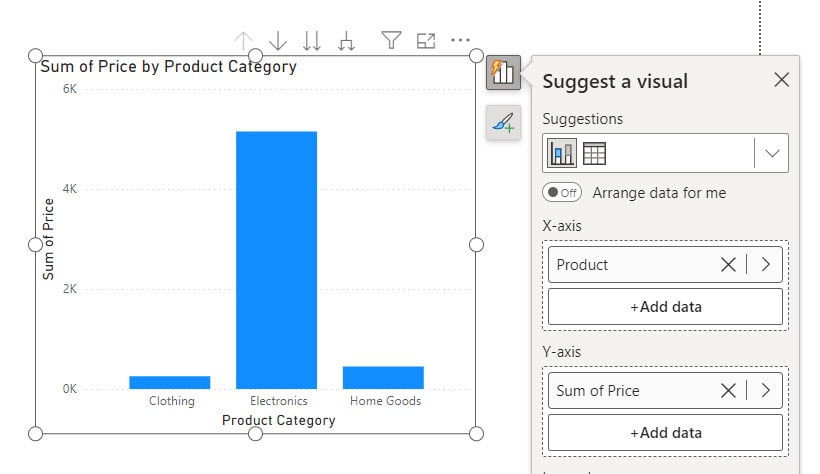
5. When I select a Product Category, the column chart shows the Price by That Category. When I select a Product Name, the column chart shows the Price by That Name.

This way, you can create a Power BI slicer with multiple columns without hierarchy.
In this article, we covered how to create a slicer with multiple columns in Power BI, how to set up a slicer with a vertical list of multiple columns, how to use a slicer with multiple fields, how to implement a slicer search feature, and how to configure a slicer with multiple columns without hierarchy.
You may also like the following tutorials:
- Power BI Slicer Sort Descending
- How to Remove Blank From Power BI Slicer?
- Power BI date slicer between a default to today
- How to sort slicer by another column in Power BI
I am Bijay a Microsoft MVP (10 times – My MVP Profile) in SharePoint and have more than 17 years of expertise in SharePoint Online Office 365, SharePoint subscription edition, and SharePoint 2019/2016/2013. Currently working in my own venture TSInfo Technologies a SharePoint development, consulting, and training company. I also run the popular SharePoint website EnjoySharePoint.com