Sometimes, you may receive a requirement to create a new table from an existing table in Power BI. This task can be for various reasons, such as organizing data more effectively or preparing it for specific analyses and visualizations.
So, I thought to show you how to create a table from an existing table in Power BI. Additionally, we will cover the following topics:
- Create a table from another table with the condition in Power BI
- Creates a table from another table with a filter in Power BI
- Create a new table in Power BI from the existing two tables
- Creates a table from another table in Power BI Power Query Editor
- Create a new table in Power Query from the existing two tables
- Creates a table from another table using Power BI DAX
- Create a table from another table with distinct values in Power BI
Create a Table From an Existing Table in Power BI
While working on Power BI, I got a requirement for a company that sells various Software products worldwide. They want a list of all product categories and their total sales amounts in a Power BI report. So, in that case, creating a table from an existing table in Power BI is the best option. Now follow the below steps to do this:
According to this scenario, I have a SharePoint list named Sales Data that contains the following columns with various data types:
| Columns | Data Types |
|---|---|
| Transaction ID | Single line of text |
| Product Name | Single line of text |
| Product Category | Single line of text |
| Sales Amount | Currency |
| Date | Date and time |
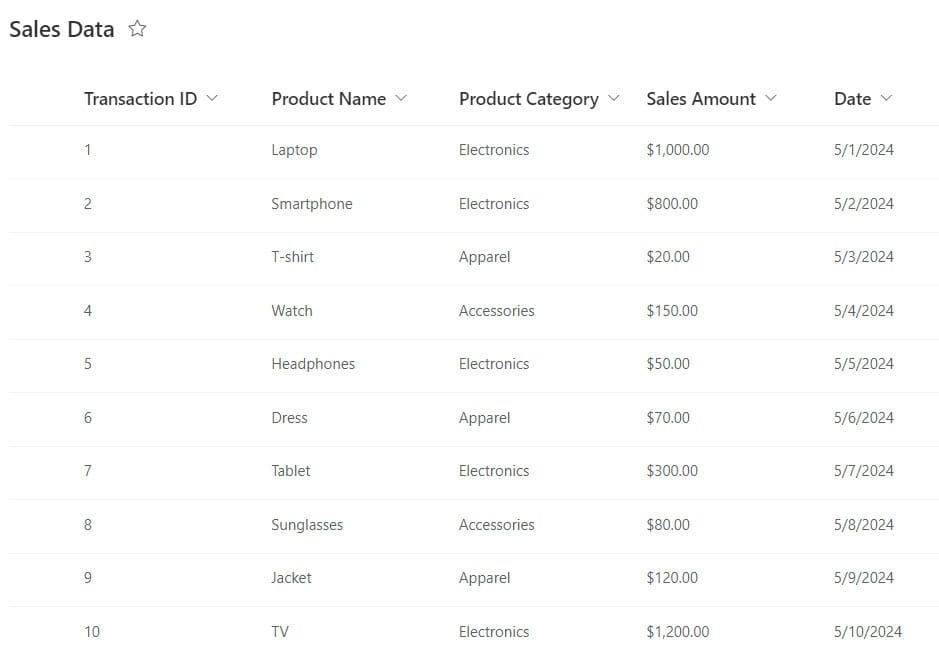
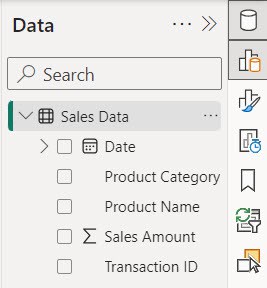
1. Open Power BI Desktop and load the above SharePoint List in Power BI Desktop. Then, you can see the data presented in the Data pane.
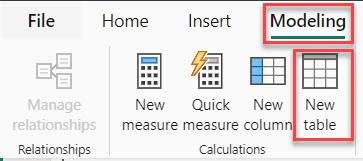
2. Under the “Modeling” tab, click “New table.”
3. Then, in the formula bar, put the below DAX expressions.
SummaryTable = SUMMARIZE('Sales Data', 'Sales Data'[Product Category], "Total Sales", SUM('Sales Data'[Sales Amount]))Where:
- SummaryTable = This names the table we’re creating, which summarizes sales data by product category.
- SUMMARIZE() = This function creates a summary table by grouping data based on specified columns and calculating aggregations.
- ‘Sales Data’ = This specifies the table from which we summarize the data, in this case, the ‘Sales Data’ table.
- ‘Sales Data'[Product Category] = This specifies the column by which we are grouping the data. The ‘Product Category’ column is from the ‘Sales Data’ table.
- “Total Sales” = This is the name of the new column in the summary table. It will contain the total sales amount for each category.
- SUM(‘Sales Data'[Sales Amount]) = This is the aggregation calculation for the “Total Sales” column. It calculates the sum of the ‘Sales Amount’ column in the ‘Sales Data’ table for each group.

4. When you go to the table view and click on “SummaryTable,” you will see the sales data organized by product category.

Let’s look at another example: Create a table with Conditions in Power BI from another table.
Create a Table from Another Table with Condition in Power BI
Suppose you want to analyze sales performance by creating a separate table that only includes transactions where the sales amount is greater than 500.
According to this scenario, I have a data set in Power BI with transaction ID, customer ID, date, sales amount, and product ID, as shown in the screenshot below.
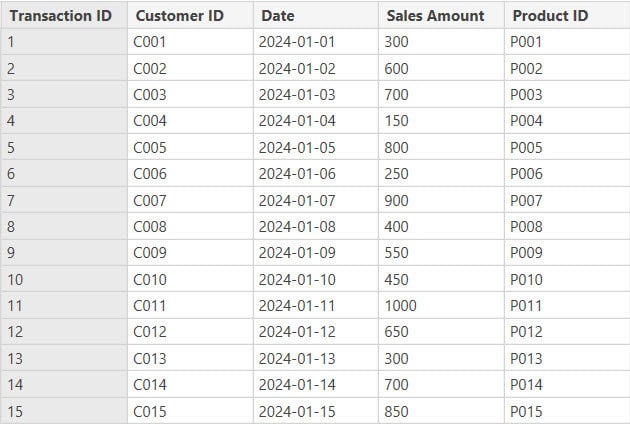
Now follow the below steps:
Under the “Modeling” tab, click “New table.” Then, in the formula bar, put the below DAX expressions.

HighValueSales = FILTER('Sales Table', 'Sales Table'[Sales Amount] > 500)Where:
- HighValueSales = This names the new table we’re creating, which will contain sales data for high-value transactions.
- FILTER() = This function returns a table that includes only the rows that meet the specified condition.
- ‘Sales Table’ = This specifies the table we’re filtering, which contains the sales data.
- ‘Sales Table'[Sales Amount] > 500 = This is the condition we’re applying to the filter. It includes only rows where the ‘Sales Amount’ is greater than 500.

Go to the Table view, select HighValueSales in Data files, and look at the table to find sales amounts greater than 500.

This way, you can create a Table From Another Table with Condition in Power BI.
Create a Table From Another Table using Power BI DAX
Here, I have a dataset in Power BI that contains Product ID, Product Name, Category, Quantity Sold, and Unit Price. Please check the screenshot below.
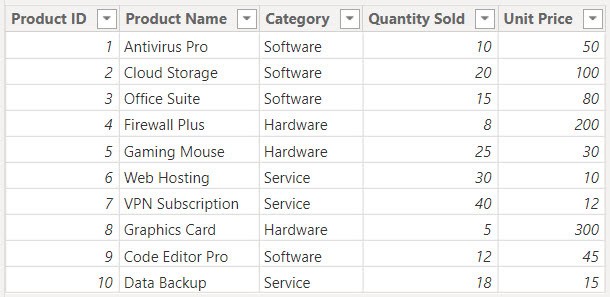
Now follow the below steps:
Go to the Table view and click ‘New table‘ under the Home tab.

Then, in the formula bar, paste the following DAX expression.
SalesSummary =
GROUPBY(
    'Product Sales',
    'Product Sales'[Category],
    "TotalSalesAmount", SUMX(CURRENTGROUP(), 'Product Sales'[Quantity Sold] * 'Product Sales'[Unit Price])
)
Where:
- SalesSummary = This part names the table we create, summarizing sales data by category.
- GROUPBY() = This function creates a summary table that groups data by one or more columns. It allows for custom aggregations within each group.
- ‘Product Sales'[Category] = This specifies the column by which we are grouping the data. In this case, it’s the ‘Category’ column from the ‘Product Sales’ table.
- “TotalSalesAmount” = This is the name of the new column we’re creating within each group. It will contain the total sales amount for that category.
- SUMX(CURRENTGROUP(), ‘Product Sales'[Quantity Sold] * ‘Product Sales'[Unit Price])= This part defines the calculation for the “TotalSalesAmount” column.
- SUMX() = This function performs row-by-row calculations and then summarizes the results.
- CURRENTGROUP() = This function returns the table that represents the current group being processed by GROUPBY.
- ‘Product Sales'[Quantity Sold] * ‘Product Sales'[Unit Price] = This multiplies the quantity sold by the unit price for each row in the current group to get the total sales amount for that row.

Then you can see in the table view a new table created.

Create a New Table From an Existing Table with Power BI Filter
Suppose you have a large dataset in Power BI containing information about all the sales transactions over the past and this year. Your manager wants to see data specifically focusing on the sales made in the last quarter (last three months).
Instead of manually filtering the data with the Power BI filter pane, We can create a new table that only includes sales data from the last quarter.
The screenshot below displays the dataset we’ve loaded into Power BI.
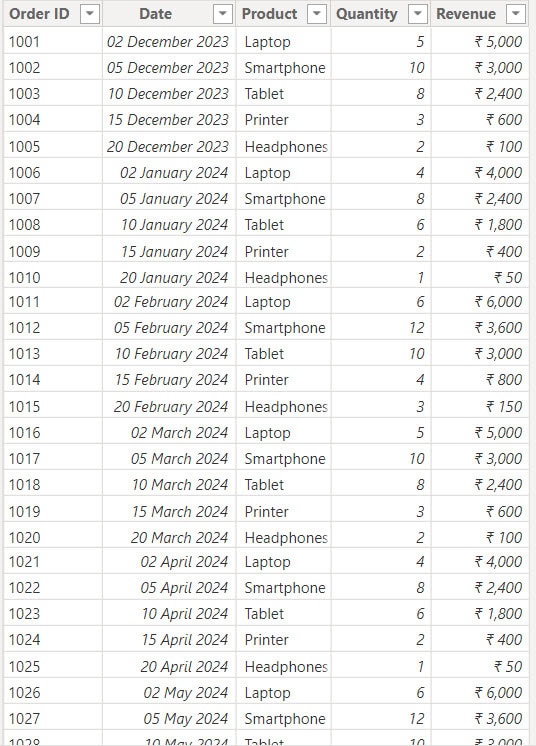
Now follow the below steps to do this:
Go to the Table view and click ‘New table‘ under the Home tab.

Then, in the formula bar at the top, enter a formula to filter the data for the last quarter. I am using the DAX expression below.
QuarterlySalesData = FILTER(Sales, Sales[Date] >= DATE(YEAR(TODAY()), MONTH(TODAY())-2, 1))Where:
- QuarterlySalesData = This name is for the new table we’re creating, which will contain sales data for the current quarter.
- FILTER() = This function returns a table that includes only the rows that meet the specified condition.
- Sales = This specifies the table we’re filtering, which contains the sales data.
- Sales[Date] >= DATE(YEAR(TODAY()), MONTH(TODAY())-2, 1) = This condition filters the rows to include only those where the ‘Date’ column is on or after the first day of the current quarter.

In the table view, you will find a new table named QuarterlySalesData. It contains sales data from the last quarter.
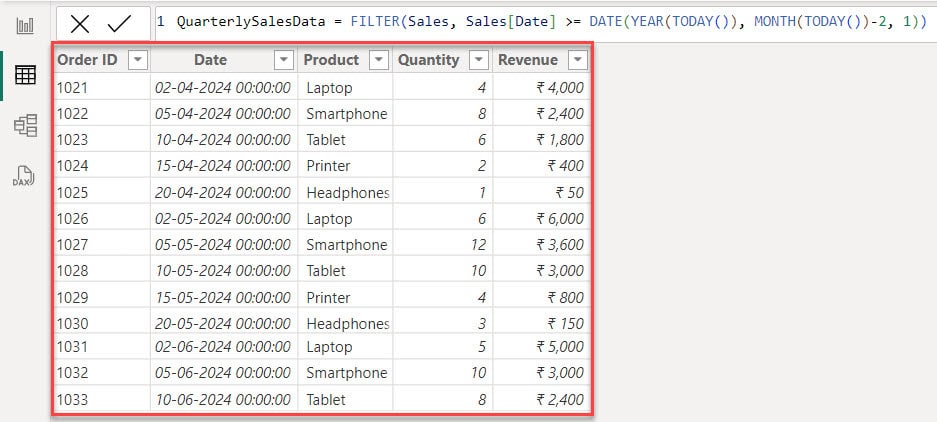
This way, you can create a new table from an existing table with a filter in Power BI.
Create a New Table From an Existing Columns in Power BI
Suppose we have a data set that includes many columns, such as Date, Product, Quantity, Amount, Salesperson, Region, and Category.

For reporting purposes, you want to create a simplified version of this table that only includes the Date, Product, Quantity, and Amount columns.
To do this, follow the below steps:
Open the Power BI Desktop and load the above table. Then, under the Modeling tab, click the New table.
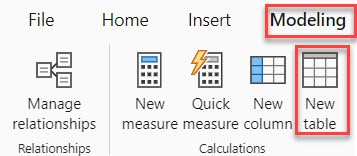
In the formula bar, put the below DAX expression:
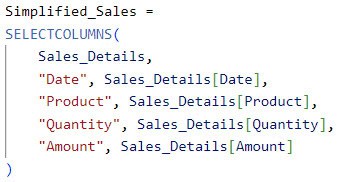
Simplified_Sales =
SELECTCOLUMNS(
    Sales_Details,
    "Date", Sales_Details[Date],
    "Product", Sales_Details[Product],
    "Quantity", Sales_Details[Quantity],
    "Amount", Sales_Details[Amount]
)
Where:
- Simplified_Sales = This is the name of the new table we are creating.
- SELECTCOLUMNS() = This function creates a new table with selected columns from an existing table and optionally renames these columns.
- Sales_Details = This specifies the source table from which we are selecting columns.
- “Date”, Sales_Details[Date] = This selects the ‘Date’ column from the Sales_Details table and renames it to “Date”.
When you go to the table view, you will see one table, Simplified_Sales.
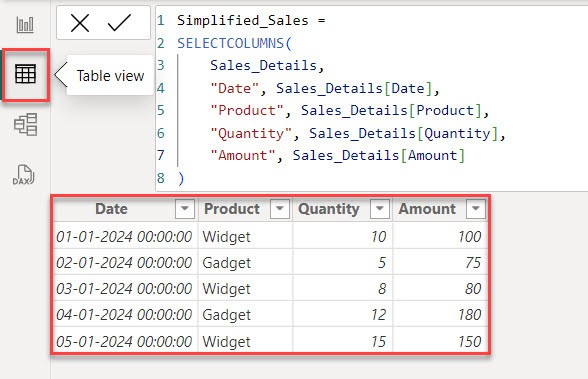
Following the above steps, you can create a new table from an existing table in Power BI.
Create a New Table in Power BI From the Existing Two Tables
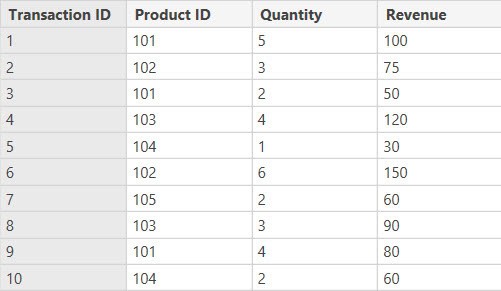
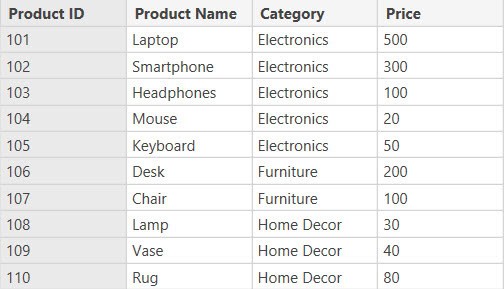
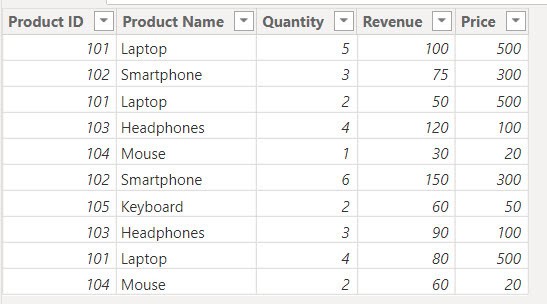
For this example, I have two tables in Power BI: one containing information about sales transactions (Transaction Table) and another containing details about products (Product Table). Now, I want to create a new table in Power BI that combines relevant information from both tables.
Transaction Table:
Product Table:
Now follow the below steps to create a new table:
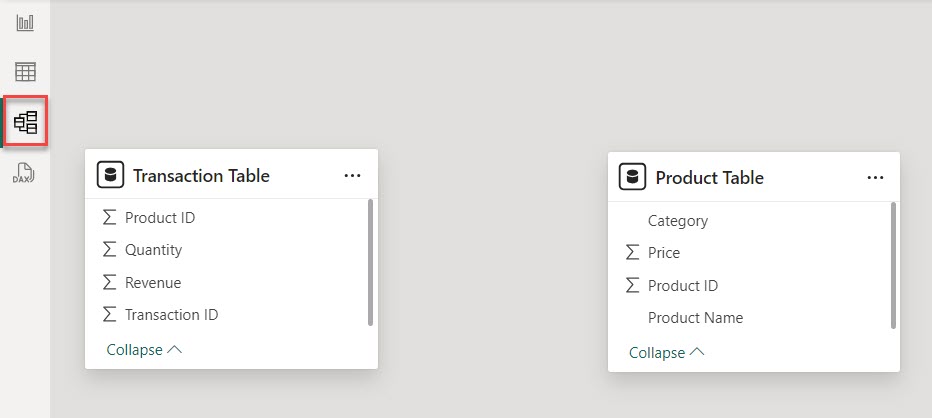
First, go to the Model View and check whether the two tables establish a relationship. This is usually done automatically if there are common fields (like Product ID in this case) that can be used to establish the relationship.
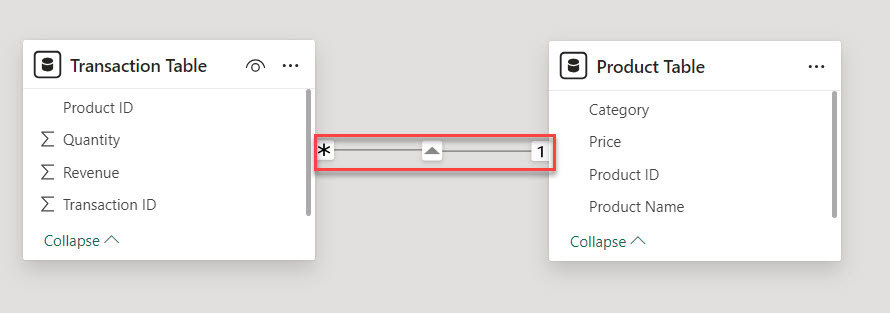
If a relationship isn’t created automatically, click and drag the Product ID column from the Transaction Table to the Product ID column in the Products Table. A line will appear between the two tables, showing that a relationship has been made.
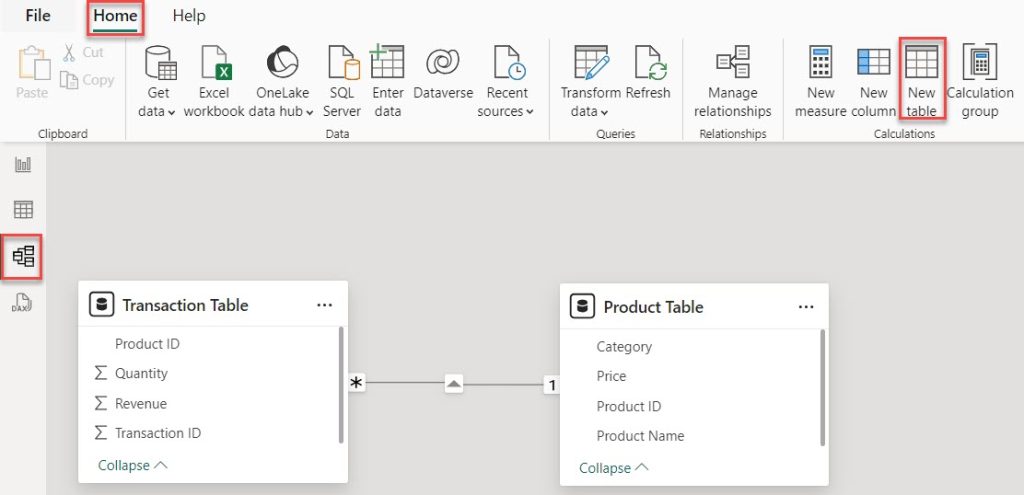
Then, inside the Model view, click ‘New Table‘ from the Home tab.
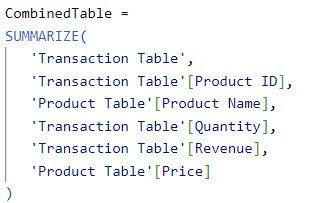
Then, in the formula bar, put the DAX expression below.
CombinedTable =
SUMMARIZE(
   'Transaction Table',
   'Transaction Table'[Product ID],
   'Product Table'[Product Name],
   'Transaction Table'[Quantity],
   'Transaction Table'[Revenue],
   'Product Table'[Price]
)
Where:
- CombinedTable = This name is for the table we’re creating, which combines data from the ‘Transaction Table’ and the ‘Product Table’.
- SUMMARIZE() = This function creates a summary table by grouping data based on specified columns and calculating aggregations.
- ‘Transaction Table’ = This specifies the first table from which we summarize the data, in this case, the ‘Transaction Table’.
- ‘Transaction Table'[Product ID] = This specifies the column from the ‘Transaction Table’ by which we are grouping the data. It’s the ‘Transaction ID’ column.
- ‘Product Table'[Product Name], ‘Transaction Table'[Quantity], ‘Transaction Table'[Revenue], ‘Product Table'[Price] = These specify the additional columns we want to include in the summary table.
Then, you see a new table created in our data set.
Create a Table From Another Table using Power BI Power Query Editor
Suppose you have a data set in Power BI, like the screenshot below.
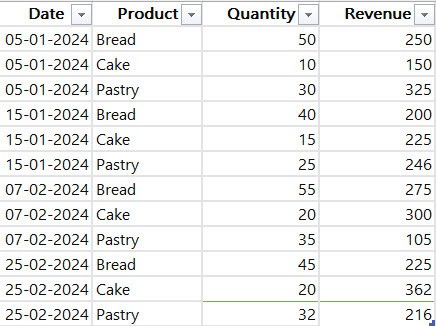
Now follow the below steps to do this:
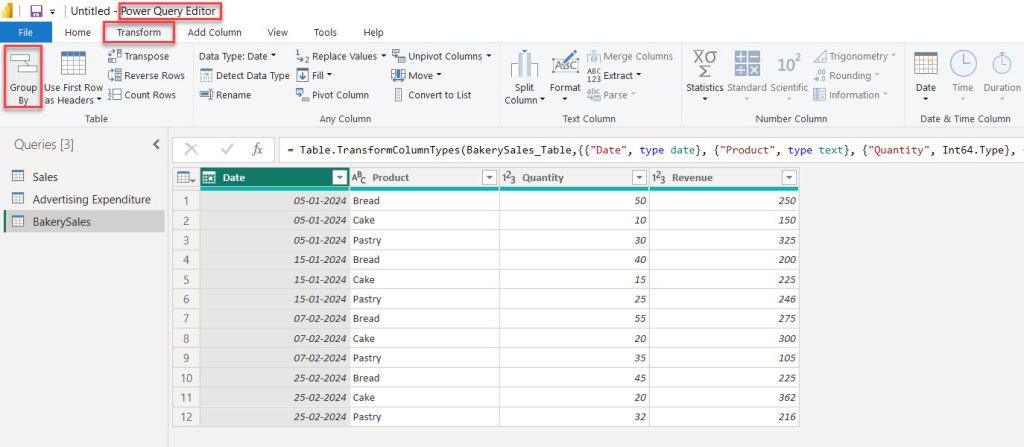
Under the Home tab, click Transform date.

In the Power Query Editor, under the Transform tab, click Group By.
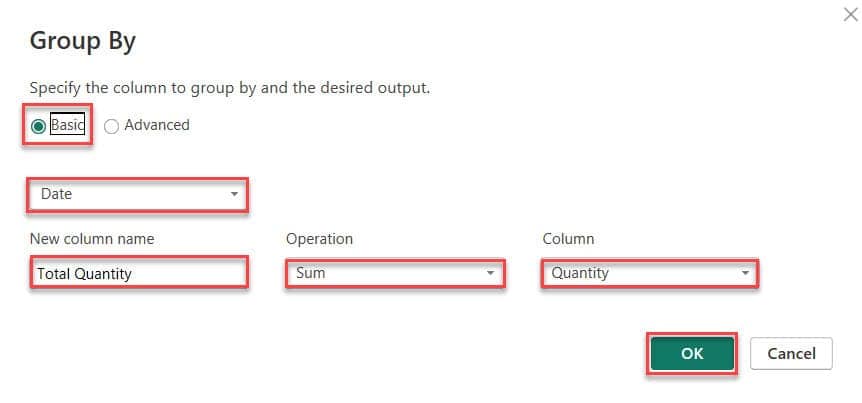
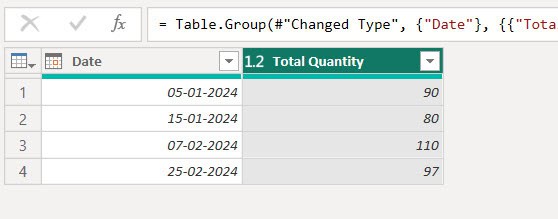
Once the Group By window opens, choose the “Basic” option. After that, select the “Date” columns. Next, name the column and choose “Sum” as the operation. Finally, select the “Quantity” column. Then click OK.
Then, you can see a new table in the Power Query Editor.
Create a New Table From Two Existing Tables in Power BI DAX
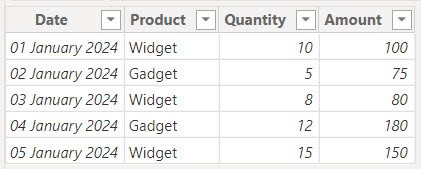
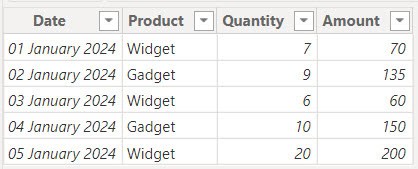
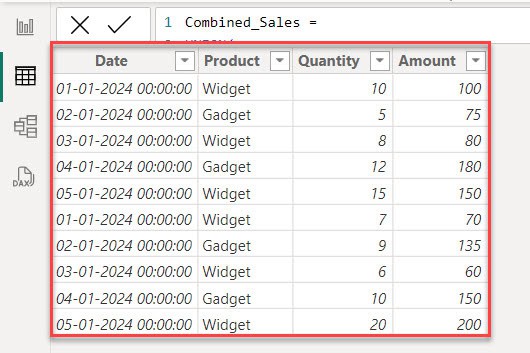
In this example, we have two tables: one for North sales and one for South sales. We will combine these tables to create one table using the Power BI DAX UNION function.
Sales_North:
Sales_South:
Now follow the below steps:
1. Open the Power BI Desktop and load the above table. Then, under the Modeling tab, click the New table.

2. In the formula bar, put the below DAX expression:
Combined_Sales =
UNION(
    SELECTCOLUMNS(
        Sales_North,
        "Date", Sales_North[Date],
        "Product", Sales_North[Product],
        "Quantity", Sales_North[Quantity],
        "Amount", Sales_North[Amount]
    ),
    SELECTCOLUMNS(
        Sales_South,
        "Date", Sales_South[Date],
        "Product", Sales_South[Product],
        "Quantity", Sales_South[Quantity],
        "Amount", Sales_South[Amount]
    )
)
Where:
- Combined_Sales = This is the name of the new table we are creating.
- UNION() = This function combines the rows from two or more tables into a single table.
- SELECTCOLUMNS() = This function selects specific columns from a table and optionally renames them.
3. When you go to table view you can see one table Combined_Sales.
Create a Table From Another Table With Distinct Values in Power BI
Suppose you have a dataset (‘Product Performance’) that includes information such as Product Category, Product Name, Sales Channel, and sales Amount.
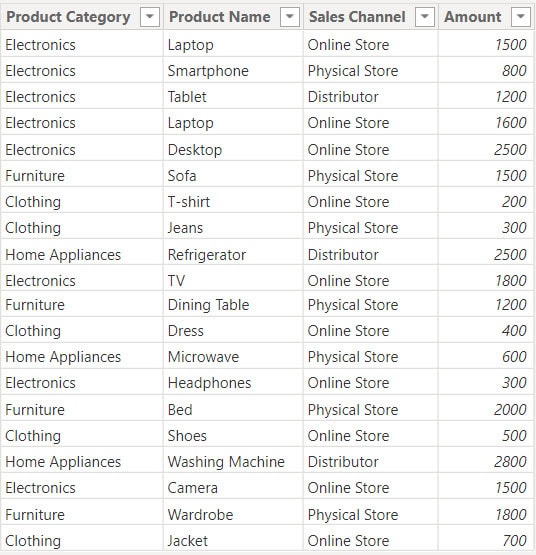
Your goal is to create a table that shows each unique Product Category alongside the total sales Amount.
To do this, follow the below steps:
Open Power BI Desktop and load the dataset mentioned above. Then, go to the Modeling tab and click on ‘New table‘. In the formula bar, enter the following DAX expression.
DistinctTable =
VAR DistinctValues =
    ADDCOLUMNS(
        DISTINCT('Product Performance'[Product Category]),
        "TotalAmount", CALCULATE(SUM('Product Performance'[Amount]))
    )
RETURN
    DistinctValues
Where:
- DistinctTable = This is the name of the new table we are creating.
- VAR DistinctValues = Defines a variable named DistinctValues.
- ADDCOLUMNS() = Creates a new table by adding a calculated column to an existing table.
- DISTINCT(‘Product Performance'[Product Category]) = Retrieves unique values from the ‘Product Category’ column in the ‘Product Performance’ table.
- “TotalAmount” = Name for the new calculated column being added.
- CALCULATE(SUM(‘Product Performance'[Amount])) = Calculates the total sum of the ‘Amount’ column from the ‘Product Performance’ table, considering any filters that might apply.
- RETURN DistinctValues = Returns the table generated by the ADDCOLUMNS function, which includes distinct product categories and their corresponding total amounts.

You will now see the DistinctTable column added in the Data pane. Clicking on it will display the screenshot below.
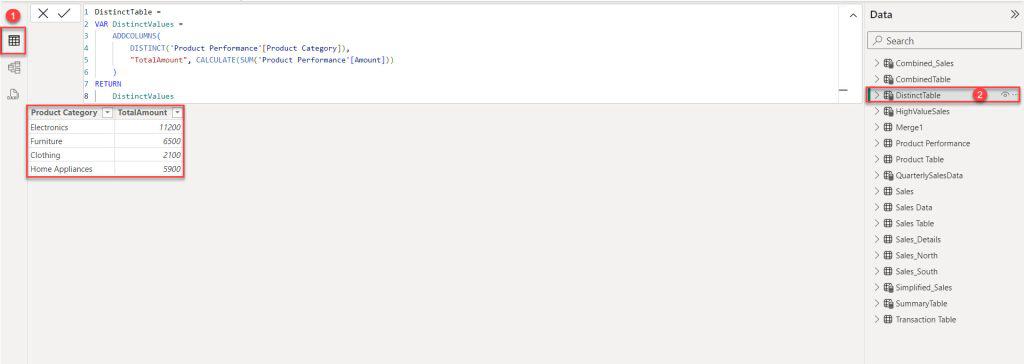
This way, you can create a table from another with distinct values in Power BI.
Conclusion
I hope you follow all the above examples to create a new table in Power BI from another table.
In this tutorial, I covered how to create a table from another table in Power BI, including creating tables based on specific conditions, generating new tables from existing columns, filtering existing tables to create new ones, and combining two existing tables to form a new one.
Also, you may like:
- Add Data to Existing Table in Power BI
- Append Columns in Power BI using Power Query Editor
- Compare Two Columns in Different Tables in Power BI
- Create a table in Power BI using Power Query Editor
I am Bijay a Microsoft MVP (10 times – My MVP Profile) in SharePoint and have more than 17 years of expertise in SharePoint Online Office 365, SharePoint subscription edition, and SharePoint 2019/2016/2013. Currently working in my own venture TSInfo Technologies a SharePoint development, consulting, and training company. I also run the popular SharePoint website EnjoySharePoint.com
Very useful article
HI, WHEN ADDING A COLUMNS IN THE QUERY EDITOR, HOW CAN I ADD MORE THAN 1? HOW IS THE SYNTAX FOR IT?
= #”LND_SPF_PDREPORT”[Qtr Year Query] + COLUMN 2, 3, 4, ETC
(IN HERE)
If we want more columns then in the Query we can add the column names and execute it.
when I use your method in “Power bi create table from another table selected columns” all the duplicated rows are gone
It was very useful. Thanks a lot.