Do you ever know how to add columns using the Power Query in Power BI? This Microsoft Power BI Tutorial explains everything related to adding columns using the Power Query in Power BI. Also covered the below-mentioned topics:
- Power query add column
- Power Query add column Syntax
- How to add a column using the Power Query editor
- Power query add column and change type
- Power query add column index
- Power query add column from another table
- Power query add column with source name
- Power query add column concatenate two columns
- power query add column from another query
- Power query add column with text
- Power query add column ribbon
- Power query add column count rows
- Power query add column sum
- Power query add column to group by
- Power query add column distinct count
- Power query add column at the beginning
- Power query add column null
- Power query add column as number
- Power query adds a new column to an existing table
- Power query add column empty
- Power query add column headers
- Power query add column range
- Power query add column hyperlink
- Power query add column max value
- Power query add column minimum
- Power query add column average
- Power query add column advance editor
- Power query add column DAX
- Power query add column lookup value from another table
- Power query add column extract
- Power query add column left function
- Power query add column right function
- Power query add column based on parameter
- Power query add an editable column
- Power query add join column
- Power query add column key
- Power query add column based on the list
- Power query add column divider
Power query add column
- Power query add column allows us to add new data to the already existing table data. We can create a new custom column in the Power Query editor by using the Add Column > Custom Column feature.
- When we create a custom column in the power query editor, it appears in the Fields list just like any other field in the data, Power Query validates the formula syntax in the formula bar.
Power Query add column Syntax
To add a new custom column to the Table using the power query editor in Power BI, Follow the below-mentioned Syntax code.
Table.AddColumn(table as table, newColumnName as text, columnGenerator as function, optional columnType as nullable type) as table| Data Type | Syntax 1 | Syntax 2 |
| Whole Number | Int64.Type | type number |
| Decimal Number | Number.Type | type number |
| Dates | Date.Type | type date |
| Text | Text.Type | type text |
The above-mentioned table represents the syntax of the power query editor to add the new column.
Read How to Filter Power BI Dax Based On Condition
How to add a column using the Power Query editor
Let us see how we can add a column using the power query editor in Power BI.
- In this example, I will use the Products Table data as mentioned below. You can download the sample data from here. In this example, I am going to create a custom column to find the Profit value of the Products.
- Now we will see how we can add the new custom column to the table using the Power Query editor.
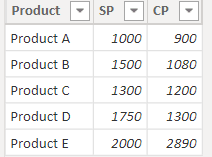
To achieve this follow the below-mentioned steps:
- Open the Power BI desktop, and load the table data into it, In the ribbon, under the Home option click on the Transform data option as shown below:
- So that it will redirect to the power query editor, where we can add custom columns to the table.

- Once it is redirected to the Power Query editor, under the Add column option, select the Custom column as highlighted below:

- Now, enter the New column Name. Insert an existing column into the Custom Column Formula box by selecting a column from the Available Columns list, and then select the Insert option.
- To calculate the Profit value, the formula is mentioned below:
= [SP]-[CP]- Where SP & CP are existing column names, Profit is the new custom column. Once the formula has been added to the formula box, click on the Ok button.
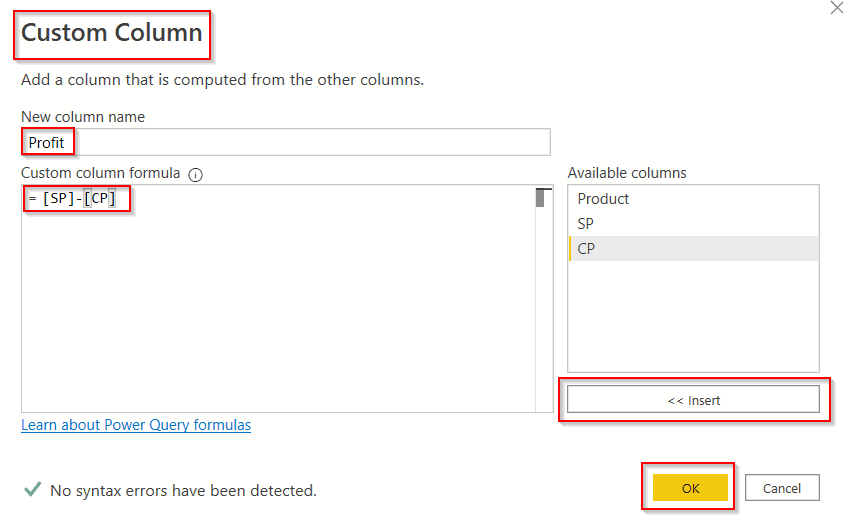
- In the below screenshot you can see that the custom column has been added with the expected result value.
= Table.AddColumn(#"Changed Type", "Profit", each [SP]-[CP])- Click on the Close and Apply option from the ribbon so that the changes will be reflected on the Power BI desktop.

This is how to add a column using the power query editor in Power BI.
Power query add column and change type
Let us see how we can change the data type of the newly added custom column using the power query editor in Power BI.
- By default, when we add a custom column we can’t assign any data type to it. The Data type will be displayed as Any.
- In this example, we change the data type of the newly added custom column to the Whole number type.
Follow the below steps, to change the data type using Power Query Editor:
- In the Power Query editor, Select the column for which you want to change the data type.
- Under the Transform option, expand the Date Type option as highlighted below:
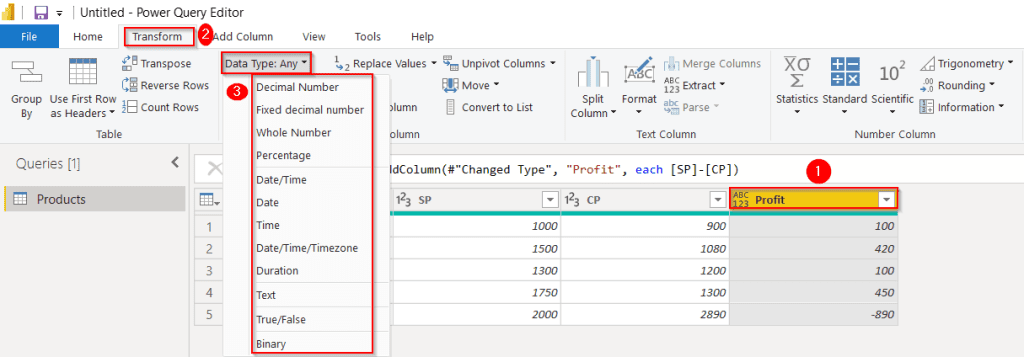
- Now change the date type as per the requirement, in this example, I’m going to change the data type from any to Whole Number data type.
- In the below screenshot, you can see that the data type has been changed to the Whole number.
= Table.TransformColumnTypes(#"Added Custom",{{"Profit", Int64.Type}})- Click on the Close and Apply option from the ribbon so that the changes will be reflected on the Power BI desktop.

Power query add the column and change type example
This is how to change the data type of the newly added custom column using the power query editor in Power BI.
Read How to Append Columns in Power Query
Power query add column index
Let us see how we can add the index column using the power query editor in Power BI.
In this example, I’ll add the index column from an index 0 in the Products table data.
- Open the Power BI desktop, and load the table data into it, In the ribbon, under the Home option click on the Transform data option.
- It will redirect to the power query editor, select the table for which you want to add an index column, and in the ribbon choose the Add column option.
- Expand the index column and choose the starting index, either we can select index 0, index 1, or custom index.

- Click on the close and Apply option, so that changes will appear on the Power BI desktop.
= Table.AddIndexColumn(#"Changed Type1", "Index", 0, 1, Int64.Type)- In the below screenshot, you can see the newly created index column in the Product’s table.

This is how to add an index column using the power query editor in Power Bi.
Read How to add column from another table in Power BI
Power query add column from another table
- Power Query is not supported to add a new custom column from another table. We can only add a new calculated column, using the Power BI DAX function.
- No, it is not possible to add a new custom column from another table using the Power Query editor in Power BI.
Power query add column with source name
Let us see how we can add the new custom column with the source name using the power query editor in Power BI.
In this example, the Source File name is Product we will also see how to create a custom column with the same source name using the Power query editor.
- Open the Power BI desktop, and load the table data into it, In the ribbon, under the Home option click on the Transform data option.
- In the below screenshot, you can see that the Source file name is Product.

- Once it is redirected to the Power Query editor, under the Add column option, select the Custom column.
- Now, enter the New column Name. Insert an existing column into the Custom Column Formula box by selecting a column from the Available Columns list, and then select the Insert option.
- Once the formula has been added to the formula box, click on the Ok button.
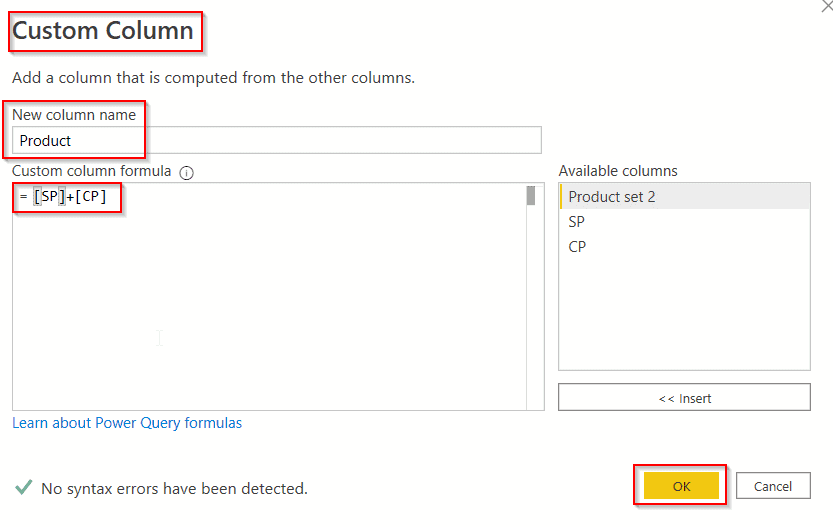
- The screenshot below shows that the custom column has been added with the expected result value.
= Table.AddColumn(#"Renamed Columns", "Product", each [SP]+[CP])- Click on the Close and Apply option from the ribbon to reflect the changes on the Power BI desktop.

- We can also cross-check whether the column has been created with the source name or not in the Advanced Editor mode( Home -> Advanced Editor )as highlighted below:

This is how to add the new custom column with the source name using the power query editor in Power BI.
Read How to Filter Date using Power BI DAX
Power query add column concatenate two columns
Let us see how we can concatenate two columns and display the result in the custom column using the power query editor in Power Bi.
In this example, I have selected the Product column and country column to concatenate from the Product table data.
- Load the table data into the Power BI desktop, In the ribbon, under the Home option click on the Transform data option.
- Once it is redirected to the Power Query editor, under the Add column option, select the Custom column.
- In the custom column formula box, enter the below-mentioned formula. Once the formula has been added to the formula box, click on the Ok button.
Text.Combine({[Product]," , " ,[Country]})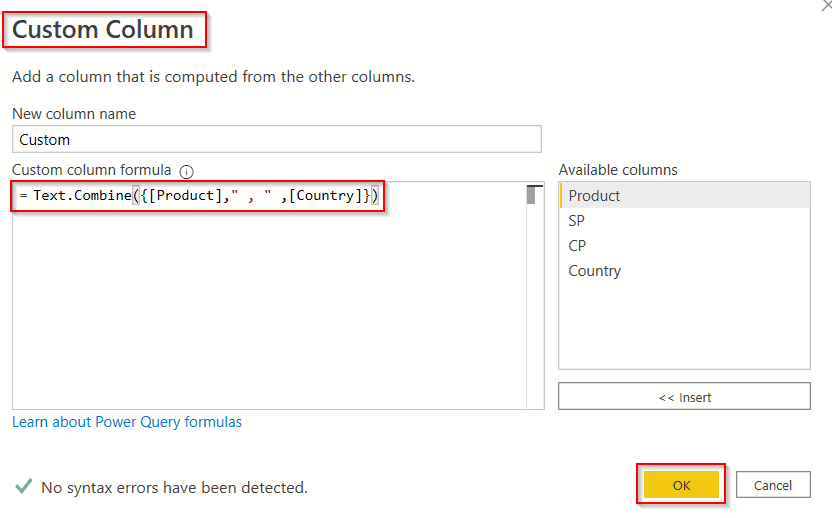
- In the below screenshot, you can see that the custom column has been concatenated with the existing two-column data.
= Table.AddColumn(#"Changed Type", "Custom", each Text.Combine({[Product]," , " ,[Country]}))- Click on the Close and Apply option from the ribbon to reflect the changes on the Power BI desktop.

This is how to concatenate two columns and display the result in the custom column using the power query editor in Power Bi.
Power query add column from another query
Let us see how we can add a custom column from another query using the power query editor in Power BI.
- Load the table data into the Power BI desktop, In the ribbon, under the Home option click on the Transform data option.
- Once it is redirected to the Power Query editor, under the Add column option, select the Column From Examples.

- In the Custom column pop-up window, enter the Sample value, select ctrl +enter and click on the Ok button as highlighted below:

- In the below screenshot, you can see that the custom column has been concatenated with the existing two-column data.
= Table.AddColumn(#"Changed Type", "Product - Copy", each [Product], type text)- Click on the Close and Apply option from the ribbon to reflect the changes on the Power BI desktop.

This is how to add a custom column from another query using the power query editor in Power BI.
Read How to merge columns in Power Query
Power query add column with text
Let us see how we can add the custom column with specific text in each row using the Power Query editor in Power Bi.
- In this example, I have used the Product table data. Load the table data into the Power BI desktop, In the ribbon, under the Home option click on the Transform data option.
- Once it is redirected to the Power Query editor, under the Add column option, select the index column.
= Table.AddIndexColumn(#"Changed Type", "Index", 1, 1, Int64.Type)
- Once the index column has been added find the MOD value, based on the mod we can add a specific text in each row. For that apply the below-mentioned formula. Once the formula has been added to the formula box, click on the Ok button.
= Table.AddColumn(#"Added Index", "Mod", each Number.Mod([Index],3))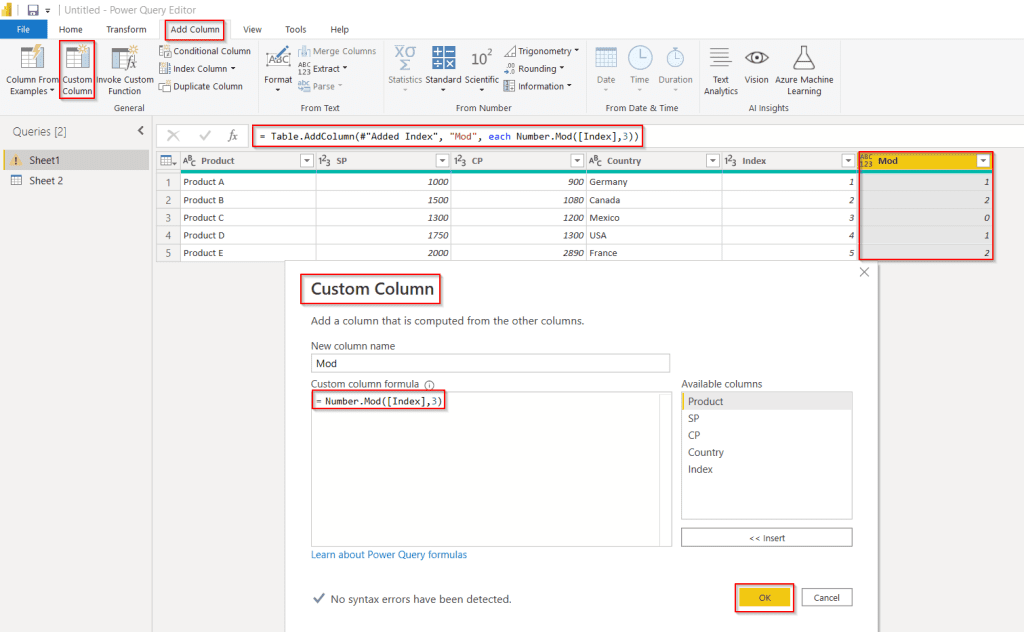
- Under the Add column option, select the custom column or conditional column. In the custom column formula box, enter the below-mentioned formula. Once the formula has been added to the formula box, click on the Ok button.
= Table.AddColumn(#"Added Custom", "Text", each if [Mod] = 1 then "Blue" else if [Mod] = 2 then "Yellow" else "White")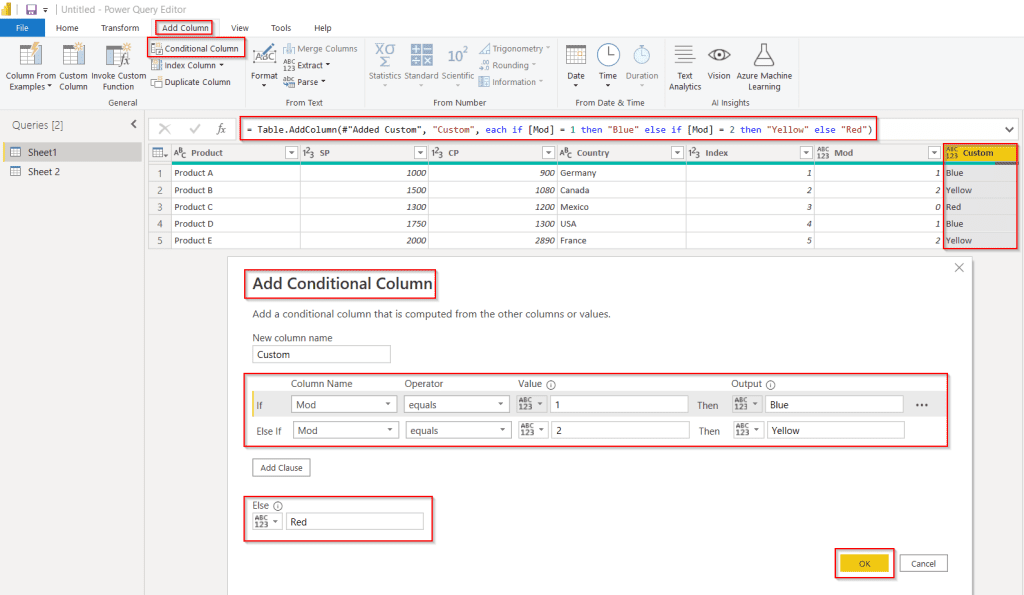
This is how to add the custom column with specific text in each row using the Power Query editor in Power Bi.
Power query add column ribbon
Let us see how we can add a custom column from the ribbon using the Power Query editor in Power BI.
To add a custom column from the ribbon follow the below-mentioned steps:
- Open the Power BI desktop, and load the table data into it, In the ribbon, under the Home option click on the Transform data option as shown below:
- So that it will redirect to the power query editor, where we can add custom columns to the table.

- Once it is redirected to the Power Query editor, under the Add column option, select the Custom column as highlighted below: The custom column window appears.

This is how to add a custom column from the ribbon using the Power Query editor in Power BI.
Power query add column count rows
Let us see how we can count rows and display them in the new column using the Power Query editor in Power BI.
- In this example, I have used the Product table data. Load the table data into the Power BI desktop, In the ribbon, under the Home option click on the Transform data option.
- Once it is redirected to the Power Query editor, Select any of the columns, right click and click on the group by option as shown below:
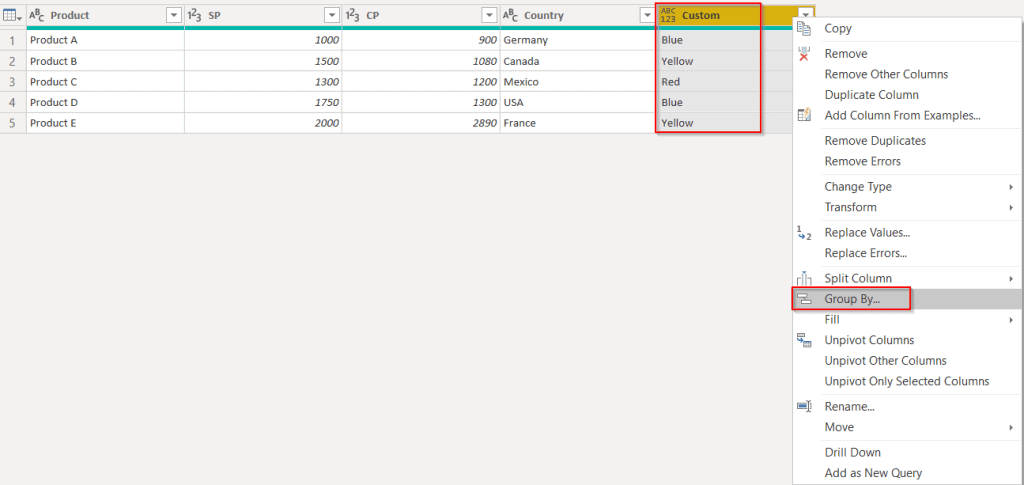
- In the group by Pop-up window select the Operation as Count Rows and click on the Ok button.
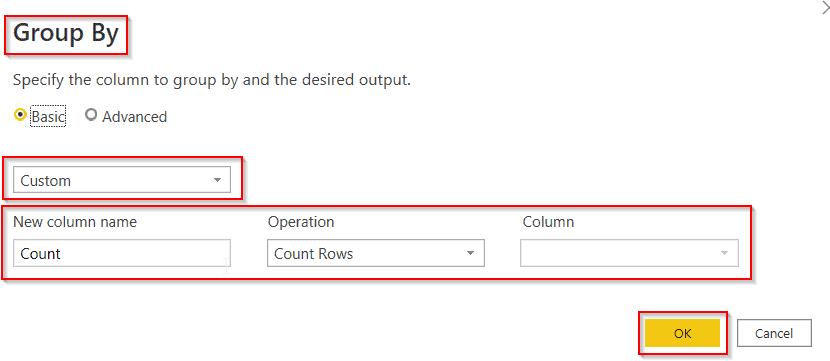
- In the below screenshot, you can see that it groups the values and displays the row count in the count column.
= Table.Group(#"Removed Columns", {"Custom"}, {{"Count", each Table.RowCount(_), Int64.Type}})
This is how to count rows and display them in the new column using the Power Query editor in Power BI.
Power query add column sum
Let us see how we can add a custom column sum and display the value using the Power Query editor in Power BI.
In this example, I am going to calculate the SP value using the Product table data in it, To calculate the SP value the formula is SP= Profit +CP
- Load the table data into the Power BI desktop, In the ribbon, under the Home option click on the Transform data option.
- Once it is redirected to the Power Query editor, under the add column option choose the custom column.
- Where Profit & CP are existing column names, SPis the new custom column. Once the formula has been added to the formula box, click on the Ok button.
= [Profit]+[CP]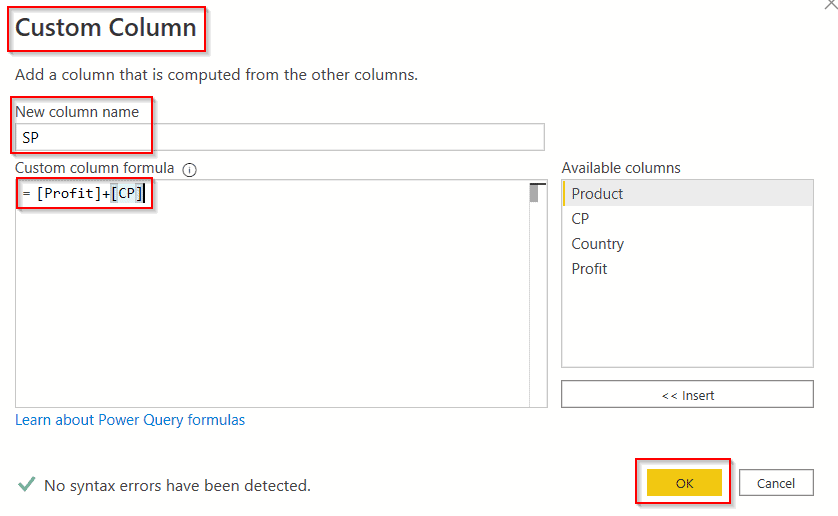
- In the below screenshot, you can see that the custom column has been added with the expected result value.
= Table.AddColumn(#"Removed Columns", "SP", each [Profit]+[CP])- Click on the Close and Apply option from the ribbon so that the changes will be reflected on the Power BI desktop.

This is how to add a custom column sum and display the value using the Power Query editor in Power BI.
Power query add column to group by
Let us see how we can add a custom column and display the group by values using the Power Query editor in Power BI.
In this example, I have used the financials sample data to group the values and display them in the custom column using the power query editor.
- Open the Power BI desktop, and load the table data into it, In the ribbon, under the Home option click on the Transform data option as shown below:
- Once it is redirected to the Power Query editor, Select any of the columns, right click and click on the group by option as shown below:
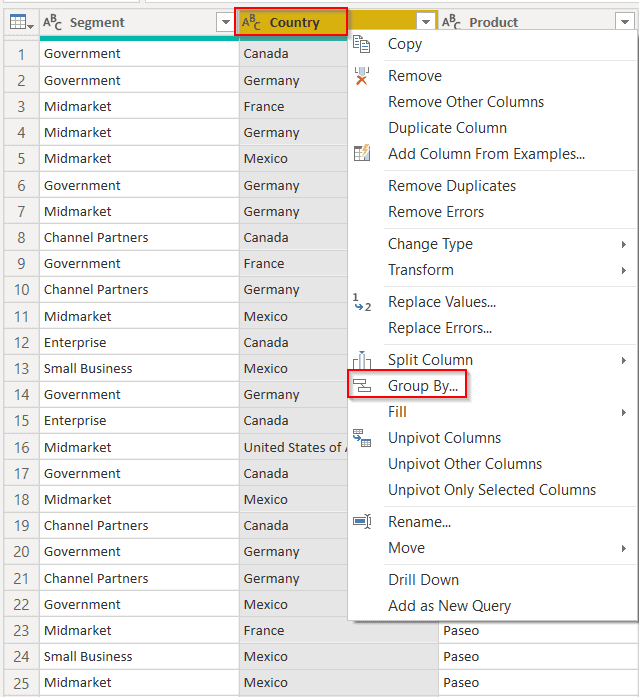
- In the group by Pop-up window select the Operation as Sum and click on the Ok button.
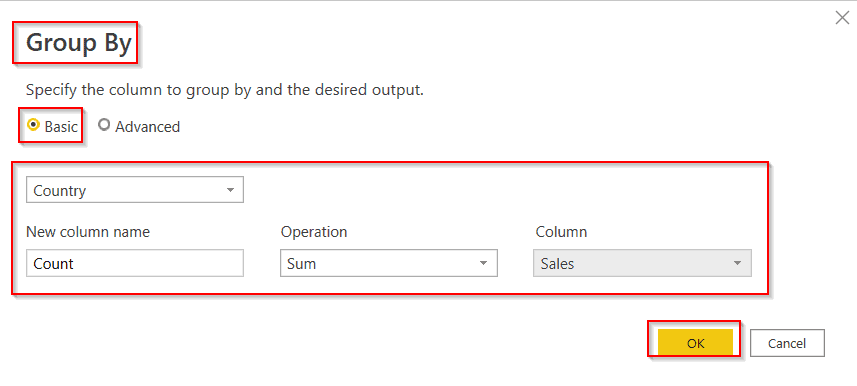
- In the below screenshot, you can see that it groups the values and displays the sales value total in the count custom column.
= Table.Group(#"Changed Type", {"Country"}, {{"Count", each List.Sum([#" Sales"]), type nullable number}})
This is how to add a custom column and display the group by values using the Power Query editor in Power BI.
Power query add column distinct count
Let us see how we can add a custom column to find the distinct or unique values count using the Power Query editor in Power BI.
In this example, I have used the employee’s table data, where the employee name called Haripriya is repeated twice.
- Load the table data into the Power BI desktop, In the ribbon, under the Home option click on the Transform data option.
- Once it is redirected to the Power Query editor, Select any of the columns, right click and click on the group by option as shown below:
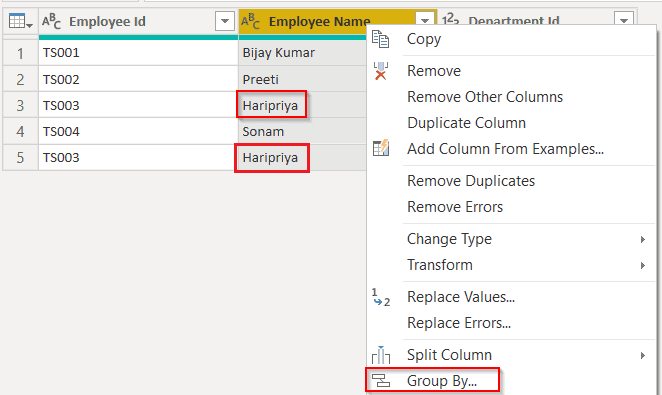
- In the group by Pop-up window select the Operation as Count Distinct rows and click on the Ok button.
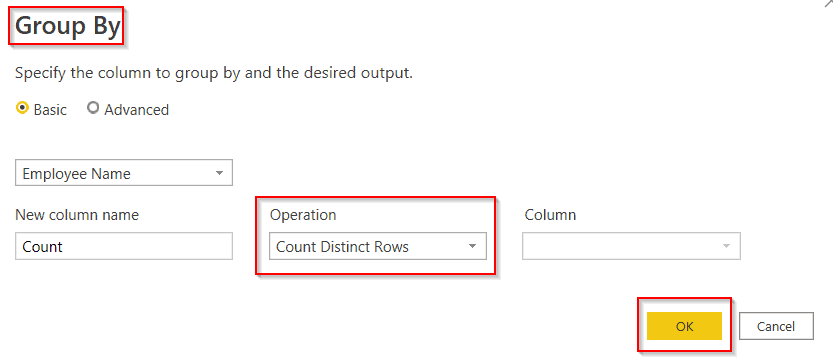
- In the below screenshot, you can see that it groups the values and displays the distinct count values in the count custom column.
= Table.Group(#"Changed Type", {"Employee Name"}, {{"Count", each Table.RowCount(Table.Distinct(_)), Int64.Type}})
This is how to add a custom column to find the distinct or unique values count using the Power Query editor in Power BI.
Power query add column at the beginning
Let us see how we can easily add custom column at the beginning using the power query editor in Power BI.
- When we add or create a new custom column function using the power query editor, by default it adds the new column at the very last.
- If we want to add a custom column at the beginning, we can easily drag and drop the particular column at the beginning, it will automatically reorder the columns accordingly.
To achieve this follow the below-mentioned steps:
- Load the data into the Power Bi desktop, In the ribbon, under the Home option click on the Transform data option.
- Once it is redirected to the Power Query editor, under the Add column option, select the Custom column.
- Apply the below-mentioned formula to the formula box, and click on the Ok button.
[Product] & "Test"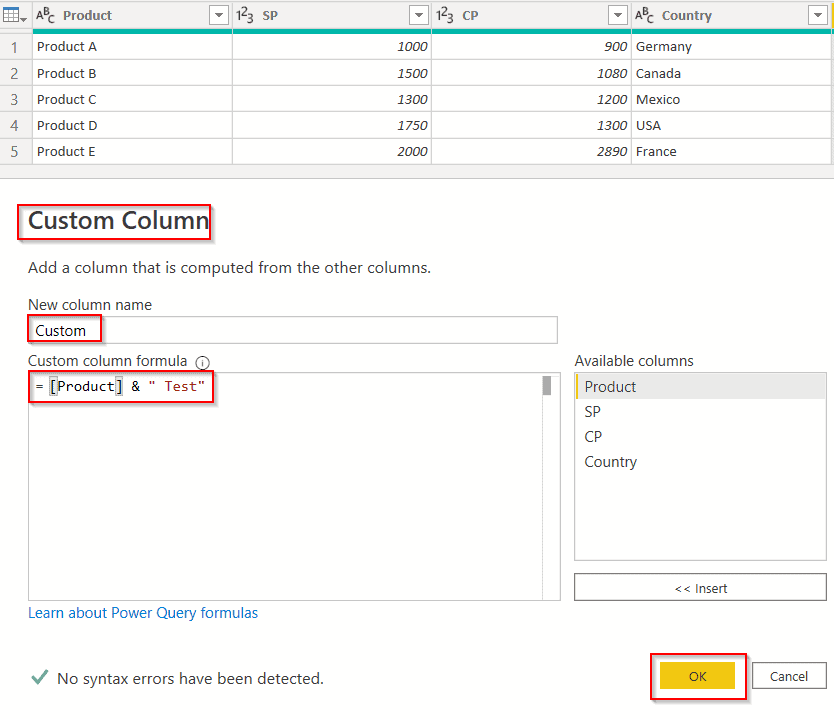
- In the below screenshot, you can see that the new custom column has been added at the last.

- Now simply drag and drop the newly created custom column at the beginning. The remaining column headings will be automatic will reordered.
= Table.ReorderColumns(#"Added Custom",{"Custom", "Product", "SP", "CP", "Country"})
This is how to easily add a custom column at the beginning using the power query editor in Power BI.
Power query add column null
Let us see how we can add the custom null column using the Power Query editor in Power BI.
- Open the Power BI desktop, and load the table data into it, In the ribbon, under the Home option click on the Transform data option as shown below:
- So that it will redirect to the power query editor, where we can add custom columns to the table.
- Once it is redirected to the Power Query editor, under the Add column option, select the Custom column, Enter the below-mentioned formula into the formula box, and click on the Ok button.
null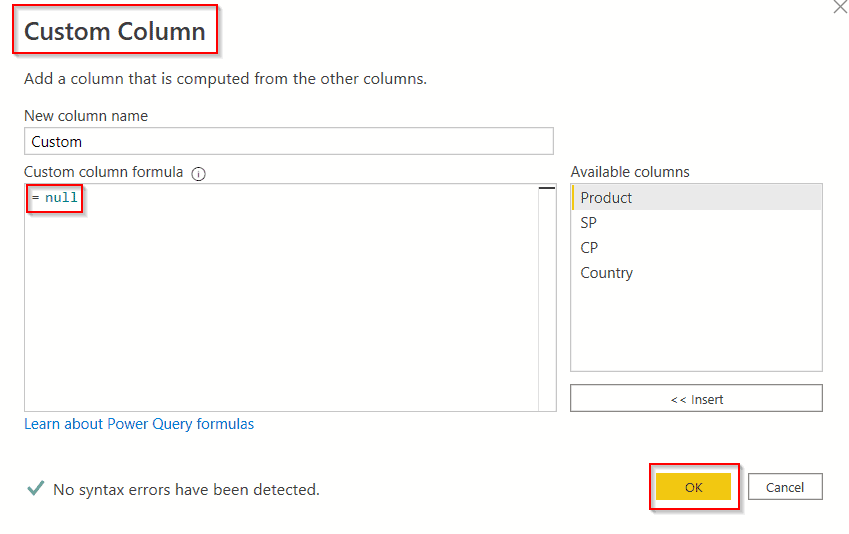
- Click on the Close and Apply option from the ribbon so that the changes will be reflected on the Power BI desktop.
= Table.AddColumn(#"Reordered Columns", "Custom.1", each null)
This is how to add the custom null column using the Power Query editor in Power BI.
Power query add column as number
Let us see how we can add the custom column as a number using the power query editor in Power BI.
In this example, I’ll add the index column from an index 0 in the Products table data.
- Open the Power BI desktop, and load the table data into it, In the ribbon, under the Home option click on the Transform data option.
- It will redirect to the power query editor, select the table for which you want to add an index column, and in the ribbon choose the Add column option.
- Expand the index column and choose the starting index, either we can select index 0, index 1, or custom index.

- Click on the close and Apply option, so that changes will appear on the Power BI desktop.
- In the below screenshot, you can see the newly created custom column in the Product’s table.
= Table.AddIndexColumn(#"Added Custom1", "Index", 1, 1, Int64.Type)
This is how to add the custom column as a number using the power query editor in Power BI.
Power query adds a new column to an existing table
Let us see how we can add a custom column to an existing table using the Power Query editor in Power BI.
- By default, when we add a custom column it will be added to a selected existing table.
- Open the Power BI desktop, and load the table data into it, In the ribbon, under the Home option -> Transform data option as shown below:
- So that it will redirect to the power query editor, where we can add custom columns to the table.
- Once it is redirected to the Power Query editor, under the Add column option, select the Custom column as highlighted below:

This is how to add a custom column to an existing table using the Power Query editor in Power BI.
Power query add column empty
Let us see how we can add a custom empty column to the table using the power query editor in Power bi.
- Open the Power BI desktop, and load the table data into it, In the ribbon, under the Home option click on the Transform data option
- So that it will redirect to the power query editor, where we can add custom columns to the table.
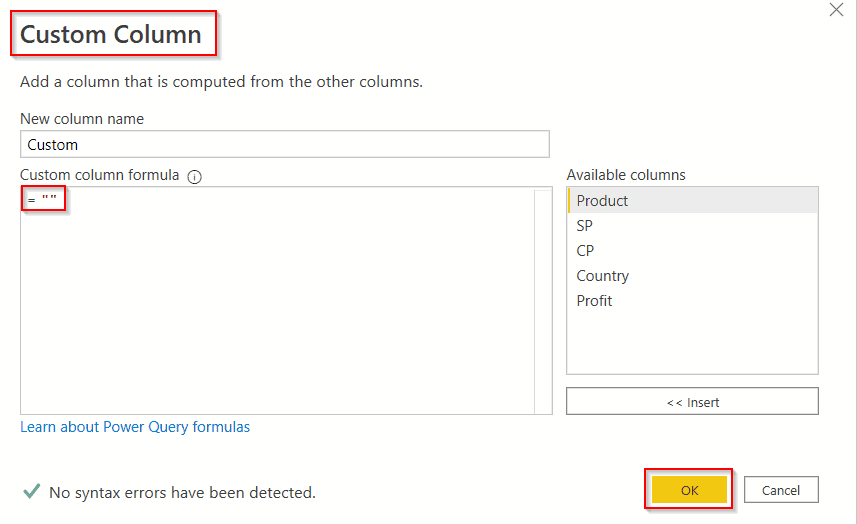
- Once it is redirected to the Power Query editor, under the Add column option, select the Custom column, Enter the below-mentioned formula into the formula box, and click on the Ok button.
" "
- Click on the Close and Apply option from the ribbon to reflect the changes on the Power BI desktop.
= Table.AddColumn(#"Added Custom", "Custom", each "")- In the below screenshot, the new empty column has been added to the table as below:

This is how to add custom empty column to the table with empty row data using the power query editor in Power bi.
Power query add column headers
Let us see how we can add a custom column headers using the Power Query editor in Power BI.
- To Open the Power Query Editor, load the table data into the Power BI desktop, under the Home option click on the Transform data option
- So that it will redirect to the power query editor, where we can add custom columns to the table.
- To enable the first row to column headers, select Transform -> Use First Row As Headers as shown below:
- To disable column headers to the first row, select Home, select the arrow next to Use First Row As Headers and then select Use Headers as First Row.

This is how to add a custom column headers using the Power Query editor in Power BI,
Power query add column range
Let us see how we can add a custom column with the range using the Power Query editor in Power BI.
In this example, initially, I’ll add the custom index column from 1 in the Products table data.
- Open the Power BI desktop, and load the table data into it, In the ribbon, under the Home option click on the Transform data option.
- It will redirect to the power query editor, select the table for which you want to add an index column, and in the ribbon choose the Add column option.
- Expand the index column and choose the starting index, either we can select index 0, index 1, or custom index.
= Table.AddIndexColumn(#"Changed Type", "Index", 1, 1, Int64.Type)- In the custom index pop-up window, choose the custom index number and the increment value as shown below and click on the Ok button.
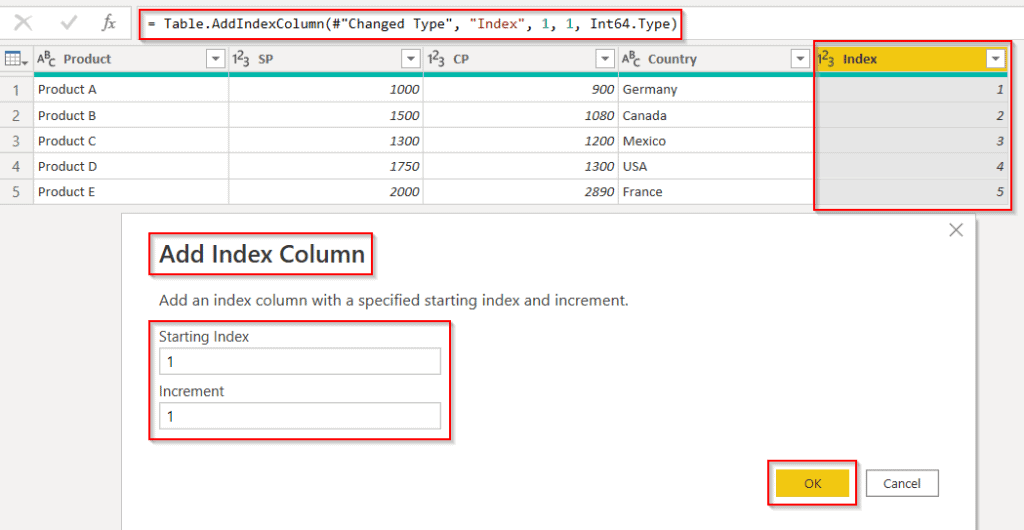
- Now add the condition column, and apply the below-mentioned formula so that it will display the value based on the range applied.
= Table.AddColumn(#"Added Index", "Custom", each if [Index] > 2 then "Null" else if [Index] < 2 then "Empty" else false)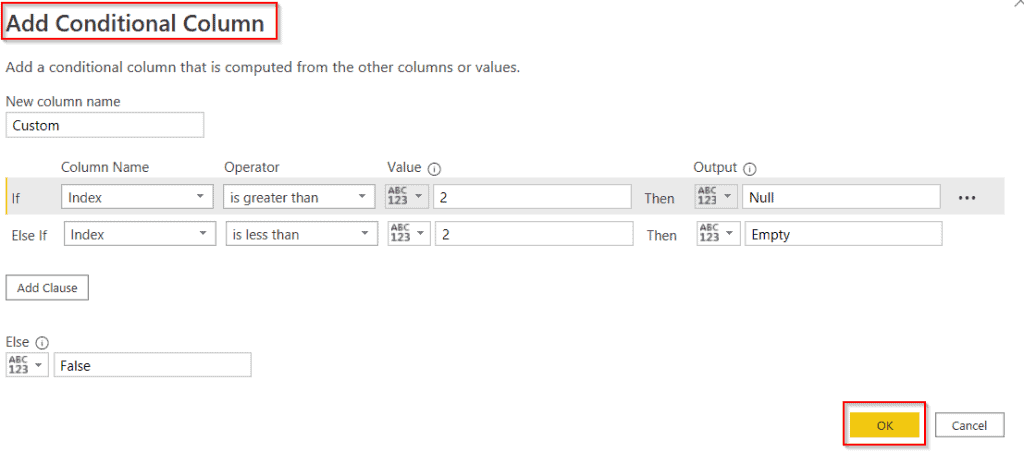
- In the below screenshot, you can see that the custom column has been added and display the value based on the range.

This is how to add custom column with the range using the Power Query editor in Power BI.
Power query add column hyperlink
- No, it is not possible to add custom column with hyperlinks using the Power Query editor in Power BI.
- Only we can add the hyperlink in the Power Bi desktop, On the Column tools tab, select Data category > Web URL.
- But in the Power Query editor, the data category option is not presented.
Power query add column max value
Let us see how we can add the column and display the maximum value using the Power Query editor in Power BI.
In this example, I have used the Employee data, to find the maximum value of the employee’s salary using the power query editor
- Open the Power BI desktop, and load the table data into it, In the ribbon, under the Home option click on the Transform data option
- So that it will redirect to the power query editor, where we can add custom columns to the table.
- Once it is redirected to the Power Query editor, under the Add column option, select the Custom column, Enter the below-mentioned formula into the formula box, and click on the Ok button.
List.Max(#"Changed Type"[Emp Salary])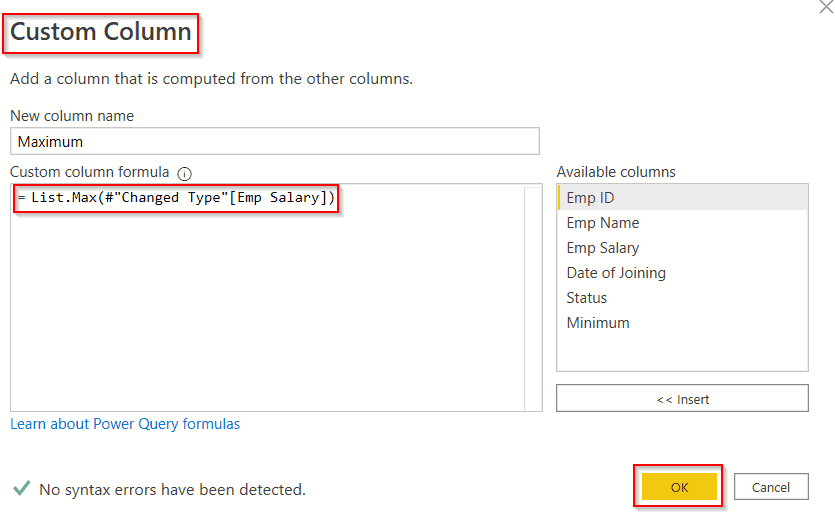
- The screenshot below shows that the custom column has been added and displays the maximum value of the Emp salary amount.
= Table.AddColumn(#"Added Custom", "Maximum", each List.Max(#"Changed Type"[Emp Salary]))- Click on the Close and Apply option from the ribbon so that the changes will be reflected on the Power BI desktop.

This is how to add the column and display the maximum value using the Power Query editor in Power BI.
Power query add column minimum value
Let us see how we can add column and display the minimum value using the Power Query editor in Power BI.
In this example, I have used the Employee data, to find the minimum value of the employee’s salary using the power query editor
- Open the Power BI desktop, and load the table data into it, In the ribbon, under the Home option click on the Transform data option
- So that it will redirect to the power query editor, where we can add custom columns to the table.
- Once it is redirected to the Power Query editor, under the Add column option, select the Custom column, Enter the below-mentioned formula into the formula box, and click on the Ok button.
List.Min(#"Changed Type"[Emp Salary])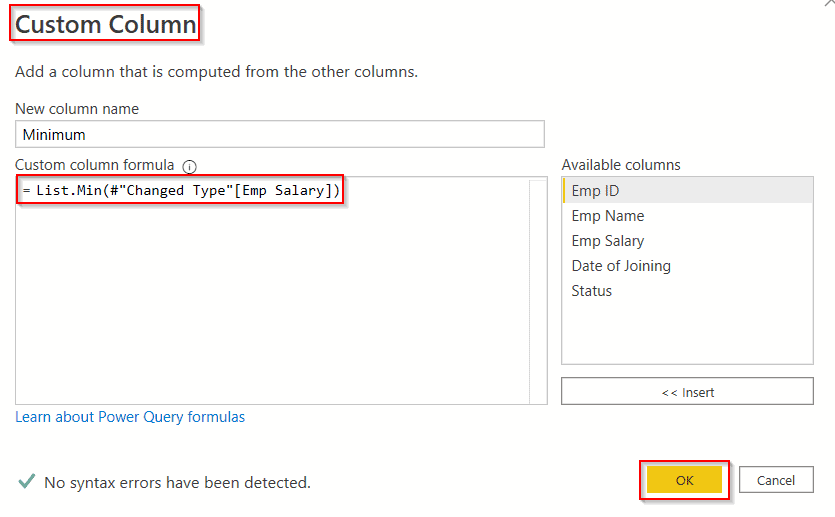
- The screenshot below shows that the custom column has been added and displays the minimum value of the Emp salary amount.
= Table.AddColumn(#"Changed Type", "Minimum", each List.Min(#"Changed Type"[Emp Salary]))- Click on the Close and Apply option from the ribbon so that the changes will be reflected on the Power BI desktop.

This is how to add the column and display the minimum value using the Power Query editor in Power BI.
Power query add column average
Let us see how we can add column and display the average value using the Power Query editor in Power BI.
In this example, I have used the Employee data, to find the average value of the employee’s salary using the power query editor
- Open the Power BI desktop, and load the table data into it, In the ribbon, under the Home option click on the Transform data option
- So that it will redirect to the power query editor, where we can add custom columns to the table.
- Once it is redirected to the Power Query editor, under the Add column option, select the Custom column, Enter the below-mentioned formula into the formula box, and click on the Ok button.
List.Average(#"Changed Type"[Emp Salary])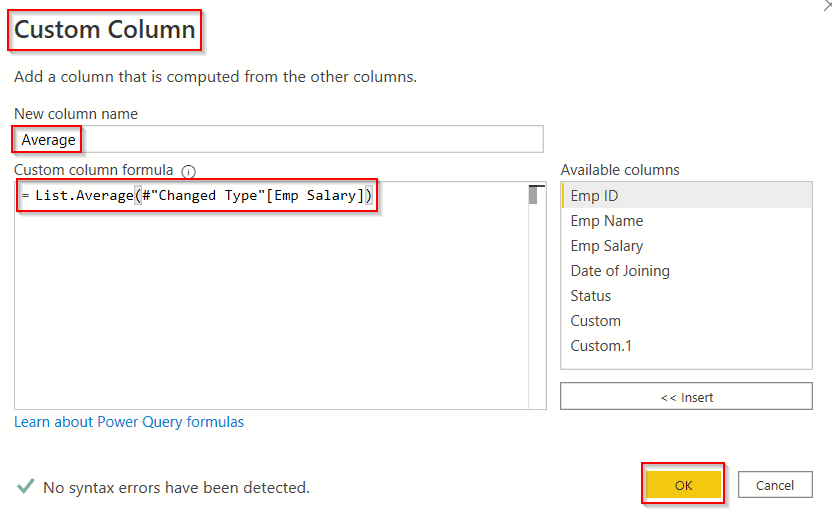
- The screenshot below shows that the custom column has been added and displays the average value of the Emp salary amount.
= Table.AddColumn(#"Added Custom1", "Average", each List.Average(#"Changed Type"[Emp Salary]))- Click on the Close and Apply option from the ribbon so that the changes will be reflected on the Power BI desktop.

This is how to add the column and display the average value using the Power Query editor in Power BI.
Power query add column advance editor
Let us see how we can add column using an advanced editor in Power Query editor Power BI.
In this example, I have used the Product data, to find the Profit value of all Products using the power query advanced editor.
- Open the Power BI desktop, and load the table data into it, In the ribbon, under the Home option click on the Transform data option. It will be redirected to the Power Query editor.
- Under the Home option, click on the Advanced editor option as shown below:

- In the Advanced editor window, apply the below-mentioned add column formula under the let and in sections.
let
    Source = Excel.Workbook(File.Contents("C:\Users\TSinfo\Desktop\Product.xlsx"), null, true),
    Table1_Table = Source{[Item="Table1",Kind="Table"]}[Data],
    #"Changed Type" = Table.TransformColumnTypes(Table1_Table,{{"Product", type text}, {"SP", Int64.Type}, {"CP", Int64.Type}, {"Country", type text}}),
    #"Profit" = Table.AddColumn(#"Changed Type", "Custom", each [SP]+[CP])
in
#"Profit"- Now click on the Done button, so that the custom column will be added to the table.
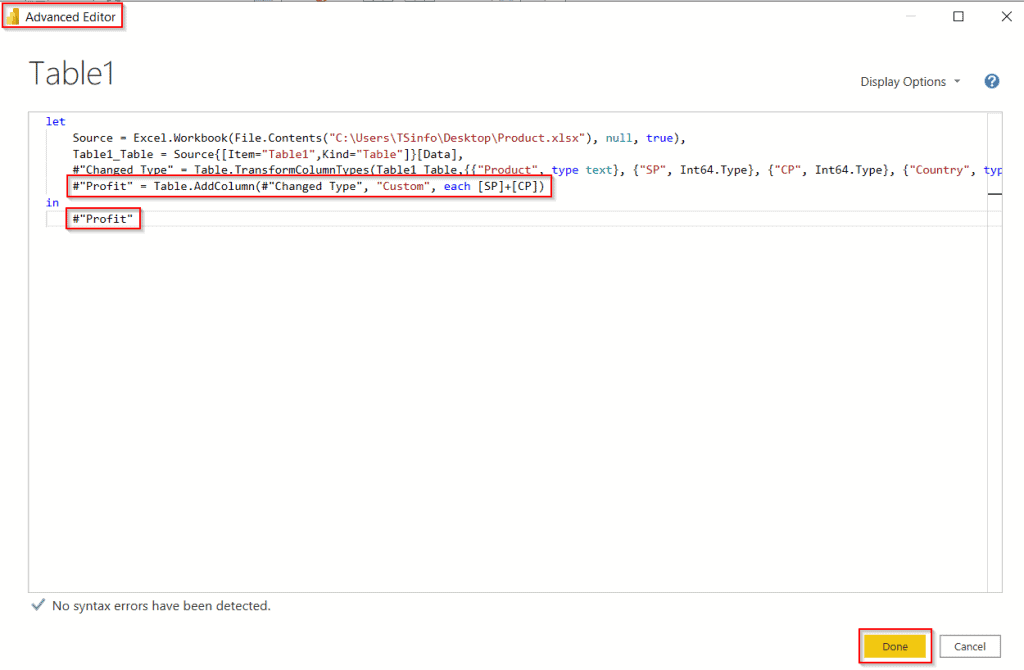
- In the below screenshot, you can see that the custom column has been added and displays the Profit value.
= Table.AddColumn(#"Changed Type", "Custom", each [SP]+[CP])- Click on the Close and Apply option from the ribbon so that the changes will be reflected on the Power BI desktop.

This is how to add column using an advanced editor in Power Query editor Power BI.
Power query add column DAX
- No, it is not possible to add a custom column using DAX the Power Query editor in Power BI.
- Only we can add a calculated column in the Power BI desktop, On the Table Tools tab, select New column.
- But using the Power Query editor, we cannot apply the DAX formula and add the custom column to the table.
Power query add column lookup value from another table
Let us see how we can add custom column using a lookup value from another table in the Power Query editor in Power BI.
In this example I have used two tables as mentioned below, a lookup function refers to a cell matching values in another row or column against the cell and thereby retrieving the corresponding results from the respective rows and columns.
Table 1:
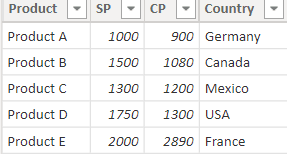
Table 2:
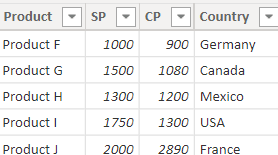
- Open the Power BI desktop, and load the table data into it, In the ribbon, under the Home option click on the Transform data option. It will be redirected to the Power Query editor.
- Make sure both the table has the same column so that it displays the matched column
- Once it is redirected to the Power Query editor, under the Add column option, select the Custom column, Enter the below-mentioned formula into the formula box, and click on the Ok button.
(let CurrentCountry = [[Country]] in Table.SelectRows(Table1, each [[Country]] = CurrentCountry)){0}[Product]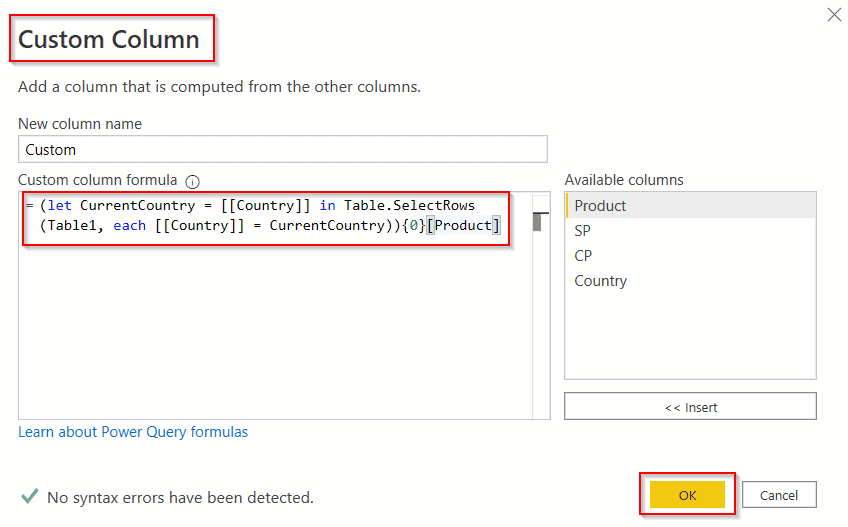
- Click on the Close and Apply option from the ribbon so that the changes will be reflected on the Power BI desktop.
= Table.AddColumn(#"Changed Type", "Custom", each (let CurrentCountry = [[Country]] in Table.SelectRows(Table1, each [[Country]] = CurrentCountry)){0}[Product])- In the below screenshot, the new empty column has been added from the table 1 product value to the table 2 Product data value as below:

This is how to add custom column using a lookup value from another table in the Power Query editor in Power BI.
Power query add column extract
Let us see how we can add custom column using the extract function in the power query editor Power BI.
- Open the Power BI desktop, and load the table data into it, In the ribbon, under the Home option click on the Transform data option. It will be redirected to the Power Query editor.
- From the ribbon, we can select under Add column – > Extract option as shown below:
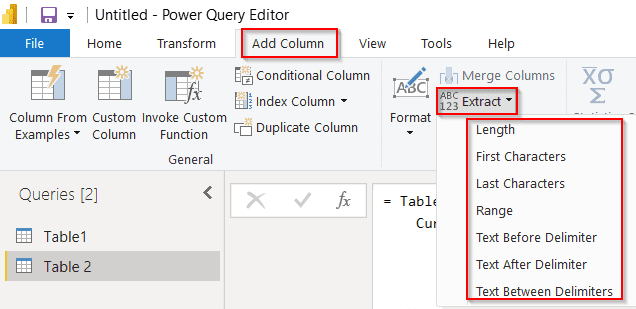
- Under the extract function, we can filter the column data based on the Length, Range, First and Last characters, etc.,
- Apply the below-mentioned formula, you can see that I have filtered the country column based on the length and displayed the extracted value in the custom column using the Power query editor.
= Table.AddColumn(#"Changed Type", "Length", each Text.Length([Country]), Int64.Type)- Click on the Close and Apply option from the ribbon so that the changes will be reflected on the Power BI desktop.

This is how to add custom column using the extract function in the power query editor Power BI.
Power query add column left function
Let us see how we can add a column instead of the Left function using the Power Query editor in Power BI.
In this example, we will get the first 3 characters of the Country column,
- Open the Power BI desktop, and load the table data into it, In the ribbon, under the Home option click on the Transform data option. It will be redirected to the Power Query editor.
- From the ribbon, we can select Add column-> Custom column.
- We can simply apply the M expression in the custom column to replicate the Left function in Excel.
Text.Start([Country], 3)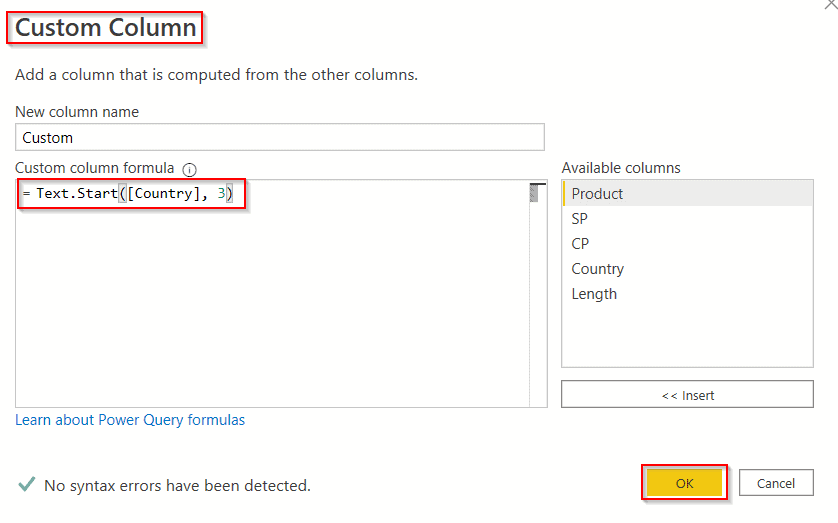
- Click on the Close and Apply option from the ribbon so that the changes will be reflected on the Power BI desktop.
= Table.AddColumn(#"Inserted Text Length", "Custom", each Text.Start([Country], 3))- In the below screenshot, the new custom column has been added to the table as below:

This is how to add column instead of the Left function using the Power Query editor in Power BI.
Power query add column right function
Let us see how we can add column instead of the Right function using the Power Query editor in Power BI.
In this example, we will get the last3 characters of the Country column,
- Open the Power BI desktop, and load the table data into it, In the ribbon, under the Home option click on the Transform data option. It will be redirected to the Power Query editor.
- From the ribbon, we can select Add column-> Custom column.
- We can simply apply the M expression in the custom column to replicate the Right function in Excel.
Text.End([Country],3)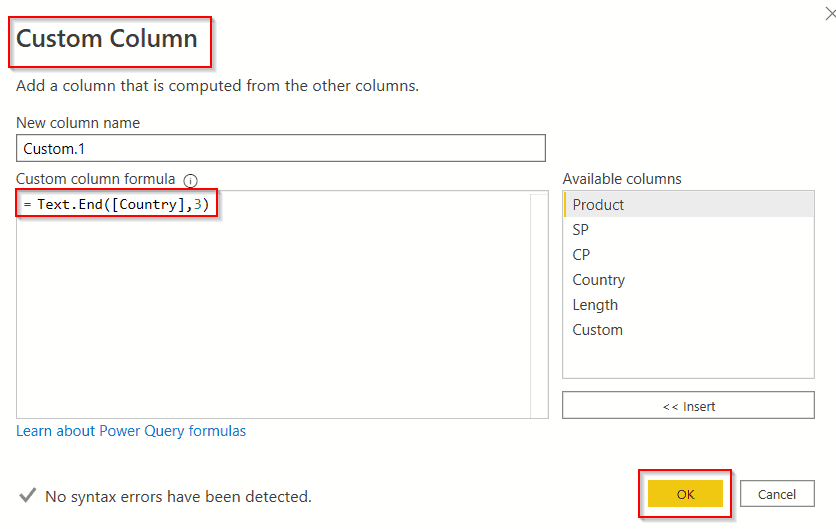
- Click on the Close and Apply option from the ribbon so that the changes will be reflected on the Power BI desktop.
= Table.AddColumn(#"Added Custom", "Custom.1", each Text.End([Country],3))- In the below screenshot, the new custom column has been added to the table as below:

This is how to add a column instead of the Right function using the Power Query editor in Power BI.
Power query add column based on parameter
Let us see how we can add a custom column based on a parameter by using the Power Query editor in Power BI.
In this example, I have used the Products table data, first, we will see how to set the parameter value.
- Load the data to the Power BI desktop, In the ribbon, under the Home option click on the Transform data option.
- It will redirect to the power query editor, select the table for which you want to add a custom column based on the parameter.
- To set the parameter, in the power query editor under the Home option in the ribbon choose the Manage Parameters option as shown below:

- In the Manage Parameters window, enter the Parameter name, choose the type as any, and the suggested values as List of Values.
- Enter the current value as the Parameter value and click on the Ok button as highlighted below:
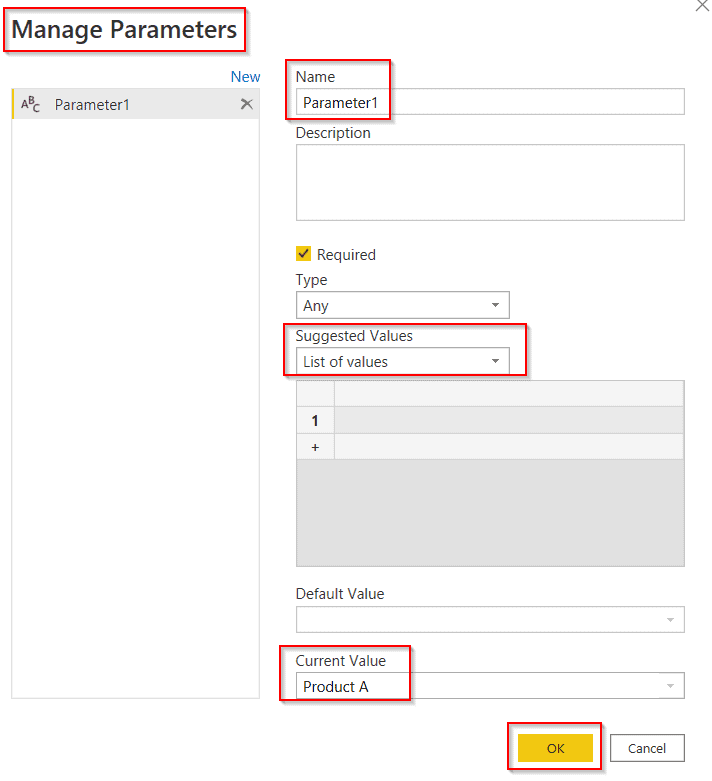
- Now the created Parameter value will be added to the Queries, now select the table to add a custom column based on the parameter value.
- Under the Add column option, choose the custom column, now apply the below-mentioned formula in the custom column window and click on the ok button.
if List.Contains({"Product A"},[Product]) and [Product]=Parameter1 then "yes" else "no"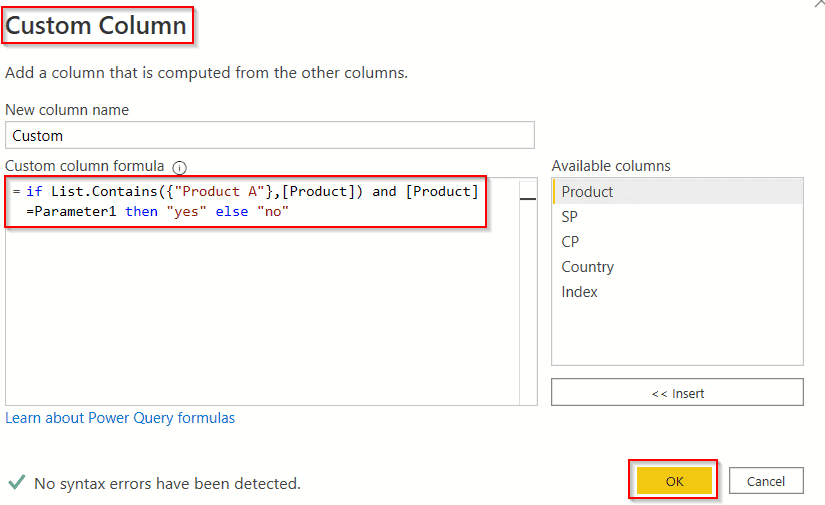
- Click on the close and Apply option, so that changes will be reflected on the Power BI desktop.
= Table.AddColumn(#"Changed Type", "Custom", each if List.Contains({900,1080,1200},[CP]) and [Product]=Parameter1 then "yes" else "no")- In the below screenshot, you can see that based on the parameter value condition it displays the value.

- This is how to add a custom column based on a parameter by using the Power Query editor in Power BI.
Power query add an editable column
Let us see how we can add an editable column using the Power Query editor in Power BI.
In this example, you can see below the new custom column has been added and displayed the value as yes/no, now we will edit the custom column and display the value as True/False.

- Open the Power BI desktop, and load the table data into it, In the ribbon, under the Home option click on the Transform data option.
- It will redirect to the power query editor, select the custom column that you want to edit, in the formula section, edit the data value that you want to change or update and click on the check icon as below:
= Table.AddColumn(#"Added Index", "Custom", each if List.Contains({"Product A"},[Product]) and [Product]=Parameter1 then "True" else "False")
- Click on the close and Apply option, so that changes will appear on the Power BI desktop.
- In the below screenshot, you can see that the selected custom has been updated.

This is how to add an editable column using the Power Query editor in Power BI.
Power query add join column
Let us see how we can add and use the join column function using the Power Query editor in Power BI.
- Load the table data into the Power Bi desktop, In the ribbon, under the Home option click on the Transform data option.
- It will redirect to the power query editor, select the table for which you want to add an index column, and in the ribbon choose the Add column-> Custom column option.
- In the custom column window, apply the below-mentioned formula and click on the ok button.
Table.AddJoinColumn(
    Table.FromRecords({
        [Product = "A",Country = "Germany"],
        [Product = "B",Country = "Canada"]
    }),
    "Product",
    () => Table.FromRecords({
        [Product = "A", SP = 1000],
        [Product = "B", SP = 1500]
    }),
    "Product",
    "SP"
)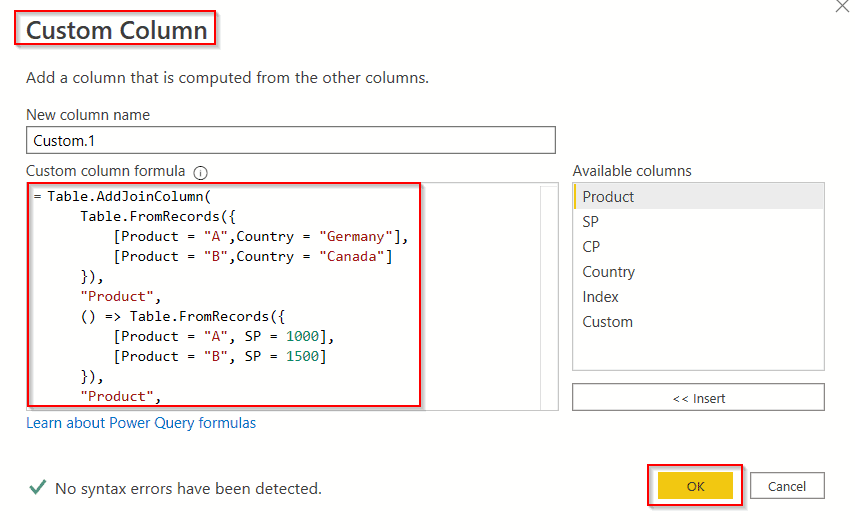
- The screenshot below shows that the custom column has been added with the expected result value.
- Click on the Close and Apply option from the ribbon to reflect the changes on the Power BI desktop.
= Table.ExpandTableColumn(#"Custom 1", "SP", {"SP"}, {"SP.SP"})
This is how to add and use the join column function using the Power Query editor in Power BI.
Power query add column key
Let us see how we can add the column key using the Power Query editor in Power BI.
- Load the table data into the Power Bi desktop, In the ribbon, under the Home option click on the Transform data option.
- It will redirect to the power query editor, select the table for which you want to add an index column, and in the ribbon choose the Add column-> Custom column option.
- In the custom column window, apply the below-mentioned formula and click on the ok button.
let
    table = Table.FromRecords({
        [Product = "F", Country = "Germany"],
        [Product = "G", Country = "Canada"]
    }),
    resultTable = Table.AddKey(table, {"Product"}, true)
in
resultTable- The screenshot below shows that the custom column has been added with the expected result value.
- Click on the Close and Apply option from the ribbon to reflect the changes on the Power BI desktop.

This is how to add the column key using the Power Query editor in Power BI.
Power query add column based on the list
Let us see how we can add custom column based on the list function using the Power Query editor in Power BI.
- Load the table data into the Power Bi desktop, In the ribbon, under the Home option click on the Transform data option.
- It will redirect to the power query editor, select the table for which you want to add an index column, and in the ribbon choose the Add column-> Custom column option.
- In the custom column window, apply the below-mentioned formula and click on the ok button.
= Table.AddColumn(#"Added Index", "Custom", each Table.AddColumn(#"Sheet 2", "B", each (let Product=#"Sheet 2"[Product] in
List.Generate( () =>
[CurrentItem = Product{0}, Index =1 , Counter = 1],
each [Counter] <= List.Count(Product),
each [
CurrentItem = Product{[Counter]},
DifferenceToPrevious = CurrentItem - [CurrentItem],
Index = if DifferenceToPrevious >= 1 then [Index] + 1 else [Index],
Counter = [Counter] + 1
],
each [Index]
))))- Now in the custom column, expand the table and choose the data that you want to display it. Here, in this example, I have selected the Aggerated function to choose the count of the countries.
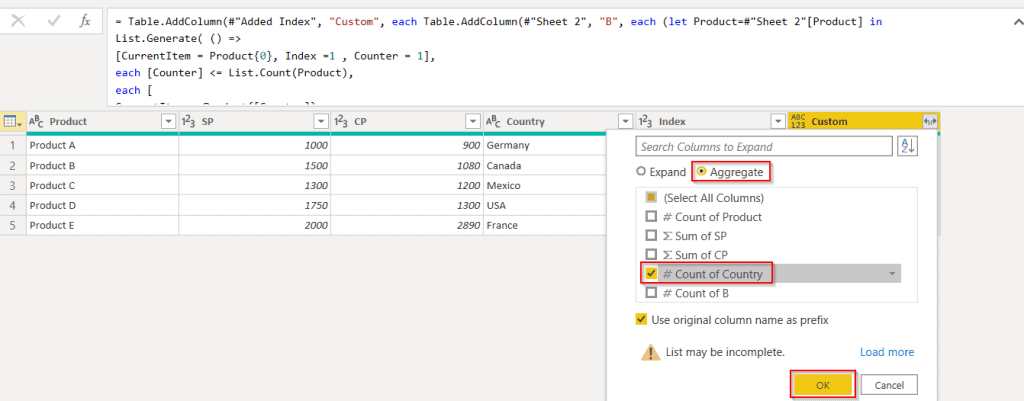
- The screenshot below shows that the custom column has been added with the expected result value.
- Click on the Close and Apply option from the ribbon to reflect the changes on the Power BI desktop.

This is how to add custom column based on the list function using the Power Query editor in Power BI.
Power query add column divider
Let us how we can add a column divider to separate the columns or to add the borders in the Power Bi table or matrix visual.
In this example, we will see how we can add borders/gridlines to separate the columns as below:
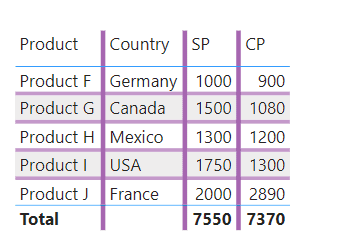
Follow the below-mentioned steps to achieve this:
- Open the Power Bi desktop, and load the data into it. Once the data has been loaded, in the report select the Table or Matrix visual.
- Under the visualizations, Expand the grid option, enable the vertical gridlines, and increase the width as per requirement. By default, the width size will be 1.
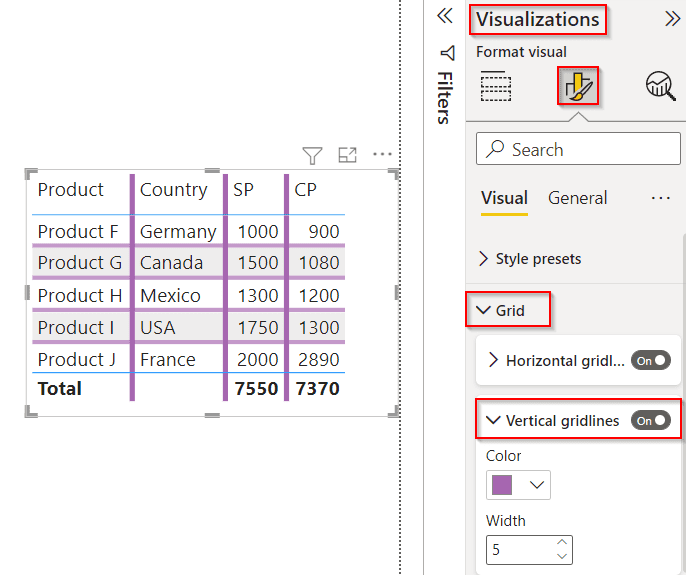
This is how to add a column divider to separate the columns or to add the borders in the Power Bi table or matrix visual.
This Power BI tutorial explains the syntax to add custom columns using the Power Query in Power BI, and how to create a custom column in the table using the Power Query editor in Power BI. Also, we covered the topics below:
- Power query add column and change type
- Power query add column index
- Power query add column from another table
- Power query add column with source name
- Power query add column concatenate two columns
- power query add column from another query
- Power query add column with text
- Power query add column ribbon
- Power query add column count rows
- Power query add column sum
- Power query add column to group by
- Power query add column distinct count
- Power query add column at the beginning
- Power query add column null
- Power query add column as number
- Power query adds a new column to an existing table
- Power query add column empty
- Power query add column headers
- Power query add column range
- Power query add column hyperlink
- Power query add column max value
- Power query add column minimum
- Power query add column average
- Power query add column advance editor
- Power query add column DAX
- Power query add column lookup value from another table
- Power query add column extract
- Power query add column left function
- Power query add column right function
- Power query add column based on parameter
- Power query add an editable column
- Power query add join column
- Power query add column key
- Power query add column based on the list
- Power query add column divider
You may like the following Power Bi tutorials:
- Power BI Create Table From Another Table
- Power BI Compares Two Columns in Different Tables
- Power BI Sum Group by
- Power BI Report Export to PDF
- Power BI Add Calculated Column
I am Bijay a Microsoft MVP (10 times – My MVP Profile) in SharePoint and have more than 17 years of expertise in SharePoint Online Office 365, SharePoint subscription edition, and SharePoint 2019/2016/2013. Currently working in my own venture TSInfo Technologies a SharePoint development, consulting, and training company. I also run the popular SharePoint website EnjoySharePoint.com