Calculated columns are a powerful feature in Power BI that allows you to extend your data model by creating new columns based on existing data using DAX formulas.
In this tutorial, we will learn what a calculated column is in Power BI and how to create a calculated column in Power BI.
Additionally, we will discuss the topics below:
- Power BI calculated column based on another column
- Power BI: calculate average by category
- Calculated column in Power BI using if statement
- Calculate column in Power BI with multiple filters
- Power BI calculated column from another table
- Power BI: add calculated column to table visual
What is a calculated column in Power BI?
A calculated column in Power BI is a column you create by applying a formula to existing data within your data model.
Unlike regular columns that come directly from your data source, calculated columns use DAX (Data Analysis Expressions) to compute values based on other columns.
This allows you to add new data to your tables without altering the original data source, enabling you to create custom calculations and enrich your data model.
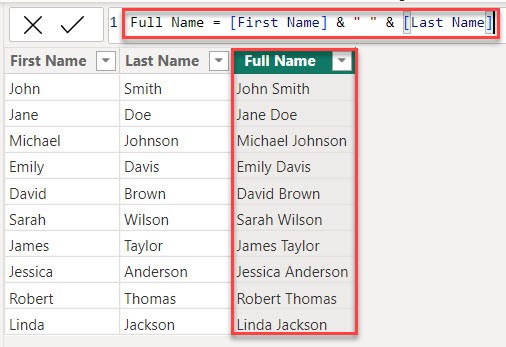
For example, you could create a calculated column that combines first and last names using the below DAX expression:
Full Name = [First Name] & " " & [Last Name]Where:
- Full Name = This is the new value we are creating, which represents a complete name.
- [First Name] = This refers to the value in the “First Name” field.
- & ” ” & = This concatenates (joins) the first name and the last name with a space in between.
- [Last Name] = This refers to the value in the “Last Name” field.
Create Calculated Columns in Power BI
Now, we see how to create a calculated column in Power BI.
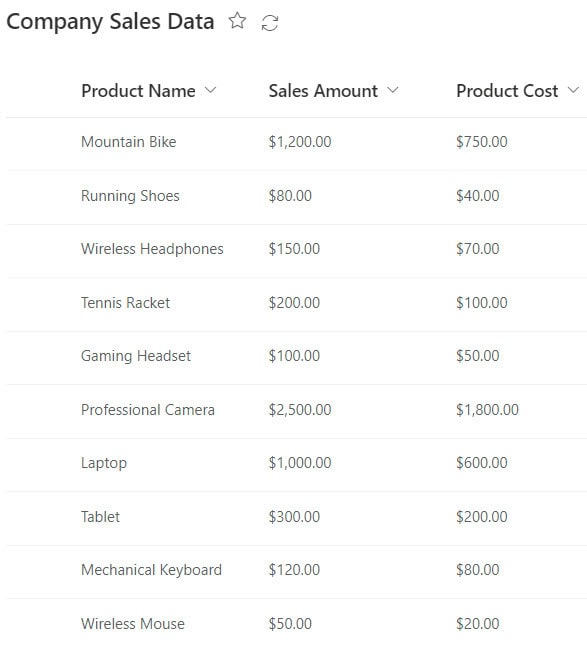
Imagine you are analyzing sales data for a company and want to understand profitability across different product categories. You have a SharePoint list of sales amount and product cost but not profit margin. A calculated column can solve this problem.
Here is the SharePoint list:
Follow the below to Create a Calculated Column in Power BI:
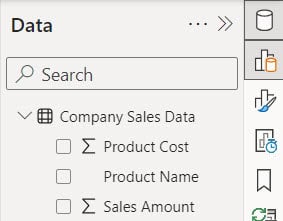
1. Open Power BI Desktop and load the above SharePoint List in Power BI Desktop. Then, you can see the data presented in the Data pane.
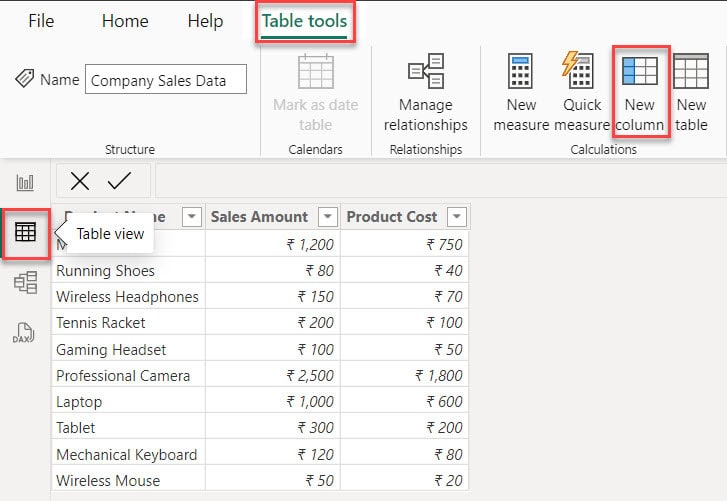
2. Go to the Table view under the Table tools and click the New column.
3. Then, in the formula bar, put below the DAX expression for creating a Profit margin:
Profit Margin = ([Sales Amount] - [Product Cost]) / [Sales Amount]Where:
- Profit Margin = This is what we’re calculating, representing profit proportion to sales revenue.
- ([Sales Amount] – [Product Cost]) = This calculates the difference between the sales amount and the product cost, which gives us the profit.
- / [Sales Amount] = This divides the profit by the sales amount to find the proportion or percentage of profit relative to sales.

4. Afterward, you’ll notice a new column added to the dataset. In the data pane, you’ll see a symbol next to Profit Margin, indicating a calculated column.

5. If you notice that the Profit Margin is in decimal format, but we need it in percentage format, select the Profit Margin column. Then, in the Formatting section, click the Percentage symbol.
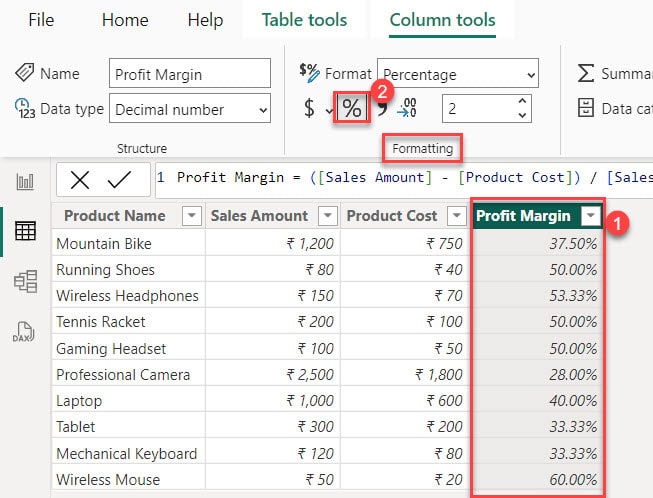
This way, you can create Calculate Columns in Power BI.
Power BI Calculated Column Based on Another Column
Imagine you are working as a data analyst for a company. Your company tracks sales data, and you want to create a new column that categorizes each sale as “High Value” or “Low Value” based on the amount spent in each transaction.
Any sale above $500 is considered “High Value,” and any sale $500 or below is “Low Value.”
Here, we have a SharePoint list (Online Retail Sales) that contains below columns with various data types:
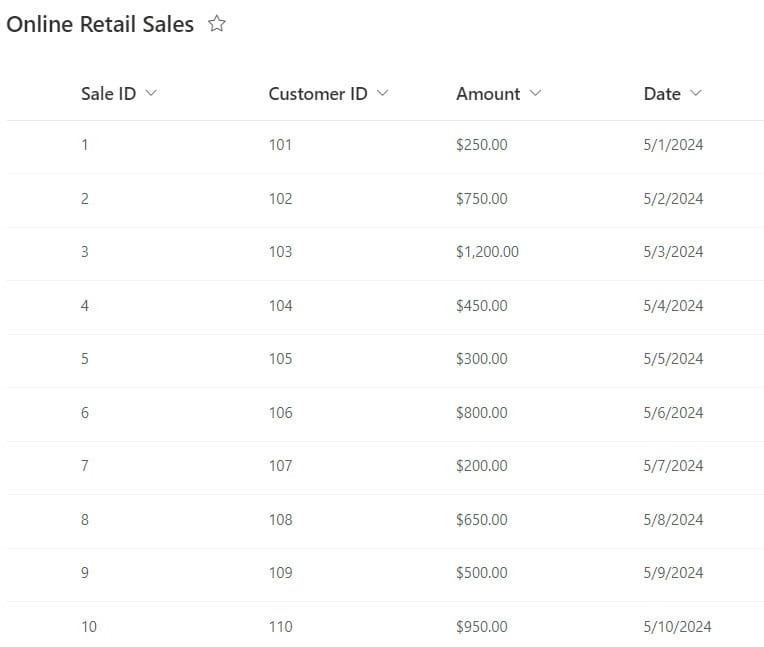
Now follow the below steps:
After loading the SharePoint list into Power BI, go to the table view and click ‘New column‘. In the formula bar, enter the following DAX expression:
ValueCategory = IF('Online Retail Sales'[Amount] > 500, "High Value", "Low Value")Where:
- ValueCategory = We’re defining a term that categorizes the sales amount as either high or low value.
- IF(…) = This function checks a condition and returns one value if the condition is true and another if it is false.
- ‘Online Retail Sales'[Amount] > 500 = This is the condition being checked, which tests if the sales amount is greater than 500.
- High Value = This is the value returned if the condition is true (sales amount is greater than 500).
- Low Value = This is the value returned if the condition is false (sales amount is 500 or less).

Your table will now have the new calculated column “ValueCategory,” which you can see in the Table View.
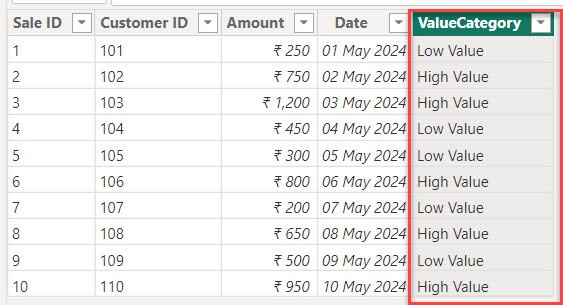
Now, you can use the “ValueCategory” column in your reports and visualizations.
Power BI Calculate Average by Category
Let’s say you want to analyze the average sales for each product category to identify which categories perform the best and which might need attention.
According to this scenario, we have a dataset in Power BI. Please check the screenshot below.
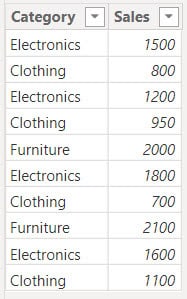
Then go to the table view and click ‘New column‘. In the formula bar, enter the following DAX expression:
Average Sales = AVERAGE('Sales Data'[Sales])Where:
- Average Sales = This is the name of the calculated column.
- AVERAGE() = This is the function we use to calculate the average. It takes a set of values and returns their average.
- (‘Sales Data'[Sales]) = This tells the AVERAGE function where to find the values it should average. ‘Sales Data’ is the table name, and [Sales] is the column name within that table.

After that, go to the Report view. Under the Home tab, open the Visual gallery and select Table Visual.
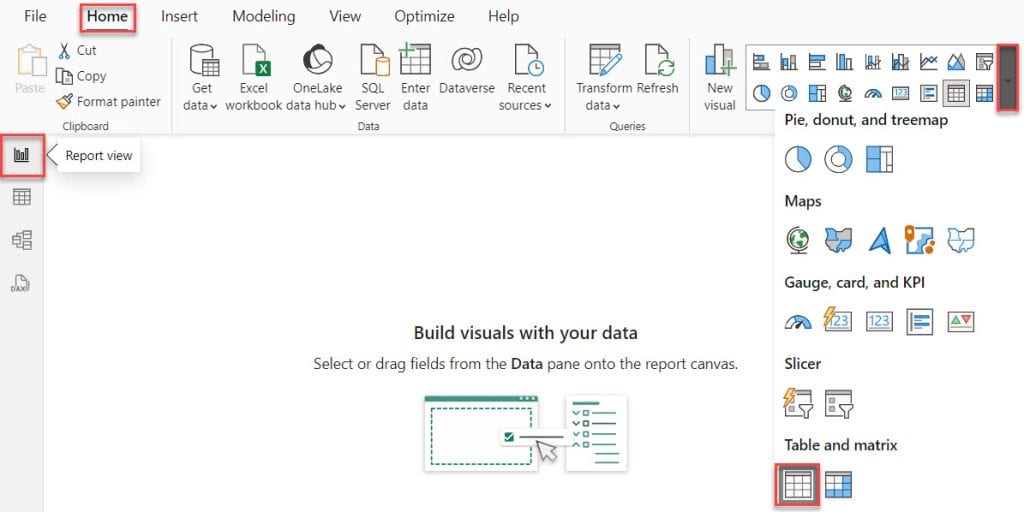
Then, using +Add data, add Category and Average Sales columns in the table visual.
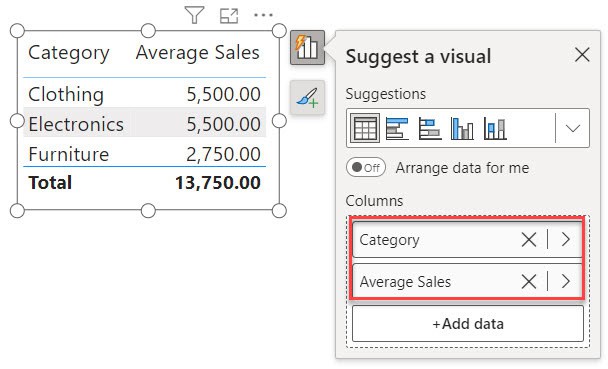
This visual helps you see the average sales, giving you insights into which categories are performing better.
Following these steps, you can effectively use Power BI to calculate and visualize average sales by category.
Calculated Column in Power BI using IF Statement
Suppose you work for an IT company that provides software solutions to various clients. Your company wants to categorize its clients into “Enterprise” and “Small Business” based on the number of employees in each client organization.
Here, we have a dataset in Power BI that includes the Client Name and the Employee Count column.
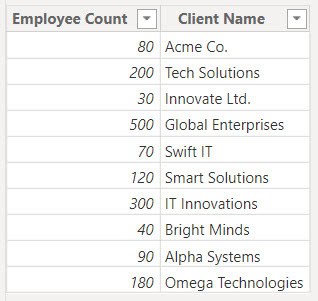
Go to the table view and click ‘New column‘. In the formula bar, enter the following DAX expression:
Client Category = IF('Client Data'[Employee Count] > 100, "Enterprise", "Small Business")Where:
- Client Category = This part tells the DAX formula what we’re calculating, which is the category of clients.
- IF() = This is the function we use to create a conditional statement. It checks a condition and returns one value if it’s true and another if it’s false.
- (‘Client Data'[Employee Count] > 100) = This is the condition we’re checking. It compares the ‘Employee Count’ column in the ‘Client Data’ table to 100, checking if it’s greater than 100.
- Enterprise = This is the value returned if the condition is true. In this case, if the ‘Employee Count’ is greater than 100, the client category will be “Enterprise”.
- Small Business = This is the value returned if the condition is false. If the ‘Employee Count’ is not greater than 100, the client category will be “Small Business”.

Now you can see Power BI will calculate the values for the new column based on the IF statement.
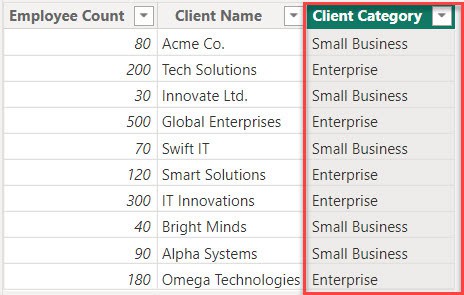
This way, you can create a calculated column in Power BI using the if statement.
Calculate Column in Power BI with Multiple Filters
Scenario:
You are a sales manager at a retail company. You want to calculate the total sales for the current year for a specific product category (“Electronics”) in a specific region (“North America”).
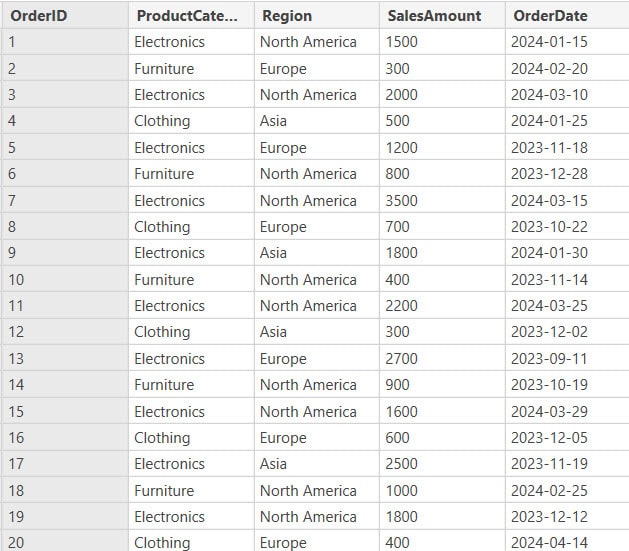
We have a Power BI dataset that includes the OrderID, ProductCategory, Region, SalesAmount, and OrderDate columns.
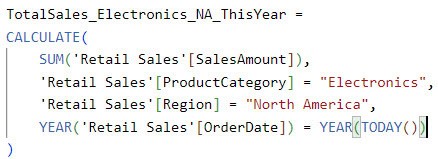
Go to the Table view and use the DAX expression below to create a new column.
TotalSales_Electronics_NA_ThisYear =
CALCULATE(
    SUM('Retail Sales'[SalesAmount]),
    'Retail Sales'[ProductCategory] = "Electronics",
    'Retail Sales'[Region] = "North America",
    YEAR('Retail Sales'[OrderDate]) = YEAR(TODAY())
)
Where:
- TotalSales_Electronics_NA_ThisYear = This part names the measure we’re creating, representing the total sales of electronics in North America for the current year.
- CALCULATE() = This function modifies or filters a calculation. It allows us to apply filters or conditions to the calculation.
- SUM(‘Retail Sales'[SalesAmount])= It sums up the ‘SalesAmount’ column in the ‘Retail Sales’ table, giving us the total sales amount.
- ‘Retail Sales'[ProductCategory] = “Electronics” = This is the filter condition applied to the calculation. It restricts the calculation only to consider rows where the ‘ProductCategory’ column equals “Electronics”.
- ‘Retail Sales'[Region] = “North America” = This is another filter condition applied to the calculation. It restricts the calculation only to consider rows where the ‘Region’ column equals “North America”.
- YEAR(‘Retail Sales'[OrderDate]) = YEAR(TODAY()) = This is the third filter condition applied to the calculation. It restricts the calculation only to consider rows where the year of the ‘OrderDate’ column equals the current year.
After that, go to the Report view. Under the Home tab, open the Visual gallery and select Table Visual.

Then, using +Add data, add OrderDate, ProductCategory, Region, SalesAmount, and TotalSales_Electronics_NA_ThisYear columns in the table visual.
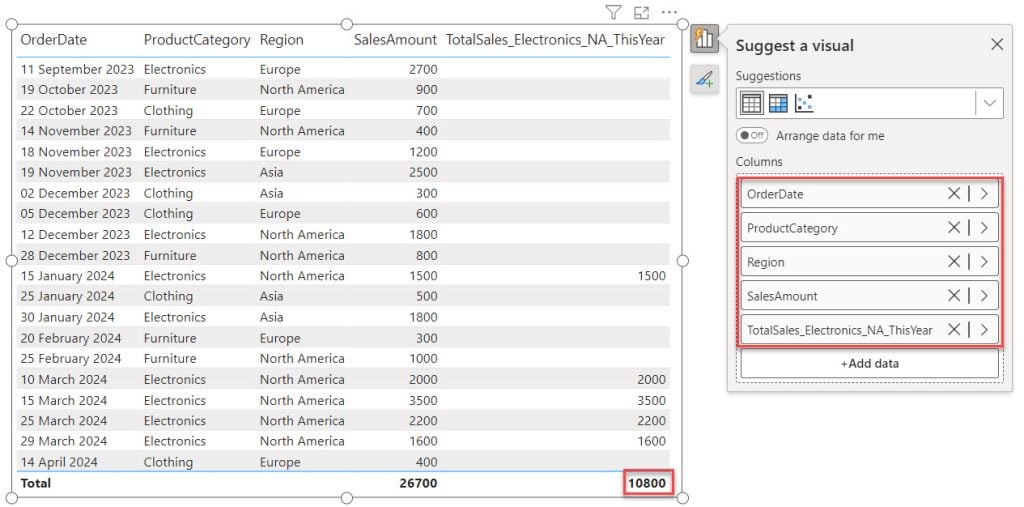
Here, you only see the sales amount for the year 2024, the electronics product category, and the North America region. If these three things are the same, then the sales amounts are added together.
Following these steps, you can create a calculated column in Power BI with multiple filters.
Power BI Calculated Column From Another Table
Scenario:
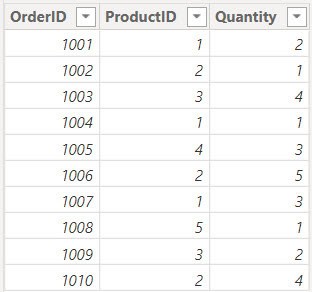
Imagine you have an Orders table with order IDs, product IDs, and quantities and a separate Products table containing product IDs, names, and prices.
Orders Table:
Products Table:
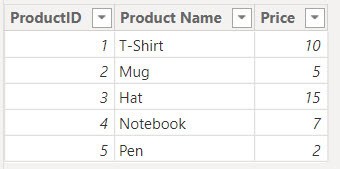
You want to create a new calculated column in the Orders table named “Extended Price” that multiplies the quantity of each order by the price of the corresponding product from the Products table. This will give you the total price for each order item.
Now follow the below steps to do this:
First, we need to create a relationship between the two tables using the ProductID column. Follow these steps:
- Go to the “Model” view by clicking on the “Model” icon on the left sidebar.
- You will see the Orders Table and the Products Table.
- Click and drag the ProductID column from the Orders Table to the ProductID column in the Products Table.
- A line will appear between the two tables, indicating that a relationship has been created.

Go to the Modeling tab and select New Column. Then, in the formula bar, put the below formula:
Extended Price = 'Orders Table'[Quantity] * RELATED('Products Table'[Price])Where:
- Extended Price = This part names the calculated column we’re creating, which represents the total price for each order line.
- ‘Orders Table'[Quantity] = This refers to the ‘Quantity’ column in the ‘Orders Table’. It represents the number of units ordered.
- RELATED(‘Products Table'[Price]) = This function fetches the ‘Price’ from the ‘Products Table’ corresponding to the product in the current row of the ‘Orders Table’. It assumes there is a relationship between the ‘Orders Table’ and the ‘Products Table’.

Now, your Orders table will have a new “Extended Price” column that calculates the total price for each order item by considering both the quantity and the corresponding product price.
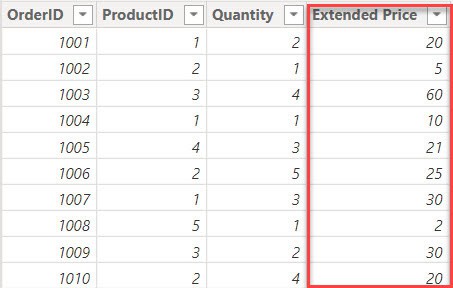
This way, you can create a Power BI calculated column from another table.
Power BI Add Calculated Column to Table Visual
Here, we see how to add a calculated column in the Power BI table visual.
In the above example, we created a calculated column named “Extended Price.” We also created a table visually and added Order IDs, Product IDs, Quantities, Product Name, Price, and Extended Price columns.
Under the Home tab, open the Visual gallery and select Table Visual. Then, using the +Add data option, add Order IDs, Product IDs, Quantities, Product Name, Price, and Extended Price.
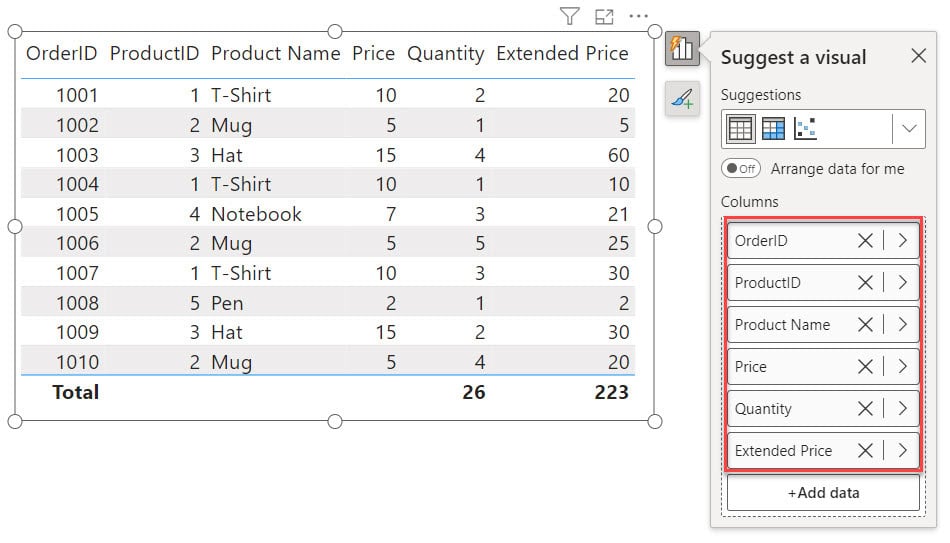
You can add the calculated column to the Power BI matrix visual.
In this Power BI tutorial, we covered the definition and creation of calculated columns in Power BI, along with specific topics such as creating calculated columns based on other columns, calculating averages by category, using if statements in calculated columns, and applying multiple filters in calculated column creation.
You may also like:
- How to Sort by Multiple Columns in Power BI?
- Power BI Table Conditional Formatting
- Power BI Conditional Formatting Based On Field Value
- Power BI Group by Measure
- Power BI IF NULL then 0
I am Bijay a Microsoft MVP (10 times – My MVP Profile) in SharePoint and have more than 17 years of expertise in SharePoint Online Office 365, SharePoint subscription edition, and SharePoint 2019/2016/2013. Currently working in my own venture TSInfo Technologies a SharePoint development, consulting, and training company. I also run the popular SharePoint website EnjoySharePoint.com