In this article, we will learn about the Power BI matrix multiple columns and the Power BI matrix multiple column headers.
Additionally, we will cover some topics listed below:
- Power BI matrix multiple column grouping
- Power BI matrix multiple columns in row
- Power BI matrix multiple columns sort
- Power BI matrix multiple columns side by side
Power BI Matrix with Multiple Columns
Here, we learn how to display the matrix visual with Multiple columns in Power BI.
Scenario:
Imagine you’re the HR manager at a manufacturing company and want to analyze employee performance across different departments. You have data on employee names, departments, sales figures achieved, and customer satisfaction ratings.
A Power BI matrix with multiple columns can help you visualize this data effectively.
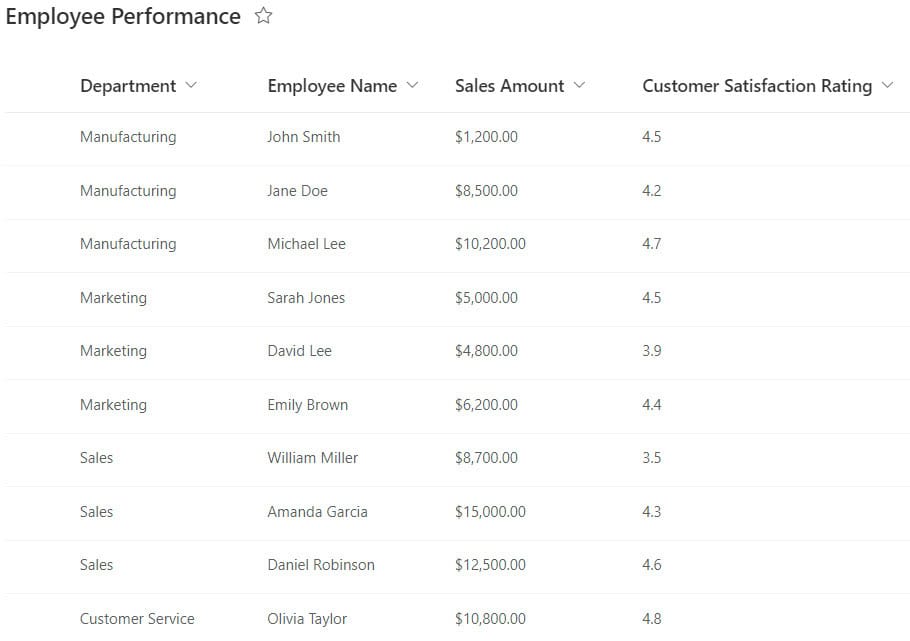
According to this scenario, we have a SharePoint list named Employee Performance that contains the following columns with various data types:
| Columns | Data Types |
|---|---|
| Depatment | Single line of text |
| Employee Name | Single line of text |
| Sales Amount | Currency |
| Customer Satisfaction Ratings | Number |
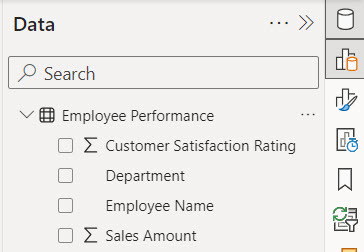
1. Open Power BI Desktop and load the above SharePoint List in Power BI Desktop. Then, you can see the data presented in the Data pane.
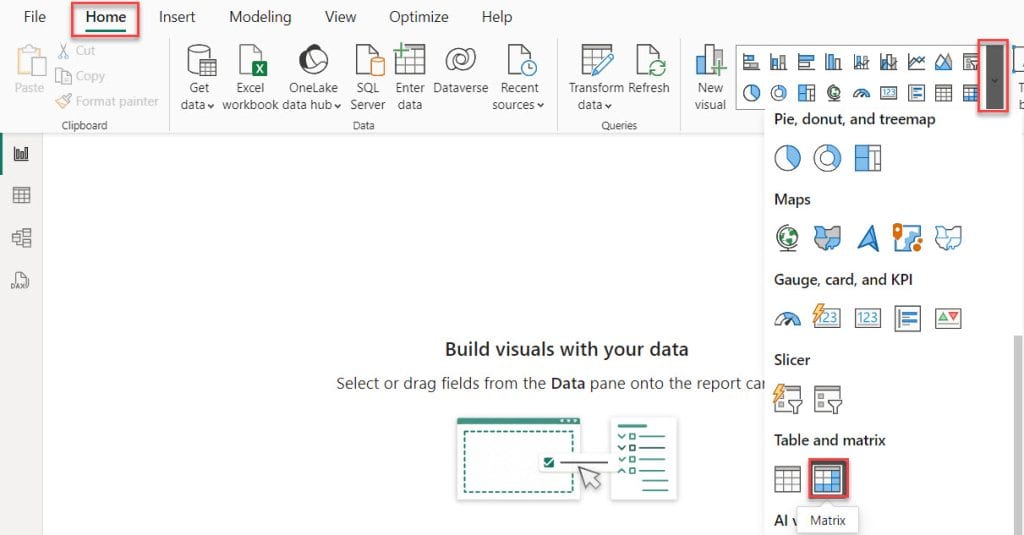
2. Under the Home tab, click “Visual gallery,” then click Matix Visual.
3. Drag the Employee Name field to the Rows section. This will create individual columns for each employee. Then, drag the Department, Sales Amount, and Customer Satisfaction Rating fields to the Value section.
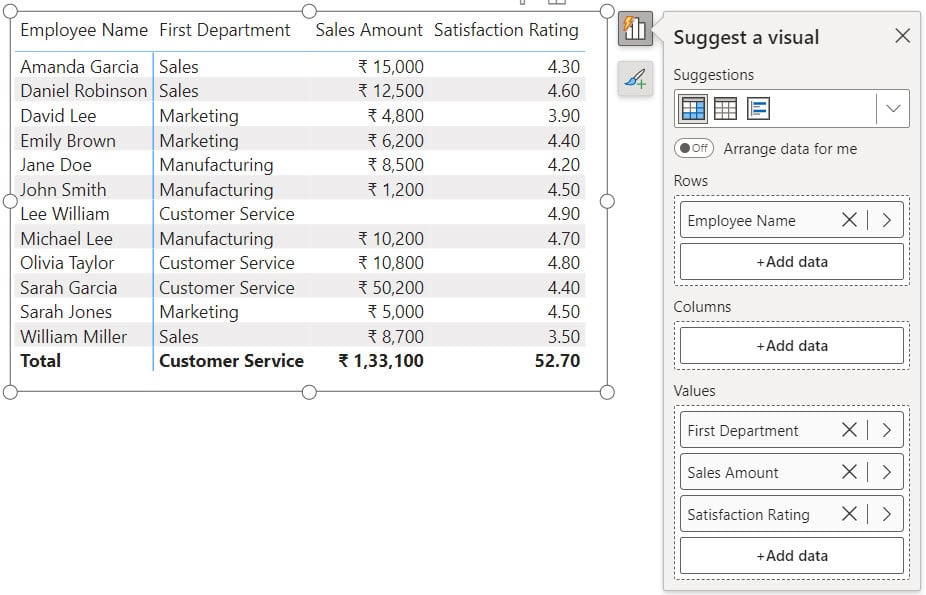
This is how we can display the matrix visual with Multiple columns in Power BI.
Power BI Matrix Multiple Column Headers
Let’s see how we can format the matrix with multiple column headers in Power BI.
Now, follow the steps below to format multiple-column headers:
I hope you have already created a matrix with multiple columns in Power BI.
1. Select the matrix visual, click the Format option, and the Format pane will open. Expand the Column headers section here.
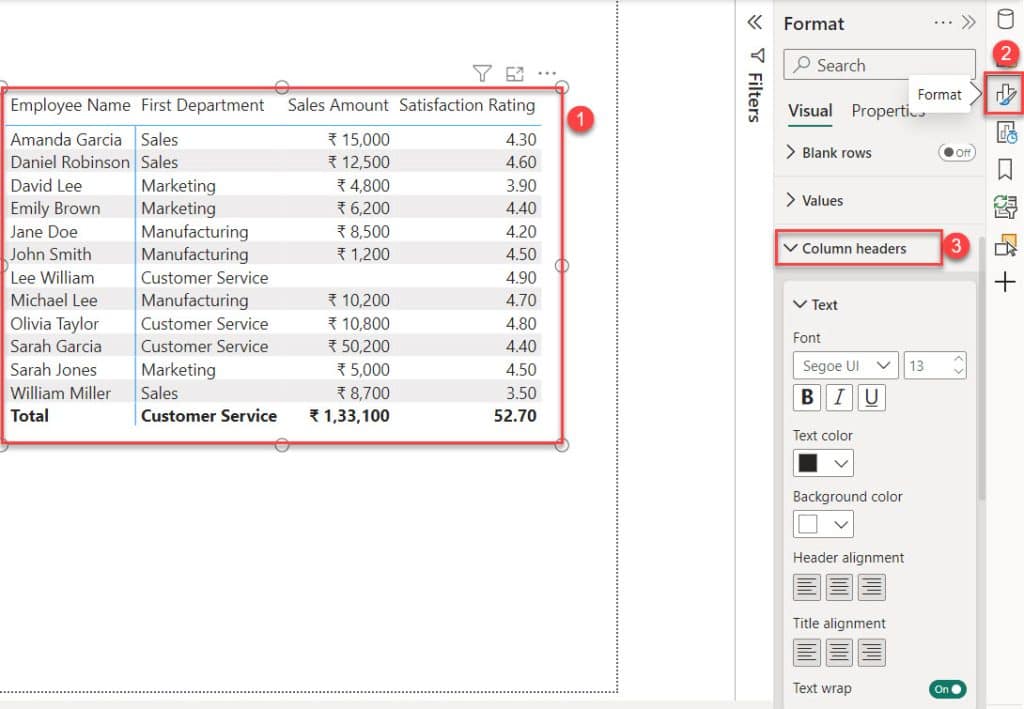
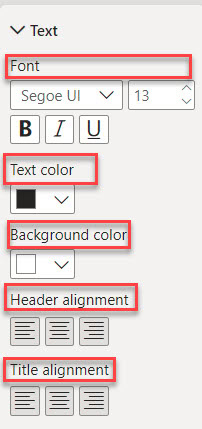
2. Here, you can change the font family, font size, text color, background color, header alignment, and title alignment.
3. In the screenshot below, you can see the font size is set to 17, the text color is white, and the background color is black. You can format these settings as per your requirements.
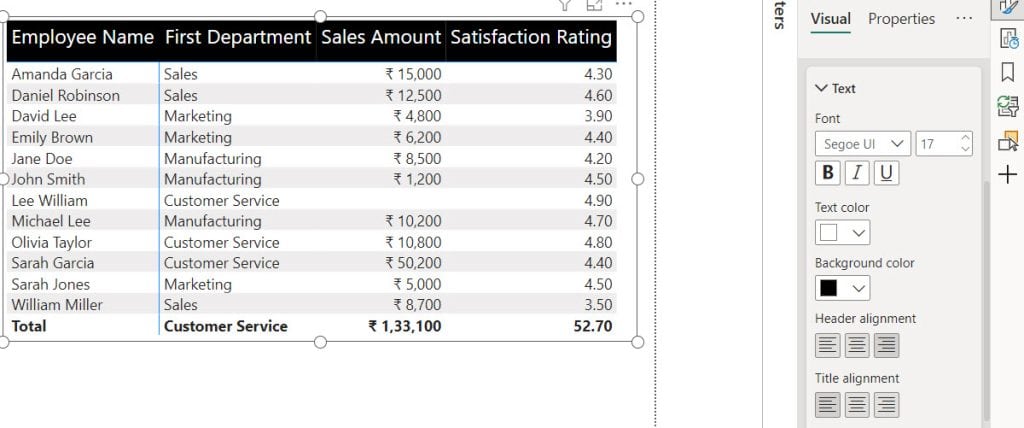
This is how we can format the matrix multiple-column headers in Power BI.
Power BI Matrix Multiple Column Grouping
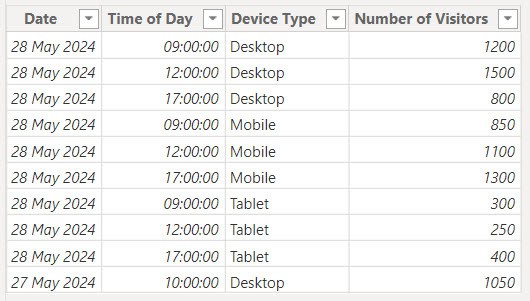
Imagine you’re a website manager for a news organization. You want to understand how website traffic varies by device type (desktop, mobile, tablet) and throughout different times of the day. A Power BI matrix with multiple-column groupings can help visualize these trends effectively.
According to this scenario, we have a dataset in Power BI. Please check the screenshot below.
Now, under the Home tab, click “Visual gallery,” then click Matix Visual.
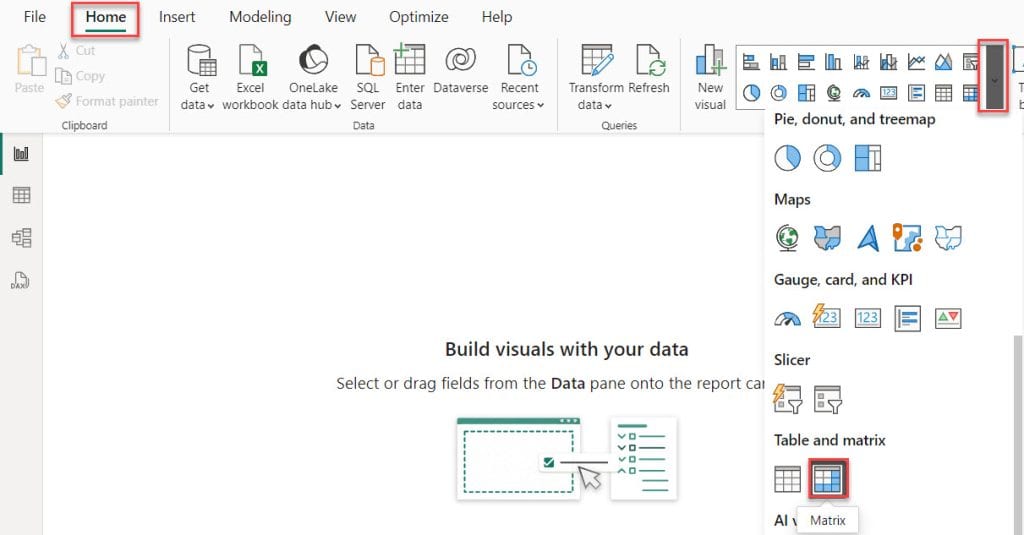
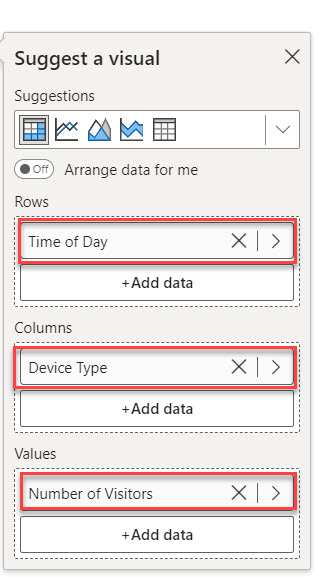
In the Power BI matrix, drag the “Time of Day” field in the Rows, the “Device Type” field in the Columns, and the “Number of Visitors” field in the Values section.
Then, our matrix visual looks like the screenshot below.
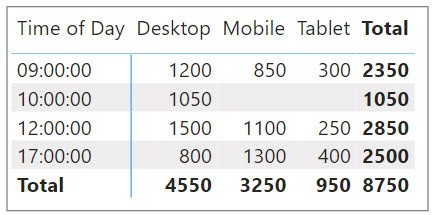
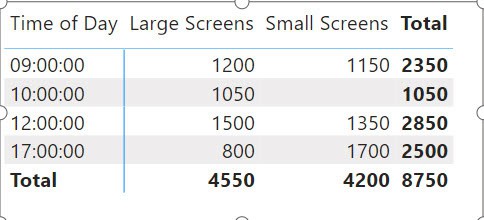
Here, you can see it’s divided into three groups (desktop, mobile, tablet), but I want only two (Large Screens, Small Screens). Now, follow the steps below to do this:
Now, right-click the “Device Type” field and select “New group”.
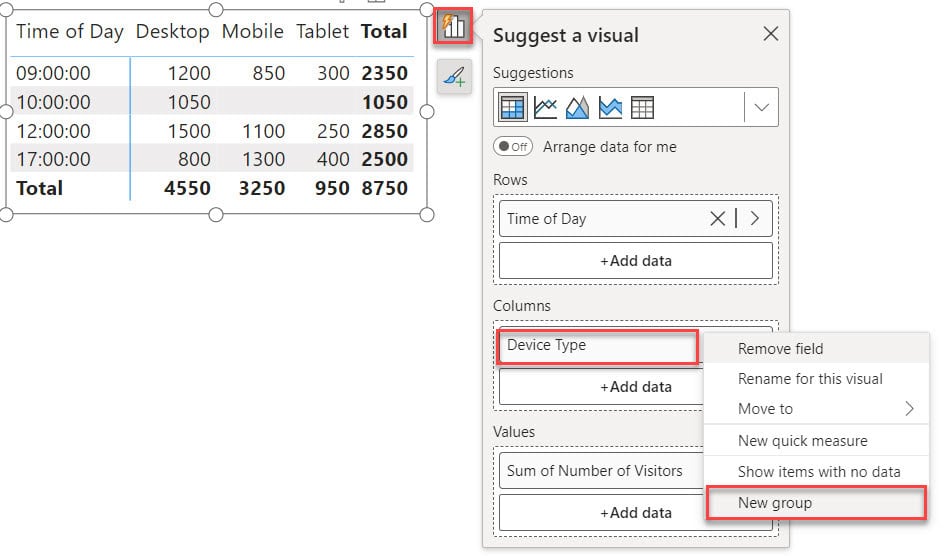
In the Groups window that opens, select “Desktop,” then click “Group.”
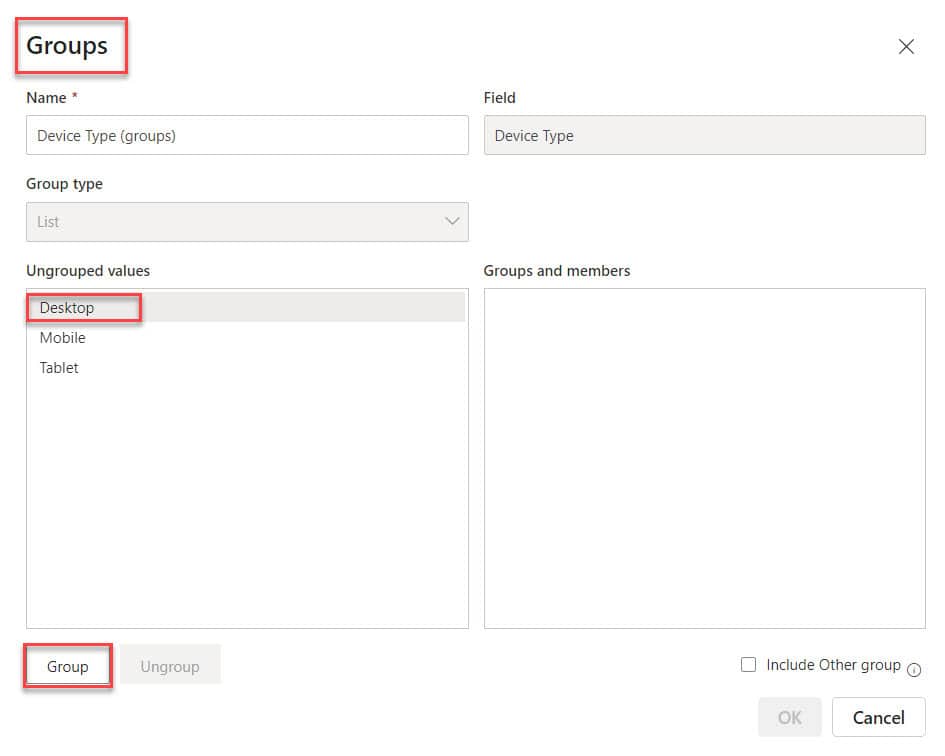
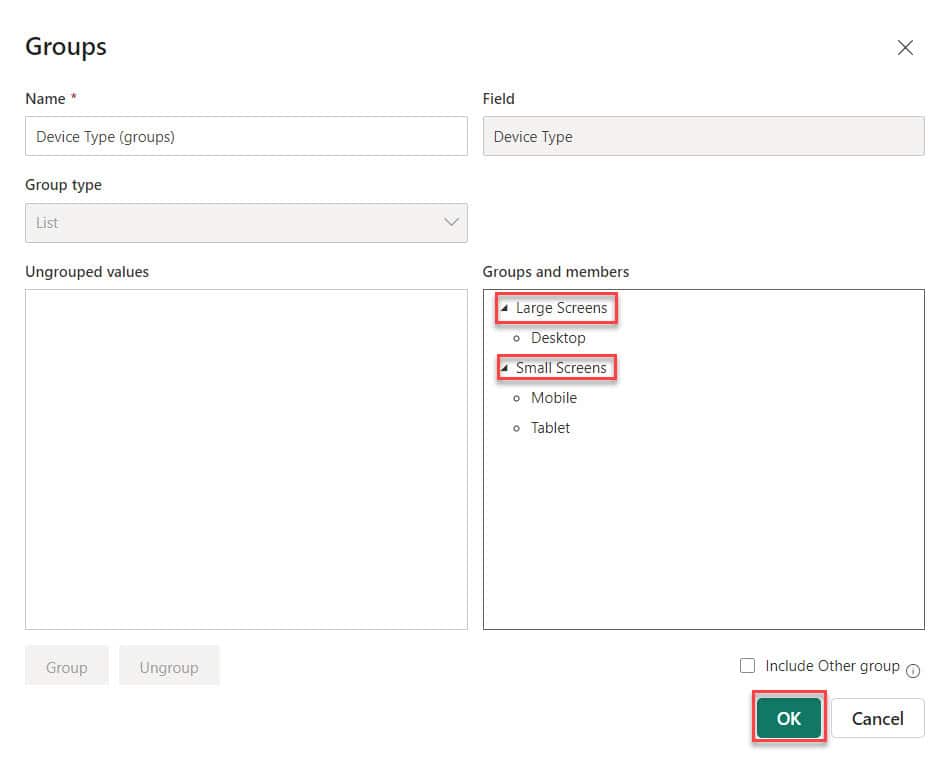
Then, rename “Desktop” as “Large Screens” and then group “Mobile” and “Tablet” together. Rename this group as “Small Screens”. After that, click OK.
After that, our matrix visual looks like the screenshot below.
Power BI Matrix Multiple Columns in Row
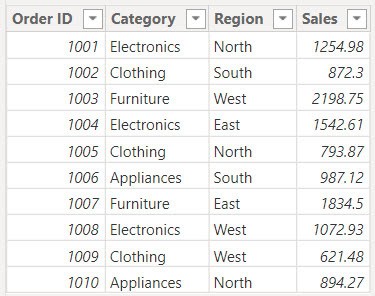
Imagine you’re analyzing sales data. You want to see side-by-side comparisons of sales figures for different product categories (e.g., Electronics, Clothing) across various regions (e.g., North, South).
A standard matrix might only show categories as rows or columns, but you’d like to have both categories and regions stacked as rows for a more compact and visually appealing presentation.
According to this scenario, I already loaded a dataset in Power BI. Please check the screenshot below.
Now follow the below steps to do this:
Now, under the Home tab, click “Visual gallery,” then click Matix Visual. Drag Category and Region into the Rows section and Sales into the Values section.
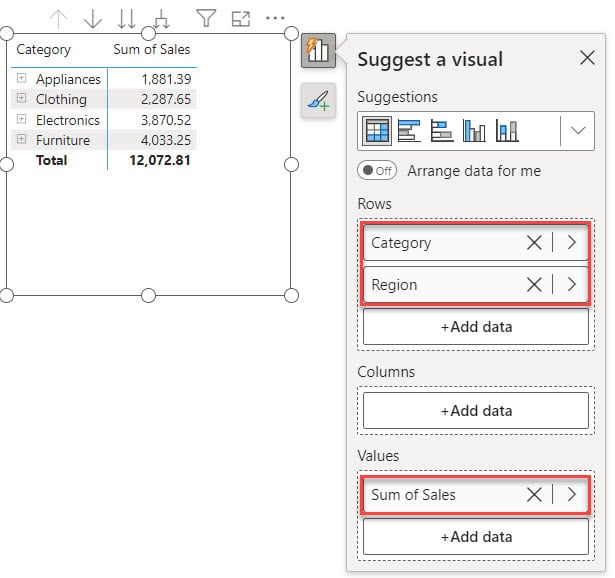
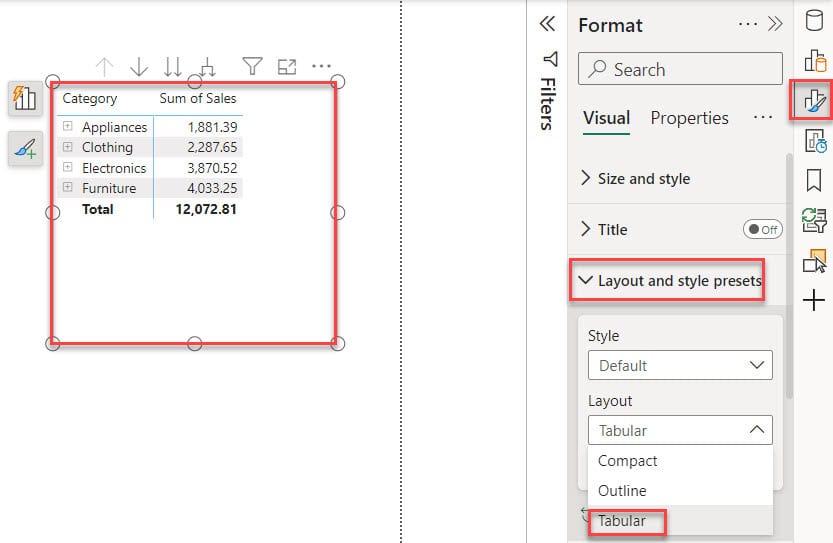
Select the matrix visual, go to the Format pane, expand the Layout section, and under Style presets, select Layout as Tabular.
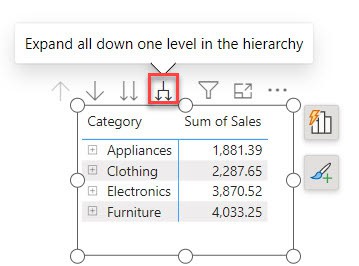
Then, in the matrix visual, click Expand all down one leave in hierarchy.
After that, our matrix visual looks like the screenshot below.
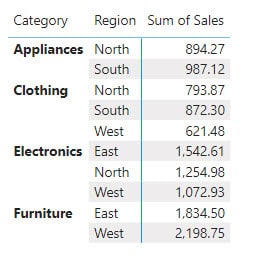
This way, you can create a Power BI matrix with multiple columns in a row.
Power BI Matrix Multiple Columns Sort
Now, we see how to sort multiple columns in the Power BI matrix visual.
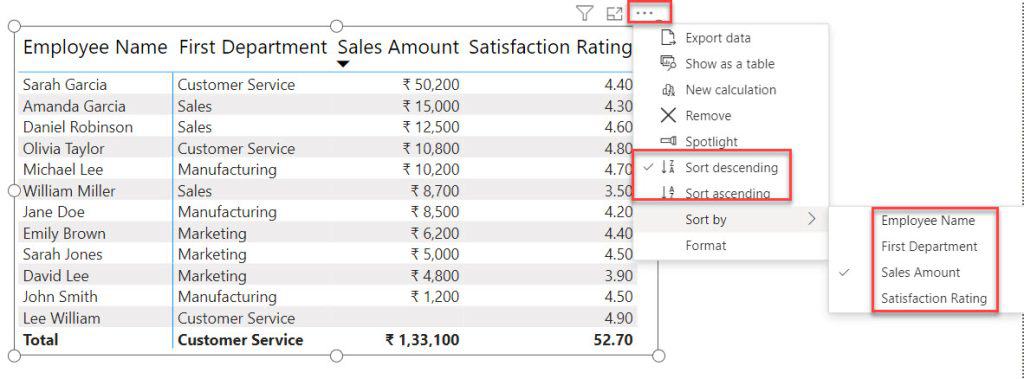
Unfortunately, Power BI matrices don’t natively support sorting by multiple columns in the rows.
You can only sort one column at a time. To do this, follow the steps below:
Select the matrix visual, then click the three dots in the top-right corner. Choose Sort ascending or Sort descending. After that, expand Sort by and choose the column you want to sort.
Power BI Matrix Multiple Columns Side By Side
In this example, we see how we can display the Power BI matrix in multiple columns side by side.
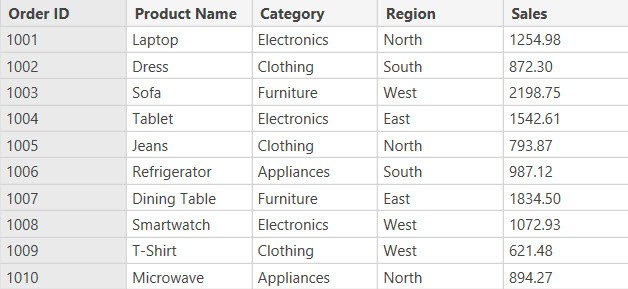
To do this, we have a dataset named Sample Sales Data. Please check the screenshot below.
Under the Home tab, click “Visual gallery,” then click Matrix Visual. Drag “Product Name” into the Rows section, and drag “Category,” “Region,” and “Sales” into the Values section.
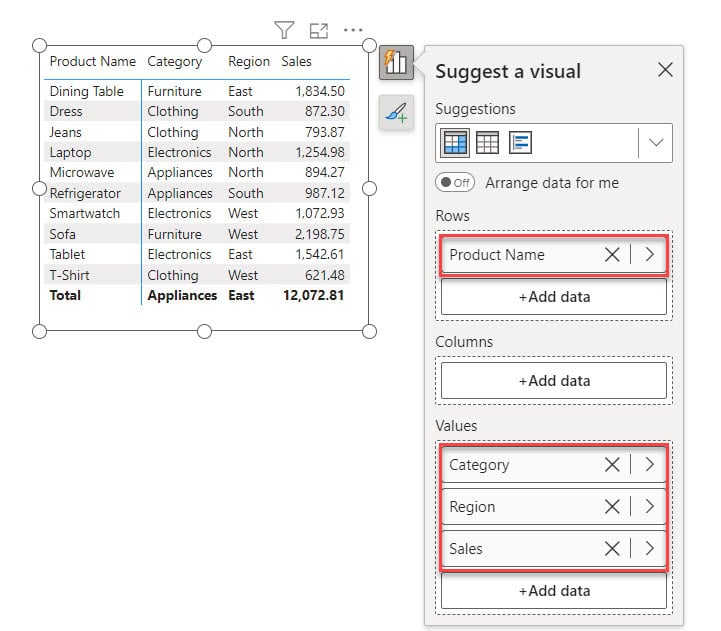
This way, you can display the Power BI matrix in multiple columns side by side.
Moreover, you may also like:
- Power BI Measure Subtract Two Columns
- How to Compare Two Columns in Different Tables in Power BI
- Convert Month Number to Month Name in Power BI
- Embed Power BI Report in SharePoint Online
In this article, we covered the Power BI matrix with multiple columns and multiple column headers, including topics such as grouping multiple columns, displaying multiple columns in rows, sorting multiple columns, and placing multiple columns side by side.
I am Bijay a Microsoft MVP (10 times – My MVP Profile) in SharePoint and have more than 17 years of expertise in SharePoint Online Office 365, SharePoint subscription edition, and SharePoint 2019/2016/2013. Currently working in my own venture TSInfo Technologies a SharePoint development, consulting, and training company. I also run the popular SharePoint website EnjoySharePoint.com