In this Power Bi tutorial, we will see how to remove the date hierarchy in Power Bi. Also, we will see how to drill through the date hierarchy in Power Bi.
Remove Date Hierarchy in Power BI
Let us see how to remove the date hierarchy in a Power Bi report.
You can download the sales table data here that we are going to use in this example.
Follow the below steps to remove the date hierarchy:
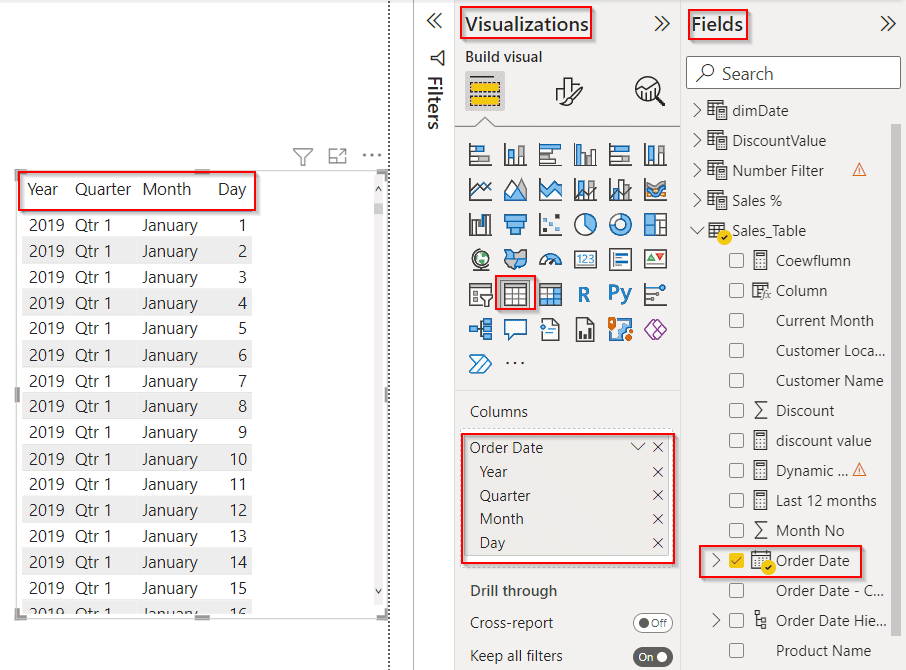
- Load the table data into the Power Bi desktop, using the get data option. And From the visualization choose the Table visual and drag and drop the Order Date field from the fields pane as shown below:
- By default, when we select the date field it displays a date value in a date hierarchy format. (Year, Quarter, Month, and Day)
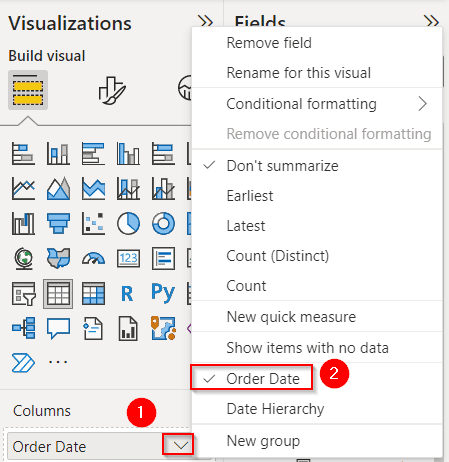
- Now Expand the date column instead of the date hierarchy and select only the date column.
- It automatically removes the date hierarchy format and displays only the date value as like below:
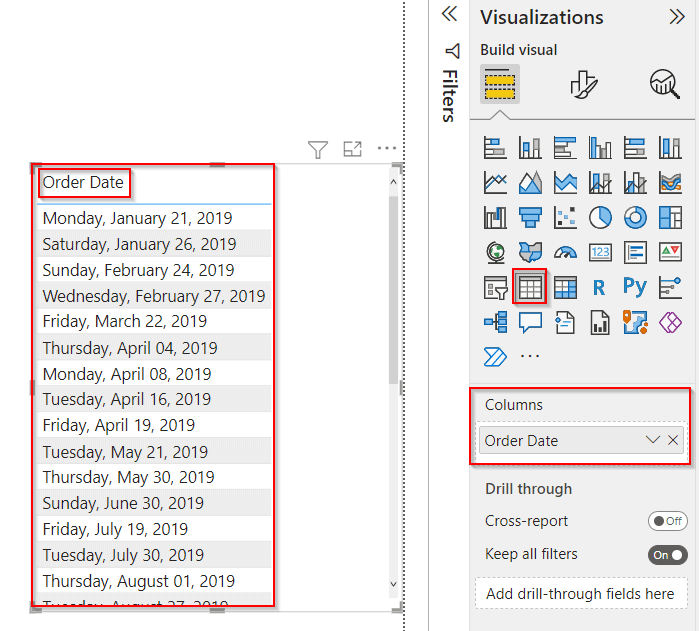
In the below screenshot, you can see that the table’s visual displays the order date value as expected and not in the date hierarchy format in Power Bi.
This is how to remove the date hierarchy in a Power Bi report.
Power BI drill through the date hierarchy
Let us see how we can drill through the date hierarchy in the Power Bi report.
- There are two ways we can drill down, the first way is inline drill down by clicking on the double down arrow, we can drill down each level of the date hierarchy (Year -> Quater -> Month -> Day).
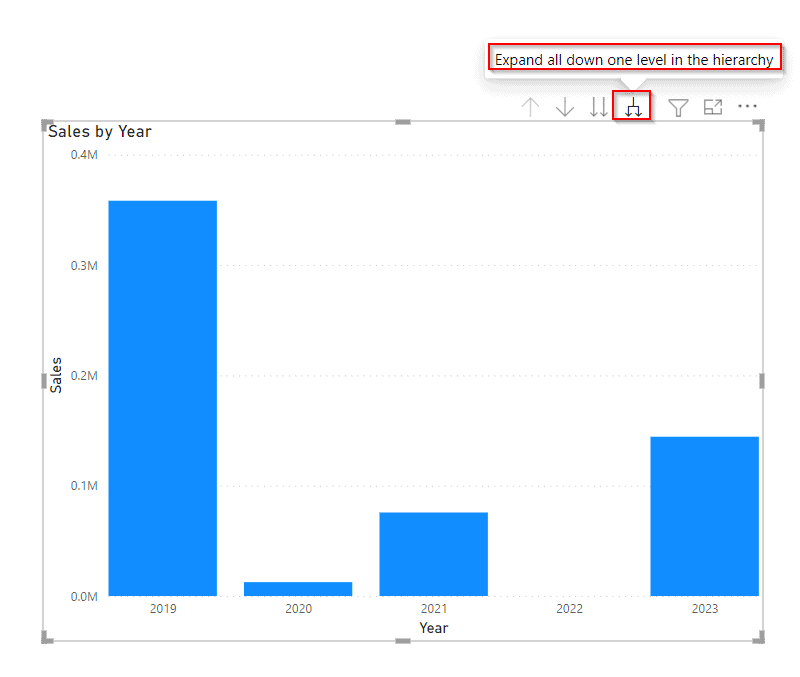
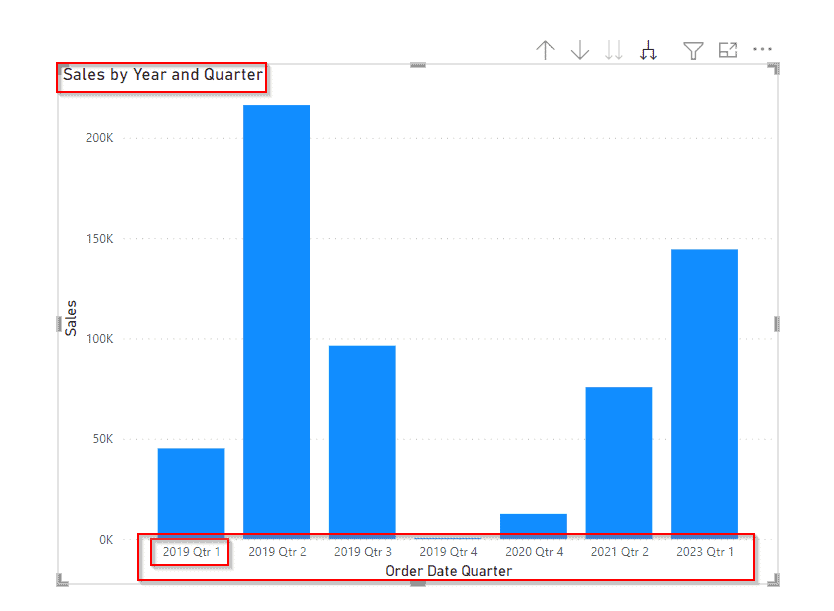
- And the second way of drill-down is a Tree drill down by clicking on the tree icon, we can expand to the next level of the hierarchy (Year -> Year Quater -> Year Quater Month -> Year Quater Month Day).
Inline drill-down date hierarchy
- Select the Clustered column chart from the visualizations, and add the date hierarch and Sales fields from the fields pane.
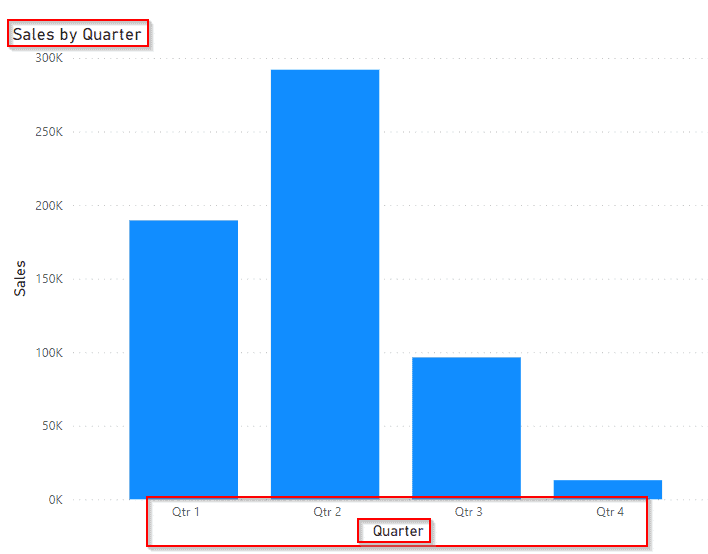
- Then click on the double arrow icon, and you can see the date hierarchy goes to the next level of hierarchy.
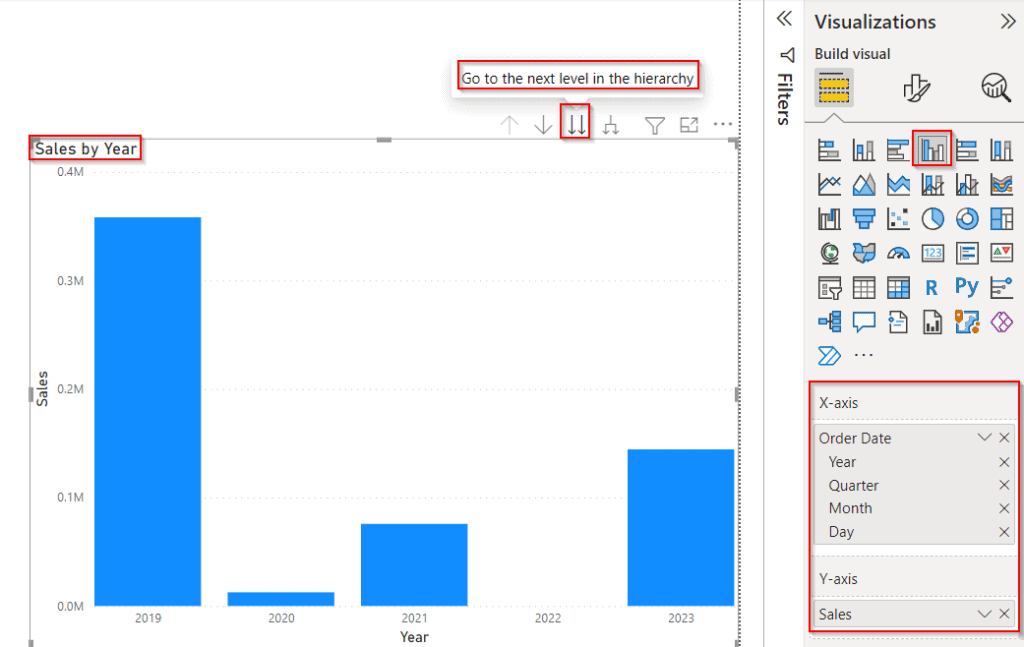
In the below screenshot, you can see that the clustered column displays the next-level hierarchy as a Quarter value.
Tree drill-down date hierarchy
- Select the Clustered column chart from the visualizations, and add the date hierarch and Sales fields from the fields pane.
- Then click on the Tree arrow icon, and you can see the date hierarchy expanded to the all-down one-level hierarchy.
The screenshot below displays the next level as Year& Quarter in the tree drill-down date hierarchy.
This is how to drill through the date hierarchy in the Power Bi report.
In this Power Bi tutorial, we have learned how to remove the date hierarchy in Power Bi. Also, we will see how to drill through the date hierarchy in Power Bi.
You may also like the following Power BI tutorials:
- Power BI date slicer between a default to today
- What if parameter Power BI Date
- Power BI Date slicer only shows dates with data
- Power BI Date Slicer By Month
- How to Add a Date Slicer in Power BI
I am Bijay a Microsoft MVP (10 times – My MVP Profile) in SharePoint and have more than 17 years of expertise in SharePoint Online Office 365, SharePoint subscription edition, and SharePoint 2019/2016/2013. Currently working in my own venture TSInfo Technologies a SharePoint development, consulting, and training company. I also run the popular SharePoint website EnjoySharePoint.com