In this Microsoft Power BI tutorial, I have explained how to filter the values using the Power BI DAX Max Filter function and also, and we will see how to calculate the Average value using the Power bi DAX max function. I will also show you different examples of Power bi Max Filter functions in Power BI.
I recently worked on a Power Bi dashboard, where I got a requirement to filter the table data values using the Power BI Max Filter function.
- Power BI DAX filter max value
- Power BI DAX filter max date
- Power BI DAX average with filter
- Power bi Dax max filter empty
- Power bi Dax max filter if
- Power bi Dax filter and count
- Power bi Dax filter distinct
- Power BI DAX calculates the max filter
- Power bi Dax max filter for multiple values
- Power bi Dax max filter all
- Power bi Dax max filter greater than
- Power bi Dax max filter null values
- Power bi Dax max filter percentage
- Power bi Dax max filter equal
- Power bi Dax max filter first value
- Power bi Dax max filter from multiple tables
- Power bi Dax max filter lookup/lookup column
- Power bi Dax max filter not blank
Power BI DAX max filter
Let us see how we can calculate and filter the maximum value using the Power Bi max function in Power Bi.
In this example, we will use the Product Table data as below mentioned to calculate and filter the maximum value using the Power Bi max function in Power Bi.

Power Bi Syntax for Maximum function:
MAX(<column>)- Open the Power Bi desktop, and load the data into the desktop. Select the new measure option from the ribbon under the Home tab and apply the below-mentioned formula.
Max Filter = MAXX(FILTER('Product Set A',[Product Name]="Laptop"), 'Product Set A'[Sales]+ 'Product Set A'[Units Delivered])Where,
- Max Filter = New Measure name
- Product Set A = Table Name
- Product Name, Sales, Units Delivered = Existing column names
- Now in the report section, select the table visual and card visual. In the table visually drag and drop the Product Name, Sales, and Units Delivered values from the field pane.
- And in the card visual drag and drop the created measure value to display the maximum value based on the condition applied.
- The screenshot below displays the maximum sales value and unit delivered value in the card visual for the product named called Laptop.

This is how to calculate and filter the maximum value using the Power Bi max function in Power Bi.
Power BI DAX filter max value
Let us see how we can filter the max value using the Power Bi Dax Max function in Power BI.
In this example, we will calculate the maximum sales value for the products presented in the table.
- Open the Power Bi desktop, and load the data into the desktop. Select the new measure option from the ribbon under the Home tab and apply the below-mentioned formula.
Max sequence = CALCULATE(MAX('Product Set A'[Sales]),VALUES('Product Set A'[Product Name]))Where,
- Max sequence = New Measure name
- Product Set A = Table Name
- Product Name = Existing column name
- Now in the report section, select the table visual and card visual. In the table visually drag and drop the Product Name, Sales, and Units Delivered values from the field pane.
- And in the card visual drag and drop the created Max Sequence measure value to display the maximum value of the sales value.
- In the below screenshot, you can see that the card visually displays the maximum sales value of all the products.
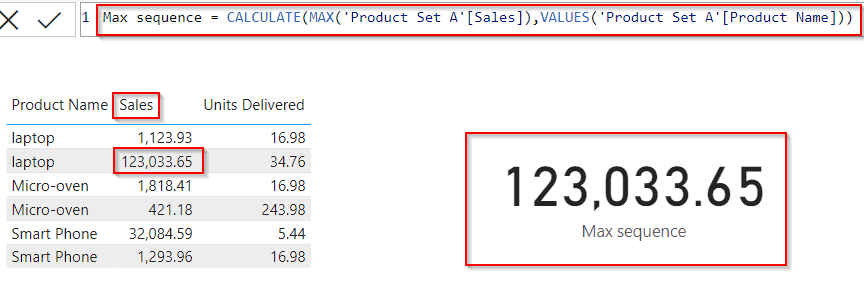
This is how to filter the max value of all products using the Power Bi Dax Max function in Power BI.
Power BI DAX max date
Let us see how we can calculate the maximum date using Power Bi max date function in Power Bi.
In this example, we will calculate the maximum date for the order date column in the car table.
- Open the Power Bi desktop, and load the data into the desktop. Select the new measure option from the ribbon under the Home tab and apply the below-mentioned formula.
Latest Product =
var Maxdate =MAX ('Product Set A'[Order Date])                                                                                                 var latestproduct = CALCULATE(SUM('Product Set A'[Sales]),'Product Set A'[Order Date] =  Maxdate)
return latestproduct
Where,
- Latest Product = New Measure name
- Product Set A = Table Name
- Order Date = Existing column name
- Max date, latest product = Variable name
- Now in the report section, select the table visual and card visual. In the table visually drag and drop the product name, Sales, and Order date fields from the field pane.
- And in the card visual drag and drop the Created measure value to display the maximum price value based on the calculated maximum order date.
- The screenshot below displays the sales value in the card visual for the maximum car based on the order date column.
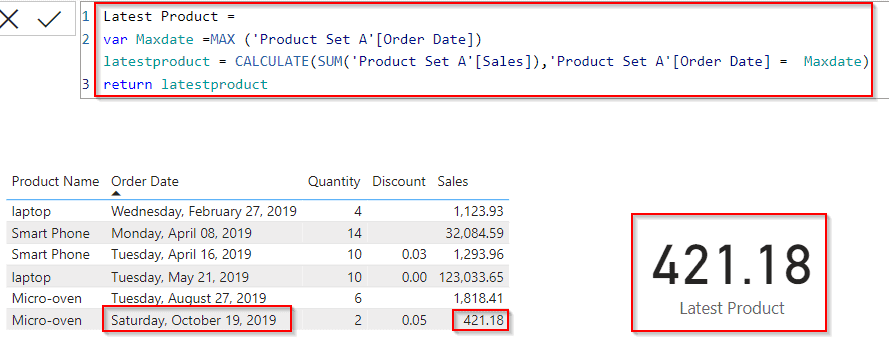
This is how to calculate the maximum date using Power Bi max function in Power Bi.
Power BI DAX average with filter
Here we will calculate and filter the average value using the Power Bi Average function in Power BI.
In this example, we will calculate and filter the average value of sales based on the Product using the Average function in Power Bi.
- Open the Power Bi desktop, and load the data into the desktop. Select the new measure option from the ribbon under the Home tab and apply the below-mentioned formula.
AVG_sales =
CALCULATE ( AVERAGE ('Product Set A'[Sales] ), 'Product Set A'[Product Name]="Smart Phone" )
Where,
- AVG_sales = New Measure name
- Product Set A = Table Name
- Product Name, Sales = Existing column names
- Now in the report section, select the table visual and card visual. In the table visually drag and drop the Product Name, Sales, and Units Delivered values from the field pane.
- And in the card visual drag and drop the created Average sales measure value to display the maximum value of the sales value.
- In the below screenshot, you can see that the card visually displays the average sales value for the mentioned product.

This is how to calculate and filter the average value using the Power Bi Average function in Power BI.
Power bi Dax max filter empty
Let us see how we can filter and count the empty values using the Power Bi Dax max function in Power BI.
In this example, we will calculate and filter the empty value of the discount based on the condition using the Filter function in Power Bi.
- Open the Power Bi desktop, and load the data into the desktop. Select the new column option from the ribbon under the Home tab and apply the below-mentioned formula.
Empty Values = COUNTROWS( FILTER(
        'Product Set A',
        'Product Set A'[Discount] = BLANK()
    )
)
Where,
- Empty Values = New column name
- Product Set A = Table Name
- Discount = Existing column name
In the below screenshot, We can see that the new column, displays the count as 2 because it considers the empty value and also the zero values.

This is how to filter and count the empty values using the Power Bi Dax max function in Power BI.
Power bi Dax max filter if
Let us see how we can filter the max value using the Power Bi Max function in Power bi.
In this example, we will calculate the max and min values if the sales order date is equal to the max date value then it will display the value as 1 else 0.
- Open the Power Bi desktop, and load the data into the desktop. Select the new measure option from the ribbon under the Home tab and apply the below-mentioned formula
Max Filter If =
VAR maxdate =
    CALCULATE ( MAX ('Product Set A'[Order Date] ), ALL ( 'Product Set A'[Product Name] ) )
RETURN
    IF ( MIN ('Product Set A'[Order Date] ) = maxdate, 1, 0 )
Where,
- Max Filter If = New Measure name
- Product Set A = Table Name
- Order Date = Existing column name
- maxdate = Variable name
- Now in the report section, select the table visually and then drag and drop the Product Name, Sales, and Units Delivered values from the field pane. And In addition, drag and drop the created measure value in the table visual.
- In the below screenshot, you can see that the table visually displays the value as 1,0 (as highlighted below)based on the condition.
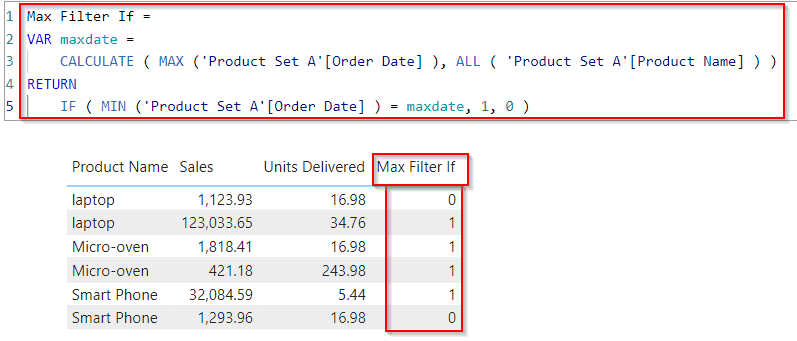
This is how to filter the max value using the Power Bi Max function in Power bi.
Power bi Dax filter and count
Here we will calculate and filter the value using the Power Bi Count function in Power BI.
In this example, we will calculate and filter the value of Products based on the order date using the Power Bi Dax filter function in Power BI.
- Open the Power Bi desktop, and load the data into the desktop. Select the new measure option from the ribbon under the Home tab and apply the below-mentioned formula.
Laptop Orders Count = COUNTX(FILTER('Product Set A','Product Set A'[Product Name]="Laptop"),'Product Set A'[Order Date])Where,
- Laptop Orders Count = New Measure name
- Product Set A = Table Name
- Order Date = Existing column name
- Now in the report section, select the table visual and card visual. In the table visually drag and drop the Product Name, and order date values from the field pane.
- And in the card visual drag and drop the created Laptop Orders Count measure value.
- In the below screenshot, you can see the card visually displays the mentioned product value count.

This is how to calculate and filter the value using the Power Bi Count function in Power BI.
Power bi Dax filter distinct
Here we will calculate and filter the distinct value using the Power Bi Average function in Power BI.
In this example, we will calculate and filter the distinct value of sales based on the Product using the Distinct function in Power Bi.
- Open the Power Bi desktop, and load the data into the desktop. Select the new measure option from the ribbon under the Home tab and apply the below-mentioned formula.
Distinct Count = COUNTROWS(DISTINCT('Product Set A'[Product Name]))
Where,
- Distinct Count = New Measure name
- Product Set A = Table Name
- Product Name = Existing column name
- Now in the report section, select the table visual and card visual. In the table visually drag and drop the Product Name, and order date values from the field pane.
- And in the card visual drag and drop the created distinct Count measure value.
- In the below screenshot, you can see the card visually displays the distinct value count for the Products.
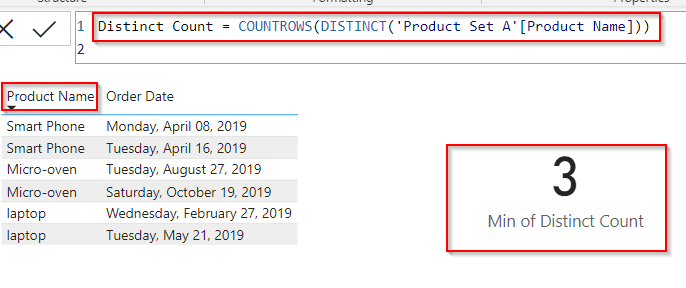
This is how to calculate and filter the distinct value using the Power Bi Average function in Power BI.
Read Power BI filter between two dates
Power BI DAX calculates the max filter
Let us see how we can filter and calculate the max value of the Power Bi Calculate function in Power BI.
In this example, we use the Power Bi calculate function to filter the maximum sales value for the Product table data.
- Open the Power Bi desktop, and load the data into the desktop. Select the new measure option from the ribbon under the Home tab and apply the below-mentioned formula.
Calculates Max Value =
var maxvalue = MAXX(allselected('Product Set A'),'Product Set A'[Sales])
return
CALCULATE([Max Filter],
Filter(allselected('Product Set A'),'Product Set A'[Sales]= maxvalue))
Where,
- Calculates Max Value = New Measure name
- max value = Variable Name
- Product Set A = Table Name
- Sales = Existing column name
- Now in the report section, select the table visual and card visual. In the table visually drag and drop the Product Name, Sales, and Order date values from the field pane.
- And in the card visual drag and drop the created Max measure value to display the maximum value of the sales.
- In the below screenshot, you can see that the card visually calculates and displays the maximum sales value of all the products.
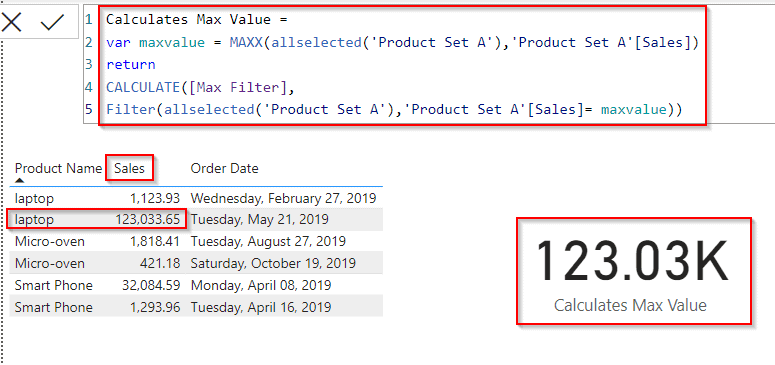
how to filter and calculate the max value of the Power Bi Calculate function in Power BI.
Power bi Dax max filter for multiple values
Let us see how we can compare and calculate the multiple values using the Power Bi Max function in Power BI.
In this example, we will compare the product names and filter the maximum sales value using the Power Bi Max function.
- Open the Power Bi desktop, and load the data into the desktop. Select the new measure option from the ribbon under the Home tab and apply the below-mentioned formula.
Multiple Values = var max1 = CALCULATE(MAX('Product Set A'[Sales]),ALLEXCEPT('Product Set A','Product Set A'[Product Name])) return max1Where,
- Multiple Values = New Measure name
- max1 = Variable Name
- Product Set A = Table Name
- Sales, Product Name = Existing column names
- Now in the report section, select the table visualization. In the table visually drag and drop the Product Name, Sales, and Order date values from the field pane.
- It compares the repeated product names and displays the maximum value for the multiple products.
- In the below screenshot, you can see that the table visually compares and displays the maximum value.

This is how to filter and calculate the max value of the Power Bi Calculate function in Power BI.
Power bi Dax max filter all
Let us see how we can filter the values using the Power Bi Max to filter all functions in Power BI.
In this example, we will filter the maximum quantity value for the products using the filter of all functions in Power BI.
- Open the Power Bi desktop, and load the data into the desktop. Select the new measure option from the ribbon under the Home tab and apply the below-mentioned formula.
Filter All = MAXX(FILTER(ALL('Product Set A'),'Product Set A'[Quantity]),'Product Set A'[Quantity])Where,
- Filter All = New Measure name
- Product Set A = Table Name
- Quantity = Existing column name
- Now in the report section, select the table visual and card visual. In the table visually drag and drop the Product Name, order date, and Quantity fields from the field pane.
- And in the card visual drag and drop the created Filter All measure value.
- In the below screenshot, you can see the card visually displays the maximum quantity value from the table data.

This is how to filter the values using the Power Bi Max filters all functions in Power BI.
Read Power bi Dax Today() Function
Power bi Dax max filter greater than
Here we will see how to filter the values using the Power Bi greater than formula in Power Bi
In this example, we will calculate the quantity value if the quantity value is greater than or equal to the mentioned value then it will display the value as True else False.
- Open the Power Bi desktop, and load the data into the desktop. Select the new column option from the ribbon under the Home tab and apply the below-mentioned formula.
Greater than = IF('Product Set A'[Quantity]>=10,TRUE(),FALSE())Where,
- Greater than = New column name
- Product Set A = Table Name
- Quantity = Existing column name
In the below screenshot, We can see that the new column, displays the value as true or false based on the condition applied.

This is how to filter the values using the Power Bi greater than the formula in Power Bi.
Power bi Dax max filter null values
Let us see how we can filter the null values using the Power Bi Dax max function in Power BI.
In this example, we will filter the null value of the discount column based on the condition using the Filter function in Power Bi.
- Open the Power Bi desktop, and load the data into the desktop. Select the new measure option from the ribbon under the Home tab and apply the below-mentioned formula
Max Null value = LASTNONBLANK('Product Set A'[Discount],MAX('Product Set A'[Sales]))Where,
- Max Null value = New Measure name
- Product Set A = Table Name
- Discount = Existing column name
- Now in the report section, select the table visual and card visual. In the table visually drag and drop the Product Name, order date, and discount fields from the field pane.
- And in the card visual drag and drop the created measure value to find the max null value.
- The screenshot below displays the max last null value in the card visual and removed the empty null values.

This is how to filter the null values using the Power Bi Dax max function in Power BI.
Power bi Dax max filter percentage
Here we will calculate and filter the percentage value using the Power Bi Divide function in Power BI.
In this example, we will filter the max percentage value of sales and quantity using the divide function in Power Bi.
- Open the Power Bi desktop, and load the data into the desktop. Select the new measure option from the ribbon under the Home tab and apply the below-mentioned formula.
Percent Max =
DIVIDE (
    SUM ('Product Set A'[Sales] ),
    CALCULATE ( MAX ( 'Product Set A'[Quantity]), ALLSELECTED ( 'Product Set A'[Product Name]) )
)
Where,
- Percent Max = New Measure name
- Product Set A = Table Name
- Product Name, Quantity = Existing column names
- Now in the report section, select the table visually. In the table visually drag and drop the Product Name, Sales, Quantity, and created Percent Max measure fields from the field pane.
- Once the value has been calculated under measure tools, change the format value from general to percentage format.
- In the below screenshot, you can see that the table visually displays the percentage max value for all the products.
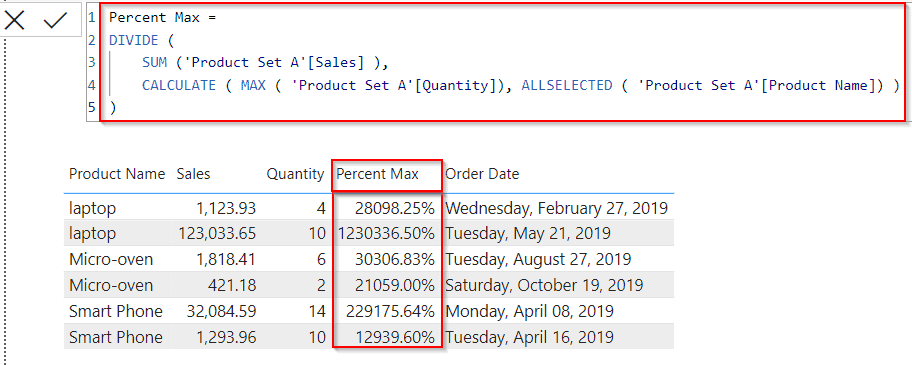
This is how to calculate and filter the percentage value using the Power Bi Divide function in Power BI.
Read Power BI DAX Calendar Function
Power bi Dax max filter equal
Here we will see how to filter the values using the Power Bi Dax max formula in Power Bi
In this example, we will calculate the quantity value if the quantity value is equal to the mentioned value then it will display the value as True else False.
- Open the Power Bi desktop, and load the data into the desktop. Select the new measure option from the ribbon under the Home tab and apply the below-mentioned formula.
Filter Condition = var result = MAX('Product Set A'[Quantity])

RETURN IF(result=10,TRUE(),FALSE())
Where,
- Filter Condition = New column name
- Product Set A = Table Name
- Quantity = Existing column name
- Now in the report section, select the table visually. In the table visually drag and drop the Product Name, Sales, Quantity, and created Max filter condition measure fields from the field pane.
- In the below screenshot, you can see that the table visually displays the value as true or false based on the condition applied.
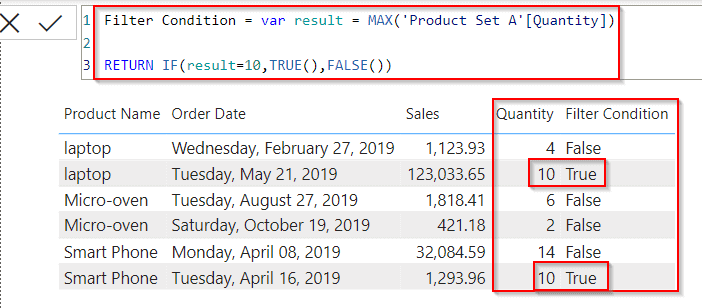
This is how to filter the values using the Power Bi Dax max formula in Power Bi.
Power bi Dax max filter first value
Let us see how we can filter the first max value using the Power Bi DAX max function in Power BI.
In this example, we will calculate the first-most Max value and display the result in the card visual.
- Open the Power Bi desktop, and load the data into the desktop. Select the new measure option from the ribbon under the Home tab and apply the below-mentioned formula.
First Max Value =
CALCULATE(
    [Max Filter],
    TOPN(
        1,
        FILTER('Product Set A','Product Set A'[Sales] = [Max Filter]),
        'Product Set A'[Max Filter])
        )
Where,
- First Max Value = New Measure name
- Product Set A = Table Name
- Sales = Existing column name
- Now in the report section, select the table visual and card visual. In the table visually drag and drop the Product Name, order date, and sales fields from the field pane.
- And in the card visual drag and drop the created First Max Value measure value.
- In the below screenshot, you can see the card visually displays the first maximum sales value from the table data.
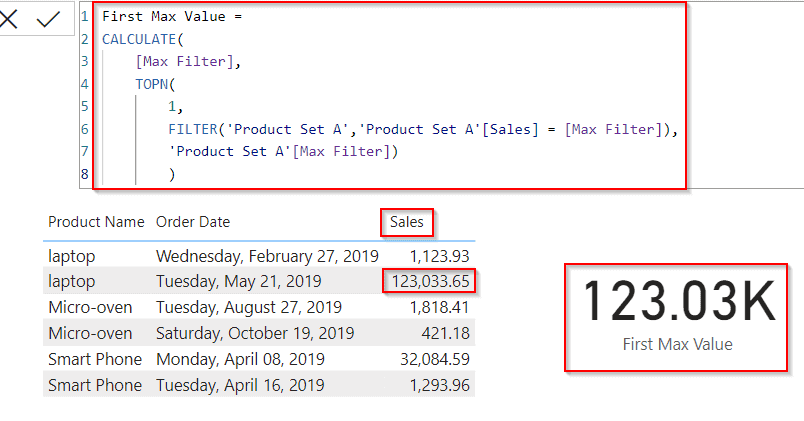
This is how to filter the first max value using the Power Bi DAX max function in Power BI.
Read How To Remove Filter From Power BI DAX
Power bi Dax max filter from multiple tables
Let us see how we can filter the value from different tables using the Power Bi filter function in Power Bi
In this example, I have used two tables, one is Product Set A and Product Set B if the Product Set A table quantity column is less than or equal to the Product Set B table quantity column in Power Bi.
Table 1 ( Product Set A)

Table 1 ( Product Set B)

- Open the Power Bi desktop, and load the data into the desktop. Select the new measure option from the ribbon under the Home tab and apply the below-mentioned formula.
Multiple Tables = CALCULATE( MAX( 'Product Set A'[Product Name] ) , FILTER( 'Product Set A', 'Product Set A'[Quantity] <= MAX('Product Set B'[Quantity]) ))Where,
- Multiple Tables = New Measure name
- Product Set A, Product Set B = Table Names
- Product Name, Quantity = Existing column names
- Now in the report section, select the table visual and card visual. In the table visually drag and drop the Product Name and quantity fields from the field pane.
- And in the card visual drag and drop the created measure value to display the product name based on the condition applied.
- The screenshot below displays the product name in the card visual for the maximum quantity value from two tables.

This is how to filter the value from different tables using the Power Bi filter function in Power Bi.
Power bi Dax max filter lookup
Let us see how we can filter the value using the Power Bi LookUp function in Power BI,
In this example, we will use the two tables as shown in the previous heading and filter the max value from the Product set A table to the Product Set table B using the max function in Power BI.
- Open the Power Bi desktop, and load the data into the desktop. Select the new column option from the ribbon under the Home tab and apply the below-mentioned formula.
Latest Result =
VAR Current_ID = 'Product Set B'[Customer Location]
VAR Max_Unix_Per_ID = CALCULATE(MAX('Product Set A'[Sales]), FILTER('Product Set A', 'Product Set A'[Customer Location] = Current_ID))
RETURN
CALCULATE(MAX('Product Set A'[Sales]), FILTER('Product Set A', MAX('Product Set A'[Sales]) = Max_Unix_Per_ID))
Where,
- Latest Result = New Measure name
- Current_ID, Max_Unix_Per_ID = Variable names
- Product Set A, Product Set B = Table Names
- Product Name, sales, customer location= Existing column names
In the below screenshot, you can see that the new column has been added and displayed the maximum value of the Product set A table in the Product set B table based on the customer location.

This is how to filter the value using the Power Bi LookUp function in Power Bi.
Power bi Dax max filter not blank
Let us see how we can filter non-blank values using the Power Bi Dax blank function in Power BI.
In this example, we will calculate and filter the non-blank values and display them in the new column of the data table.
- Open the Power Bi desktop, and load the data into the desktop. Select the new column option from the ribbon under the Home tab and apply the below-mentioned formula.
Non Blank Values = IF('Product Set A'[Discount]=BLANK(),BLANK(),'Product Set A'[Discount])Where,
- Non-Blank Values = New column name
- Product Set A = Table Name
- Discount = Existing column name
In the below screenshot, We can see that the new column, displays non-blank values as it is, and also it takes the zero value as the blank value.

This is how to filter non-blank values using the Power Bi Dax blank function in Power BI.
This Power BI tutorial explained how to easily Filter the max value from the table data using the Power Bi Dax Max Filter function. Also, we covered these topics below:
- Power BI DAX filter max value
- Power BI DAX filter max date
- Power BI DAX average with filter
- Power bi Dax max filter empty
- Power bi Dax max filter if
- Power bi Dax filter and count
- Power bi Dax filter distinct
- Power BI DAX filter between dates
- Power BI DAX calculates the max filter
- Power bi Dax max filter for multiple values
- Power bi Dax max filter all
- Power bi Dax max filter greater than
- Power bi Dax max filter null values
- Power bi Dax max filter percentage
- Power bi Dax max filter equal
- Power bi Dax max filter first value
- Power bi Dax max filter from multiple tables
- Power bi Dax max filter lookup/lookup column
- Power bi Dax max filter not blank
You may like the following Power BI tutorials:
- How to Filter Blank Value in Power BI
- How to add an empty column in Power BI
- add a column with the same value in Power BI
- How to Filter Date using Power BI DAX
- How to Merge Column in Power BI
I am Bijay a Microsoft MVP (10 times – My MVP Profile) in SharePoint and have more than 17 years of expertise in SharePoint Online Office 365, SharePoint subscription edition, and SharePoint 2019/2016/2013. Currently working in my own venture TSInfo Technologies a SharePoint development, consulting, and training company. I also run the popular SharePoint website EnjoySharePoint.com