The WEEKDAY function in Power BI helps you understand and analyze your data based on the day of the week.
In this Power BI tutorial, we learned what the weekday function of Power BI is and how to use Power BI Weekday function with an example.
Additionally, I will explain how to utilize the weekday() function in the Power BI visualizations.
Weekday function in Power BI
The WEEKDAY() in Power BI tells you which day of the week a specific date falls on. It gives a number representing the day, like 1 for Sunday, 2 for Monday, etc.
This function helps analyze our data based on weekdays, making it easier to see patterns or trends that might be related to certain days of the week.
Power BI WEEKDAY() Syntax:
WEEKDAY(<date>, <return_type>)Where:
- <date> = A date in datetime format.
- <return_type> = A number that determines the Return value:
- Return type 1 or omitted = Week begins on Sunday (1) and ends on Saturday (7).
- Return type 2 = Week begins on Monday (1) and ends on Sunday (7).
- Return type 3 = Week begins on Monday (0) and ends on Sunday (6).
How to Use Power BI Weekday Function
This example shows how to use the Power BI WEEKDAY function with a simple scenario.
Scenario:
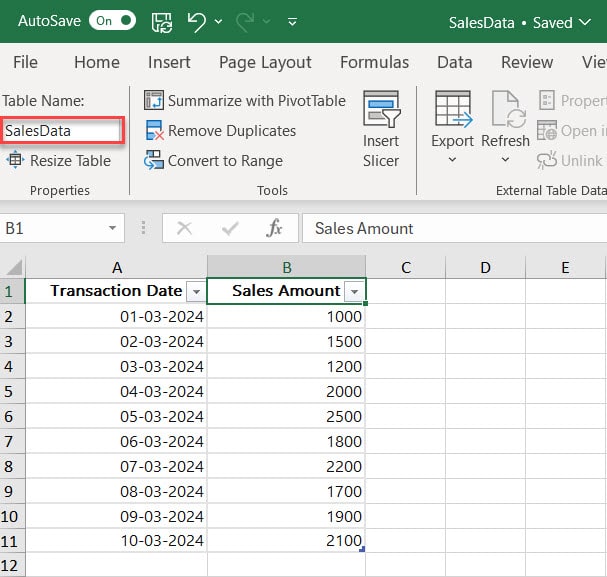
You have a dataset containing the dates of sales transactions and the corresponding sales amounts.
You want to analyze your sales performance based on weekdays to identify which days are the busiest for your store.
According to this scenario, we have an Excel file named SalesData with columns Transaction Date, Sales Amount. Check the screenshot below
Now follow the below steps to use the weekday function in Power BI:
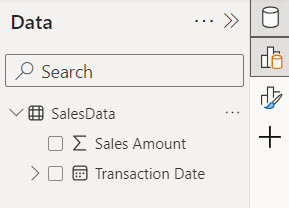
1. Open Power BI Desktop and load data using the Get data option. Then, you can see data in the Data pane.
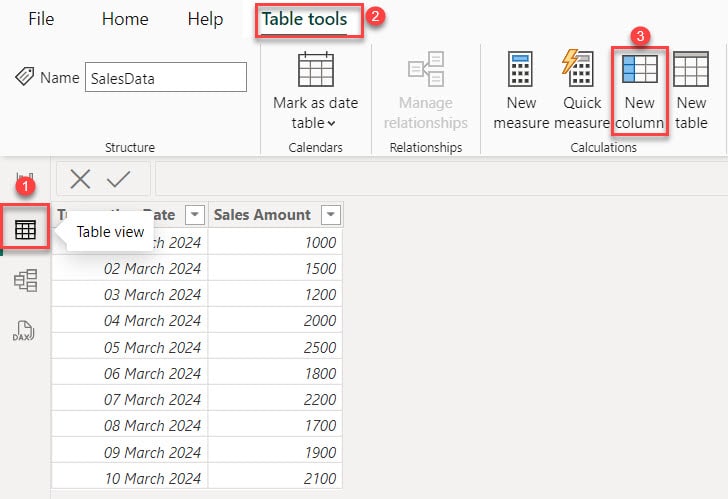
2. Now Go to Table view -> Under the “Table tools” tab, click New column.
3. In the formula bar, put the below DAX expression. Then click the Commit button.
Weekday Number = WEEKDAY('SalesData'[Transaction Date],1)Where:
- Weekday Number = This is the name we’re giving to the new column that will contain the weekday numbers.
- WEEKDAY() = This is the DAX function we’re using. It calculates the weekday number for a given date.
- ‘SalesData'[Transaction Date] = This refers to the Transaction Date column in the SalesData table.
- 1 = This specifies Sunday as the starting day of the week. (1 indicates that Sunday is the first day of the week, and weekday numbers will be assigned accordingly).

4. You see the Weekday Number created in the Table view.
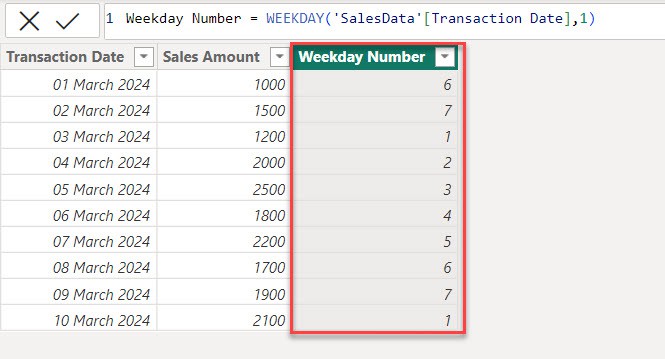
This method lets you get the weekday for any given date column in Power BI.
How to Use WEEKDAY Function in Power BI Visualization
This example shows how to use the weekday function in Power BI Visualization.
1. Go to the Report view. Under the Home tab, expand the Visual gallery(black box) -> Click the Stacked column chart.

2. Using the +Add data option, add Weekday Number into the X-axis and Sales Amount into the Y-axis.
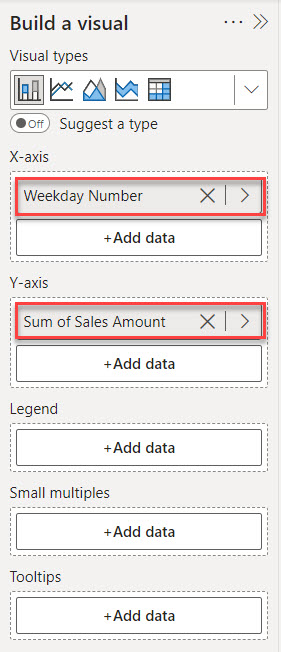
3. Now, you can see a chart in the report canvas.
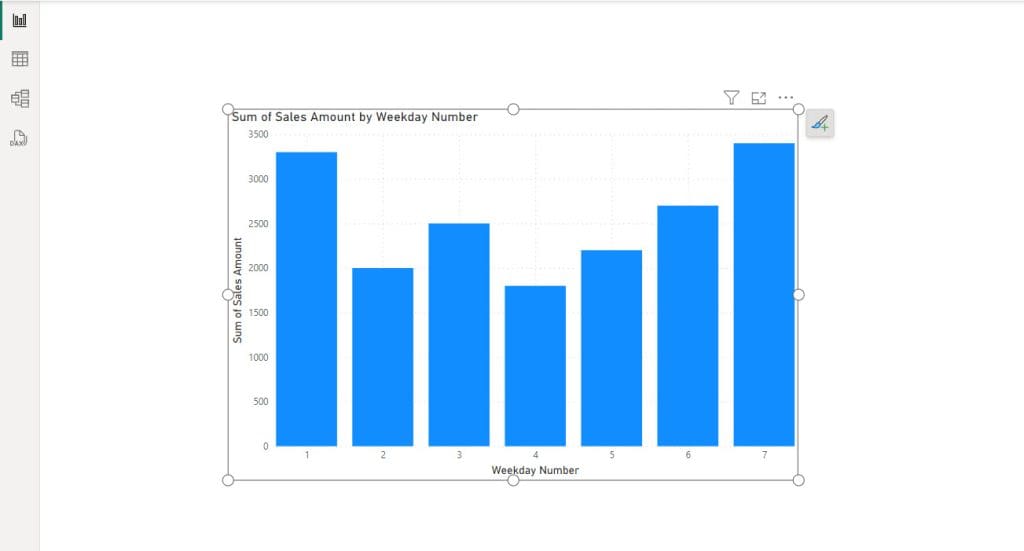
The visualizations show that sales are consistently higher on weekends (1 for Sunday, 7 for Saturday) than on weekdays.
With this insight, you might run special weekly promotions or discounts to attract more customers during lass sales.
In this scenario, the WEEKDAY function in Power BI helps you understand your sales patterns based on weekdays, allowing you to make informed business decisions to improve performance.
This tutorial taught us about the Power BI Weekday function and how to use it in Power BI visualizations.
Furthermore, you may like some more Power BI articles:
I am Bijay a Microsoft MVP (10 times – My MVP Profile) in SharePoint and have more than 17 years of expertise in SharePoint Online Office 365, SharePoint subscription edition, and SharePoint 2019/2016/2013. Currently working in my own venture TSInfo Technologies a SharePoint development, consulting, and training company. I also run the popular SharePoint website EnjoySharePoint.com