In this Power BI article, we will learn what is What if Parameter in Power BI is and how to add the What if Parameter to the Power BI report.
What if Parameter Power BI
- We can easily analyze data using the what-if parameter in Power Bi. It displays dynamically the value based on the condition applied for different scenarios.
- For example, we can easily check what if sales increased by 10% using the what-if parameter in Power Bi.
Add What if Parameter in Power BI
Let us see how we can add or create a What-if parameter in the Power Bi report.
In this example, we are going to use the sales table data, to add the what-if parameter slicer visuals in Power Bi.
- Open the Power Bi desktop, and load the data into it using the get data option. Once the data has been loaded, select the clustered column chart and drag and drop the customer location and sales field values in it as below:
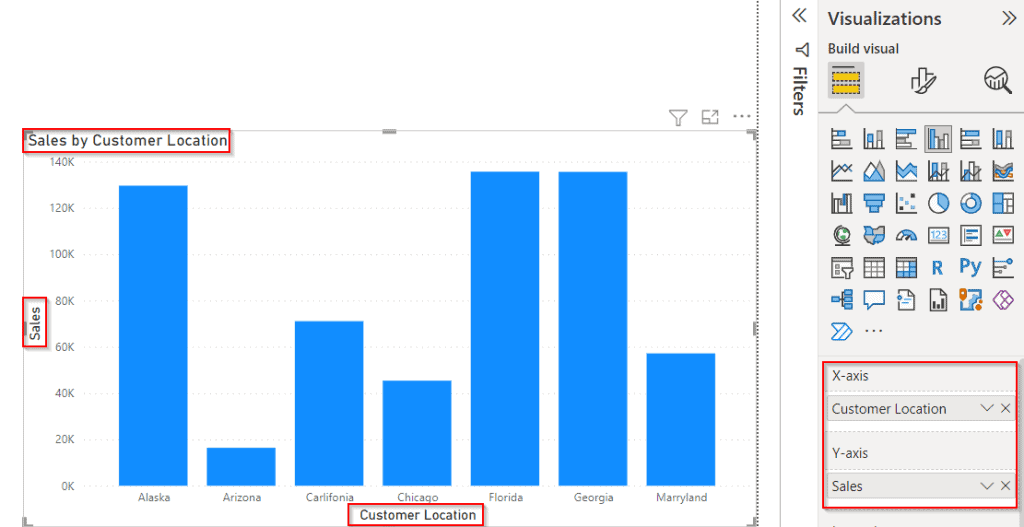
- Now Click the Modeling tab in the top ribbon and select the What IF parameter as highlighted below:

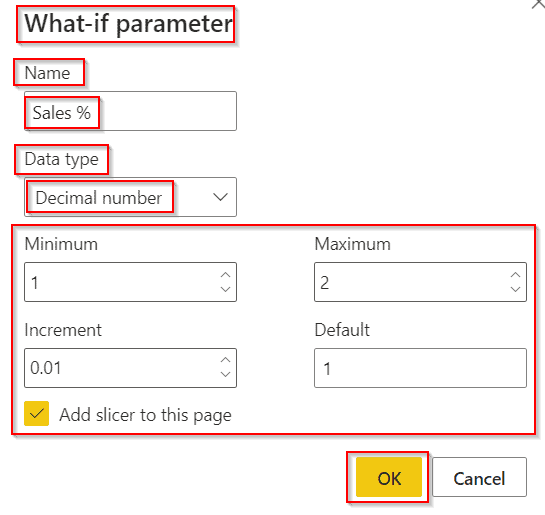
- A What if parameter pop window appears, In the Name section we can enter the parameter name, here the parameter name is Sales%.
- In the Data type, we can select the data type as a whole number, decimal number, and fixed decimal number.
- We can also set Minimum value, Maximum value, Increment, and Default value, and to save the What-if parameter clicks on the ok button below:
- Under the Fields pane, we can see that the Parameter has been created as a New Table
- Once the parameter has been created. It automatically creates two measure values for the generated series and for the selected value
For generated series:
Sales % = GENERATESERIES(1, 2, 0.01)For Selected Value:
Sales % Value = SELECTEDVALUE('Sales %'[Sales %], 1)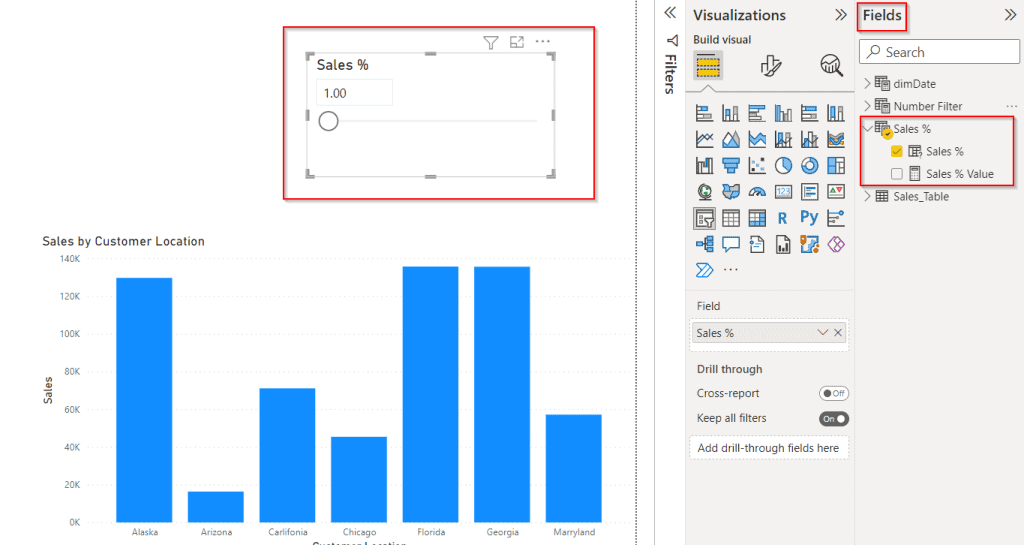
- Now we can apply the parameter to calculate the percentage of the total sales, create a new measure and apply the below-mentioned formula:
Total Sales % = Sales_Table[totalsales] * 'Sales %'[Sales % Value] Where,
- Total Sales % = New measure name
- Sales_Table = Table Name
- Sales %'[Sales % Value] = Parameter Value
- Now simply drag and drop the created measure value in the clustered column chart. The screenshot below displays the sales and total sales value as the same.
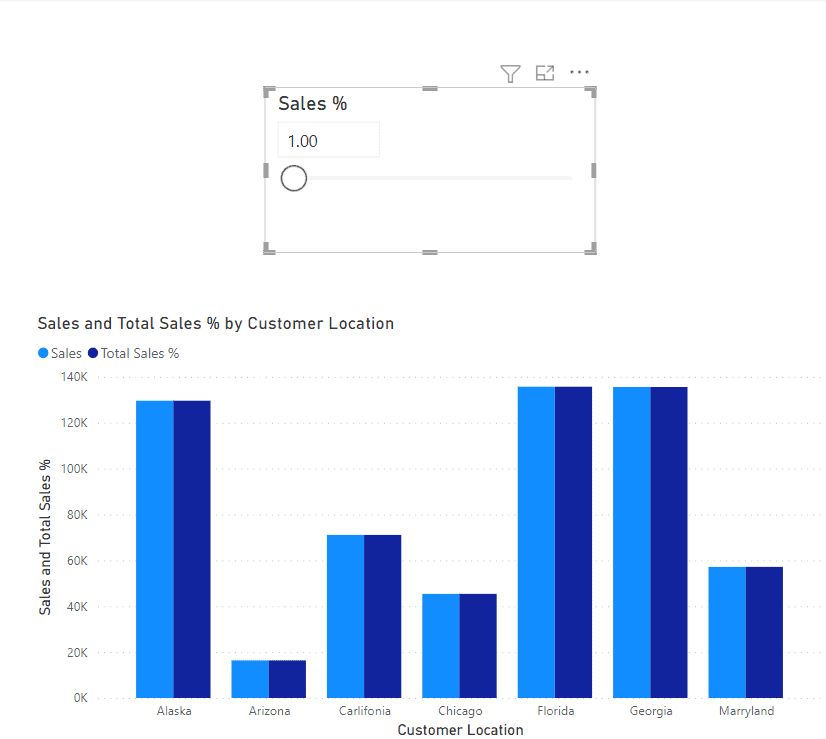
When we change or slide the Parameter slicer value, the clustered column chart displays the total sales value according to the selection.
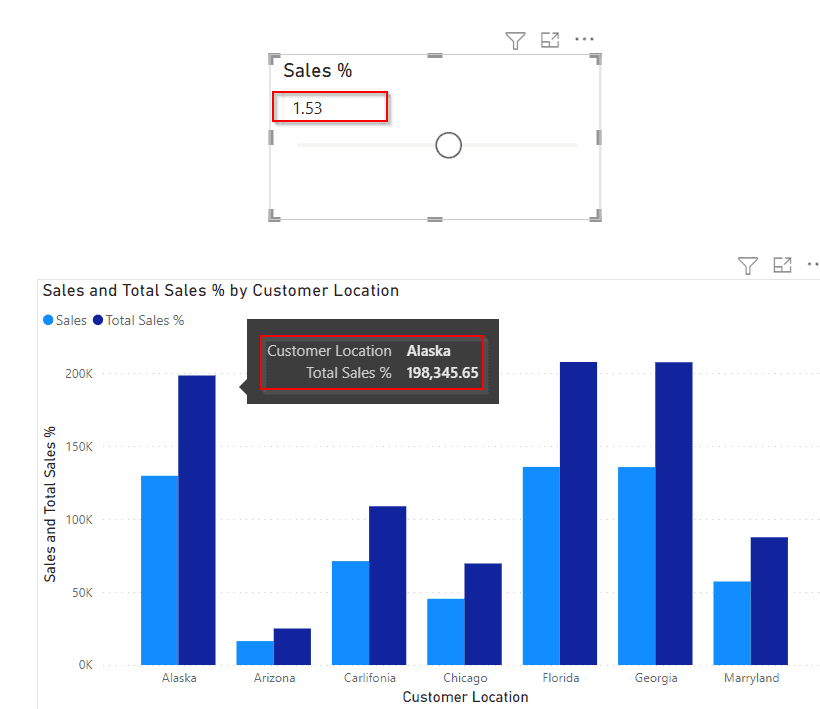
This is how we can add or create a What-if parameter in the Power Bi report.
Also, read Power BI what if Parameter Percentage
Power BI what if the parameter in a calculated column
- No, the Calculated column doesn’t support the What if Parameter in Power Bi. we cannot filter the values dynamically in the calculated column using the What if Parameter.
- Because Power Bi What if parameter supports and filters the values dynamically only on the Power Bi DAX measures. So we can replace the Calculated column with the Power Bi measures and use the What if Parameter.
What if Parameter Power Bi Text
- No, it is not possible to input the string data type into the Power Bi text using the What if Parameter.
- In the Power BI What-if parameter, we can select the data type as a whole number, decimal number, and fixed decimal number. and not the string data type to input the string value.
This Power BI article demonstrated what is What if Parameter is and how to add the What if Parameter to the Power BI report.
You may like the following Power BI tutorials:
- What if parameter Power BI Date
- What if Parameter in Power BI filter
- How to sort slicer by measure in Power BI
I am Bijay a Microsoft MVP (10 times – My MVP Profile) in SharePoint and have more than 17 years of expertise in SharePoint Online Office 365, SharePoint subscription edition, and SharePoint 2019/2016/2013. Currently working in my own venture TSInfo Technologies a SharePoint development, consulting, and training company. I also run the popular SharePoint website EnjoySharePoint.com