Do you know what is a SharePoint Gantt Chart and how to create it? No problem!
In this SharePoint tutorial, we will explore Gantt Chart View in SharePoint and the benefits of using Gantt Charts in Project Management.
Also, I will tell you how to create a Gantt chart in SharePoint step by step.
What is a SharePoint Gantt Chart?
SharePoint Gantt chart visually represents a project’s timeline, showing tasks as horizontal bars that span their start and end dates. It helps users see the duration and sequence of tasks in a project directly within SharePoint.
Tasks are represented as bars, with the length of the bar representing the task’s time.
The SharePoint Task List frequently uses a Gantt chart to visually depict tasks and their timelines.
SharePoint provides built-in Gantt chart views for task lists to help project managers visualize and manage project timelines.
The screenshot below represents what a SharePoint Gantt Chart View looks like:

Benefits of Using Gantt Chart in SharePoint
The table below represents all the benefits of the SharePoint Gantt chart.
| Benefit | Description |
|---|---|
| Visual Timeline | It provides a clear visual of the project’s timeline, making it easier to understand task durations and overlaps. |
| Task Dependencies | It allows visualization of task relationships, showing which tasks must be completed before others start. |
| Integrated with SharePoint | No need for additional tools, as it’s built directly into SharePoint, allowing seamless integration with other SharePoint functionalities. |
| Collaboration | Team members can collaborate in real time, with changes immediately reflected on the chart. |
| Customizable Views | This allows customization of what data is displayed, tailoring it to specific project needs. |
| Track Progress | It also helps monitor task status and overall project progress at a glance. |
| Enhanced Decision Making | Visual representation helps faster decision-making, as managers can quickly spot delays or overlaps. |
These are the SharePoint Gantt chart benefits.
How to Create a Gantt Chart View in SharePoint
Now, we will see how to create a Gantt chart view in SharePoint step by step:
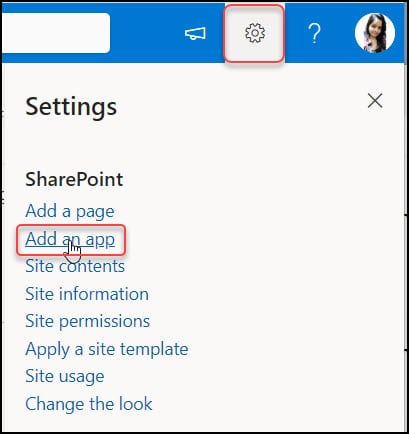
1. Navigate to your SharePoint site. Go to the Gear or Settings icon [from the top right corner] -> Click on Add an app.
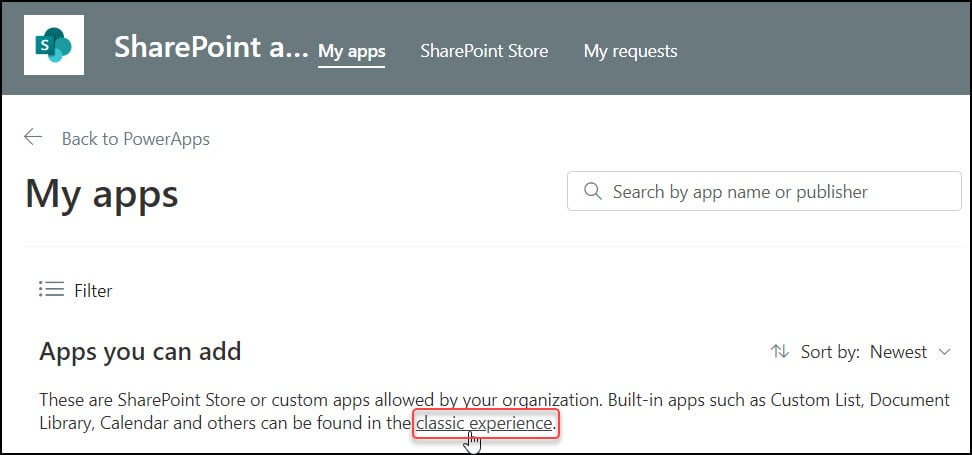
2. Under the “Apps you can add” section, click on the classic experience as shown below.
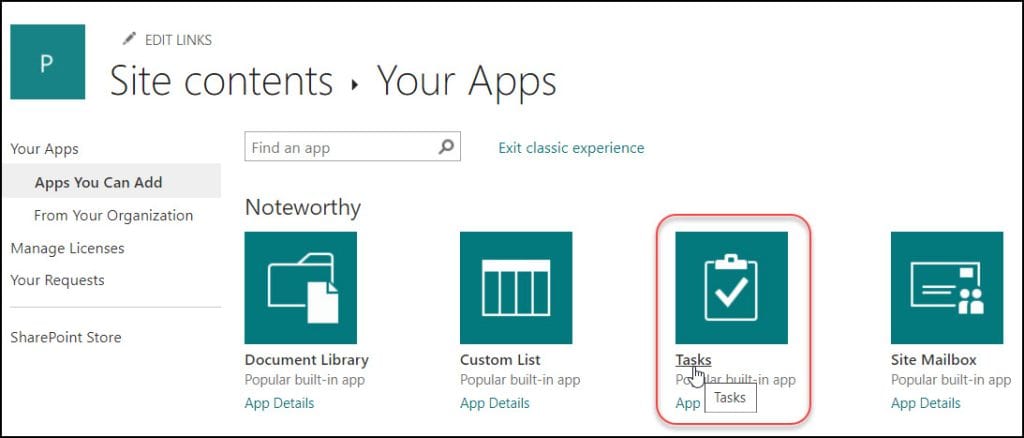
3. In the Your Apps window, select the Tasks app. Many columns for a Gantt chart (Start Date, Due Date, etc.) are already set up in this list type. Also, you can use any existing Tasks list.
4. Provide a unique name to the Task list. Click on Create.

5. The new task list has been created and will show you under the Site contents page.

6. By default, the task list has been created with the columns below:
- Task Name
- Due Date
- Assigned To
- Start Date and so on
NOTE:
Make sure your list has a “Title,” “Start Date,” and “Due Date” column at the very least. You can add relevant columns like “% Complete” or “Assigned To.”
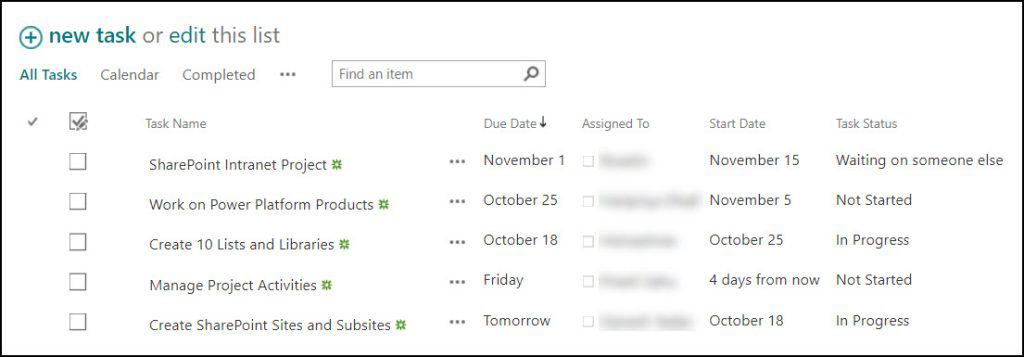
Also, I have added some records to the SharePoint task list, like below.
7. Now, we will create the SharePoint Gantt Chart View using this SharePoint Task list. To do so, click Create View in the List tab.
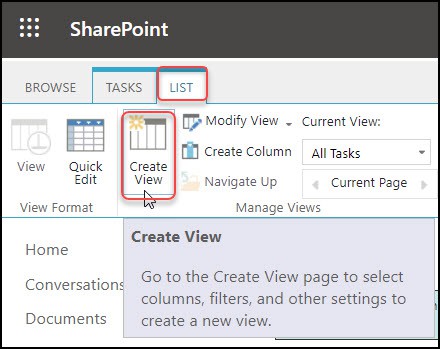
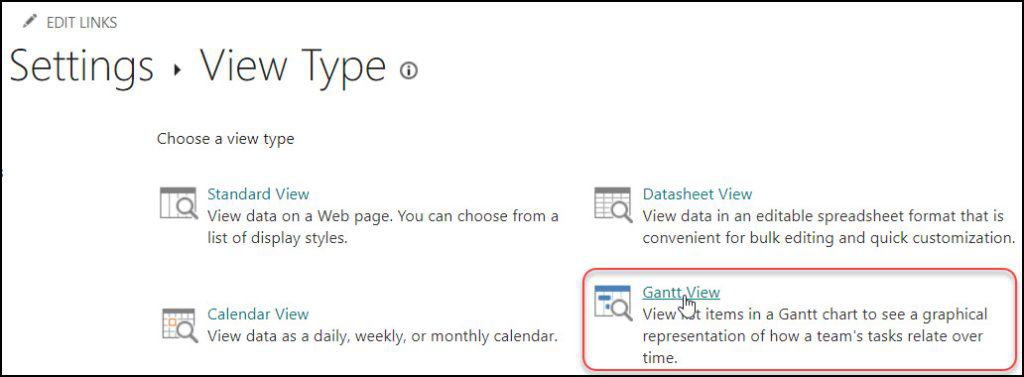
8. In the View Type window, select Gantt View.
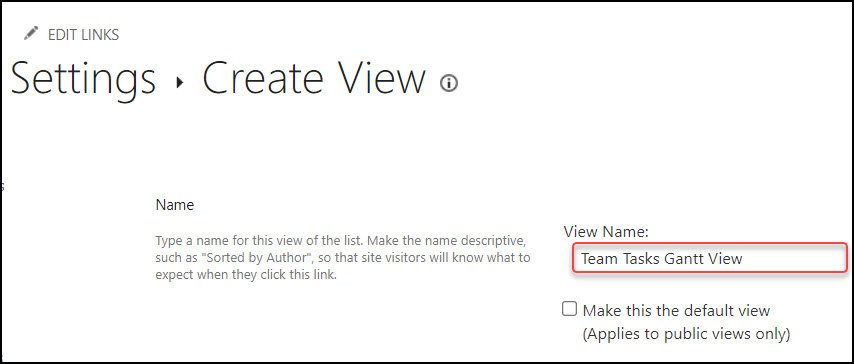
9. In the Create View page, Provide the Gantt View Name.
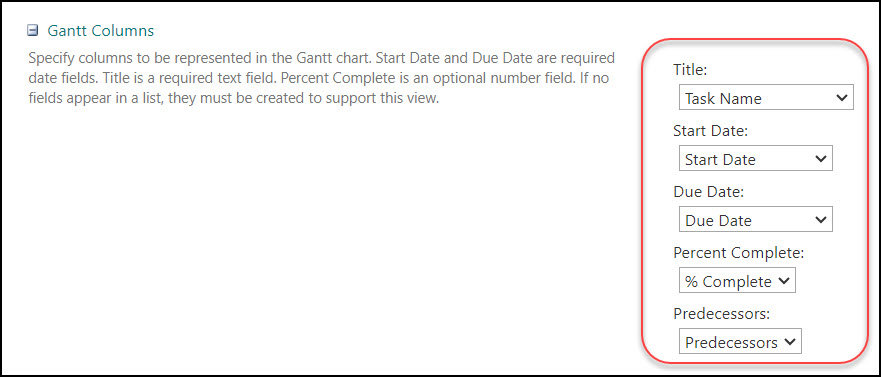
10. In the Gantt Columns section, provide the below details:
| Field | Value |
|---|---|
| Title | Task Name |
| Start Date | Start Name |
| Due Date | Due Date |
| Percent Complete | % Complete |
| Predecessors | Predecessors |
Refer to the image below.
11. Once everything is done, click on OK. Now you can see the SharePoint Task list view [Team Tasks Gantt View] will appear like below:

12. To get the SharePoint Gantt view, click on ellipses (…) -> Select the Gantt view [Team Tasks Gantt View] as shown below.
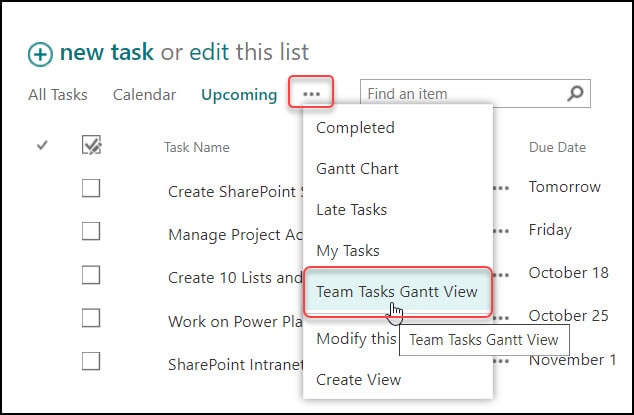
In this way, we can create a Gantt Chart view in SharePoint.
Conclusion
In this SharePoint tutorial, we looked at the Gantt Chart View in SharePoint and the advantages of utilizing Gantt Charts for project management. Additionally, I covered how to create a Gantt chart view in SharePoint.
You may also like:
- SharePoint Online quick chart web part
- Create a Board View in a SharePoint Online List
- SharePoint List View Filter By Current User Email
Hello Everyone!! I am Bhawana a SharePoint MVP and having about 10+ years of SharePoint experience as well as in .Net technologies. I have worked in all the versions of SharePoint from wss to Office 365. I have good exposure in Customization and Migration using Nintex, Metalogix tools. Now exploring more in SharePoint 2016 🙂 Hope here I can contribute and share my knowledge to the fullest. As I believe “There is no wealth like knowledge and no poverty like ignorance”
It should be noted that this is for classic Sharepoint, and gantt views are not supported in modern Sharepoint Lists. They can be created in the settings page, and viewed using the generated URL, but you cannot use the view switcher to get to them and they cannot be added to Teams as a Lists tab.