In this Power BI Tutorial, we will learn What is Power BI Row-level Security (RLS) and what are the different types of Row-level security in Power BI. We will also see, how to implement row level security in Power BI.
In addition, we will also learn how to implement Static Row-level security and Dynamic Row level security in Power BI with various examples. Moreover, we will also cover the below headings:
- Power BI Row-level Security Static Example
- Power BI Row-level Security multiple values
- Power BI Row-level Security based on username
- Power BI Row-level Security based on email
- Power BI Row-level Security Dynamic Example
- Power BI Row-level Security not working
What is Power BI Row-level security?
- Row-level security (RLS) is used to restrict data access for the users. Filters are used to restrict data access at the row level. And within the roles, we can apply filters.
- Members of the Power Bi workspace can access the data sets in the Power Bi service, RLS doesn’t restrict this data access.
- There are two types of Row-level Security in Power Bi, They are, Static Row-level Security and Dynamic Row level security in Power BI.
- When we publish the Power Bi reports, it also publishes the row-level security role definitions.
In the following, we will see how to create row-level security in Power BI. In this complete tutorial, we will use the financials excel sheet as source data.
Power BI Row-level Security Static Example
Here we will see how we can create static row-level security and define roles in the Power Bi desktop.
To achieve this follow the below steps:
Step :1
- Log in to the Power Bi desktop and use the get data option to load data. To create Row Level Security, go to the Modeling tab and click Manage roles in the security section as below:

Step:2
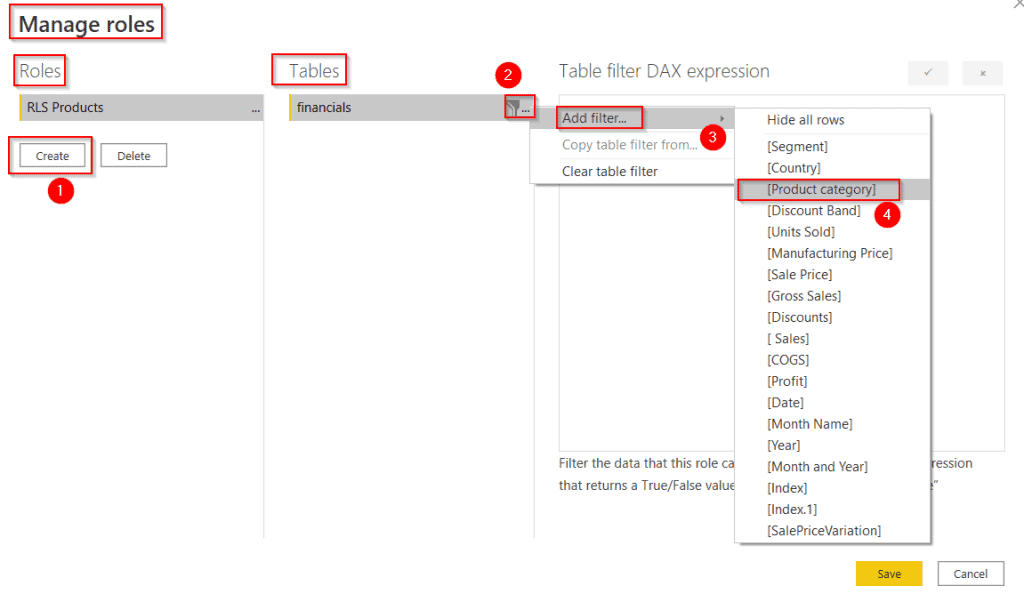
- In the Manage roles pop-up window, under the roles section, Click on the create option to Create a new role and name it.
- In the Table section, Select the ellipsis icon -> Add filter -> choose the column name under the table section, here I have selected the Product category field as highlighted below:
Step :3
Write the below Dax in the Table filter DAX expression and click on the check icon to verify the Dax expression and save button as displayed below:
[Product category] IN {"VTT","Velo"}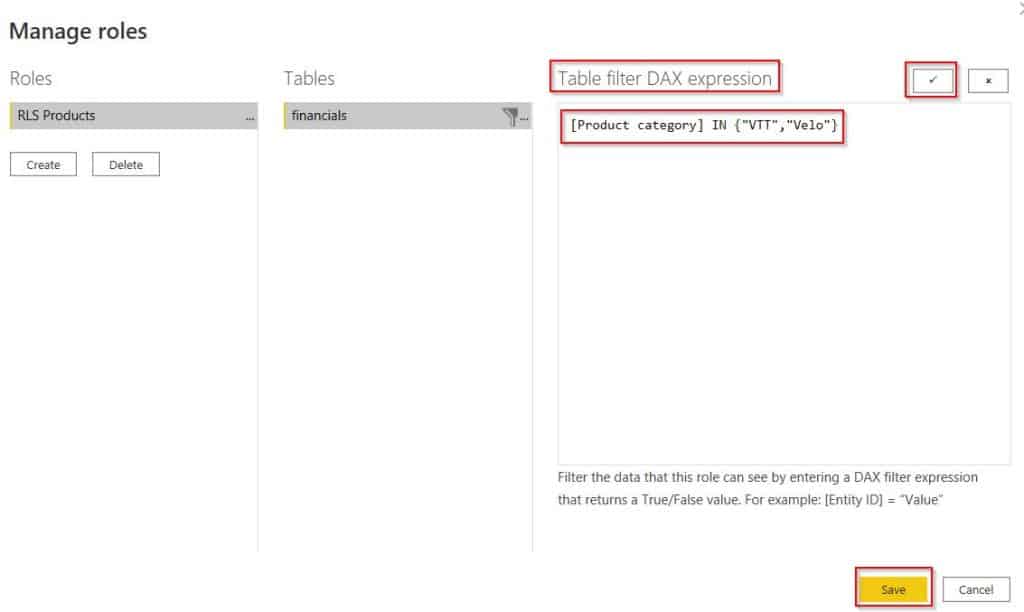
Step:4
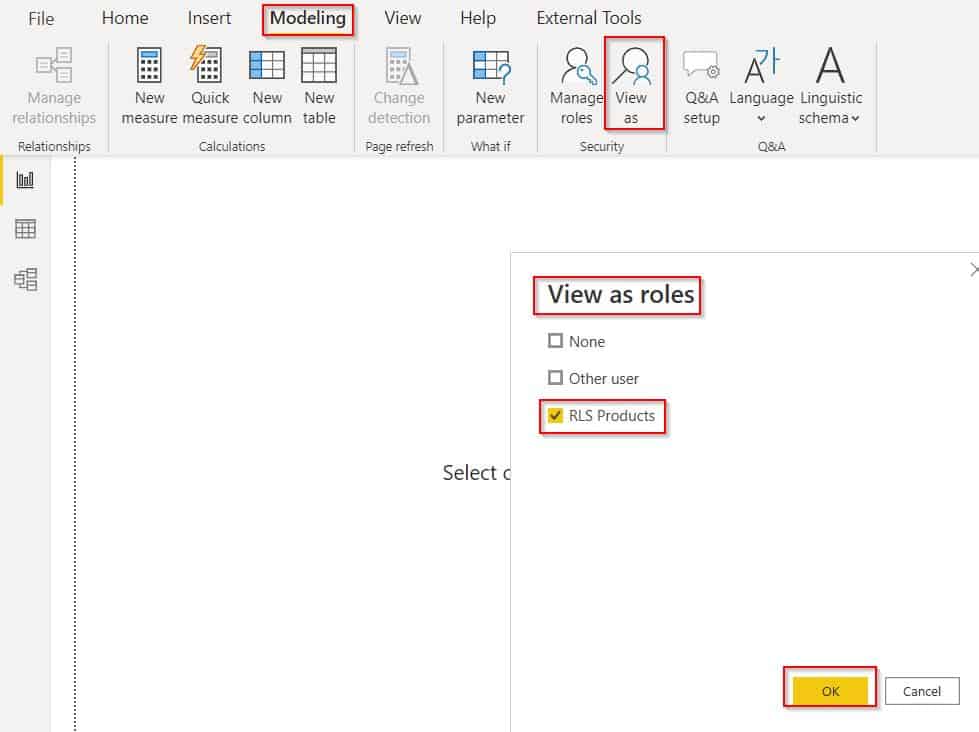
- To test the created row-level security role, go to the Modeling tab and click the View as an option. Click the Role name and then click OK.
- Here the Role Name is RLS Products, select and click on the Ok button.
Step:5
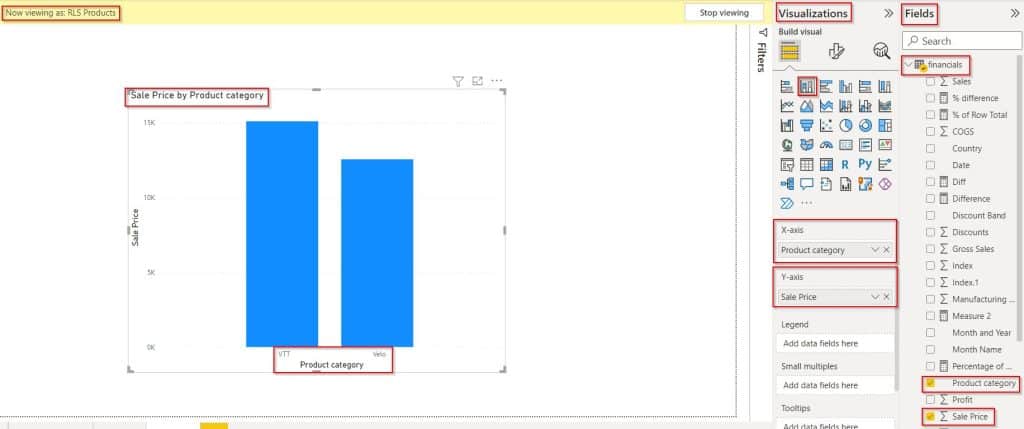
- Select the Stacked column chart visual from the visualization to the Power Bi reports canvas.
- Now drag and drop the Product category field to the x-axis field section and the sale price to the y-axis.
- In the below screenshot, we can see that the stacked column chart visually displays the products mentioned in the DAX expression for the selected role and restricted the remaining products using row-level security.
This is how to create row-level security and define roles in the Power Bi desktop.
Read Calculate Percentage of Rows in Power BI
Power BI Row-level Security multiple values
Let us see how we can display the multiple values in the row-level security in Power Bi
Yes, it is possible to view the row-level security with multiple values in Power BI, In this example, we will apply row-level security with multiple values for three different countries,(Canada, Mexico, and Germany).
- Load data into the desktop, create Row Level Security, go to the Modeling tab -> Manage roles
- In the Manage roles pop-up window, select the create option to Create a new role and name the role.
- In the Table section, Select the ellipsis icon -> Add filter -> choose the column name under the table section, here I have selected the Country field.
- Apply the below Dax in the Table filter DAX expression and click on the check icon to verify the Dax expression and save button as shown below:
[Country] IN {"Canada","Mexico","Germany"}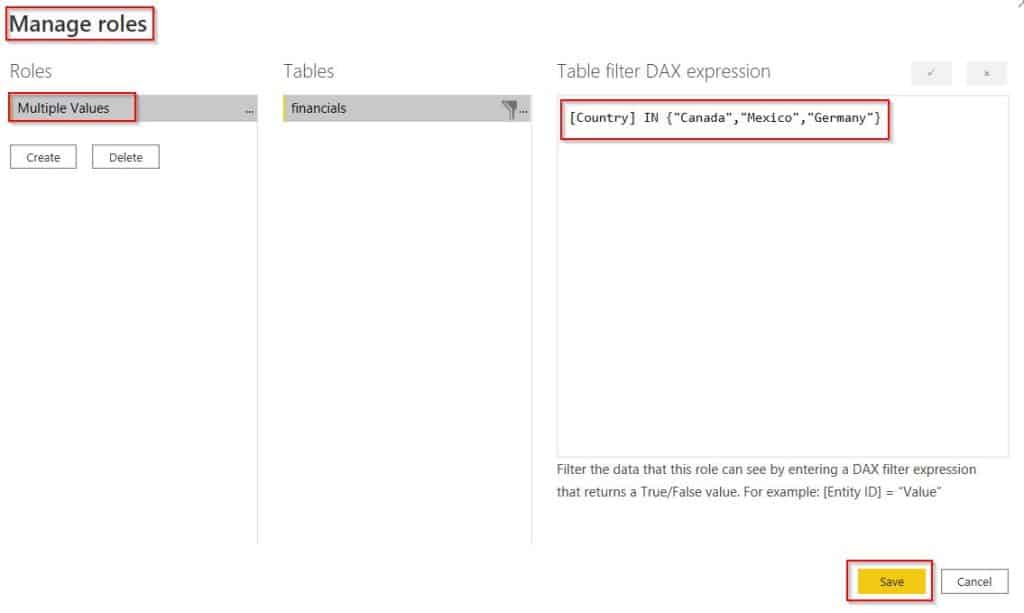
- Now in the Power Bi report view, select the Donut chart visual from the visualization and drag-drop the country and sales field.
- The screenshot below displays the sales value by country in the donut chart visual in Power BI.
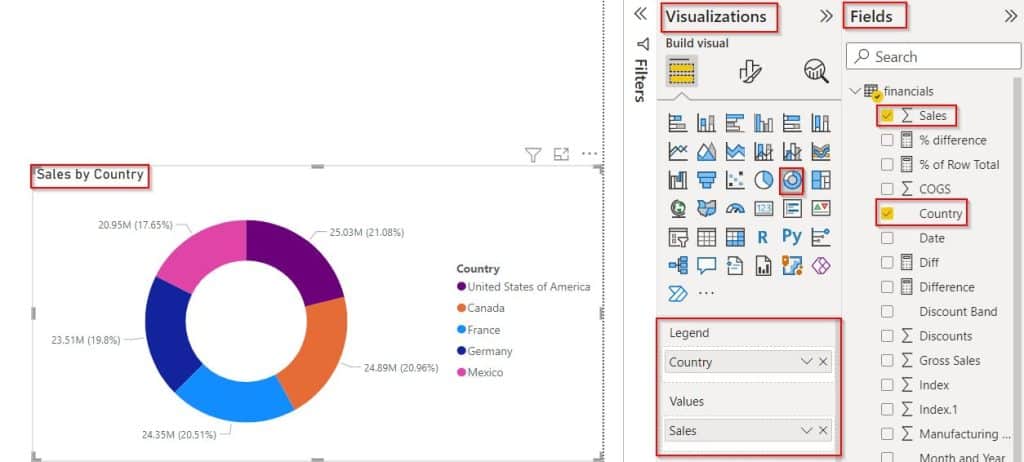
- To check the created row-level security role, select the Modeling tab and click the View as an option, Select the created role name and click on the ok button. In this case, the created role name is Multiples Values.
- In the below screenshot, you can see that the donut chart visually displays the multiple values based on the selected role, and the remaining countries are restricted by the row level of security.
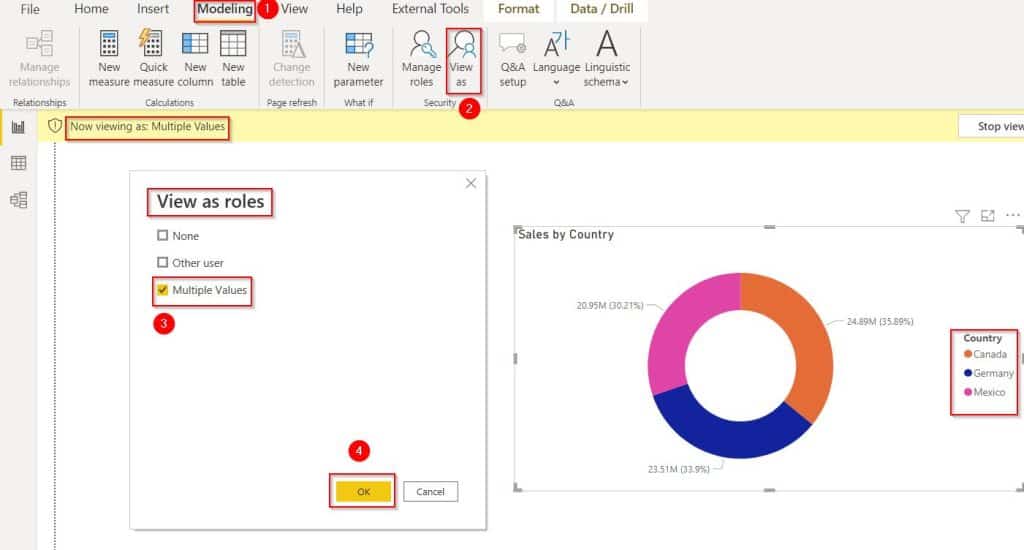
This is how to display the multiple values in the row-level security in Power Bi.
Read Object Level Security (OLS) in Power BI
Power BI Row-level Security based on username
Here we will see how we can use the Row level of security based on the user name in the Power BI desktop.
In this example, we use two tables called financials and Sales Rep, and we will use the UserName to restrict the row level security in the Power Bi desktop.
Table 1:
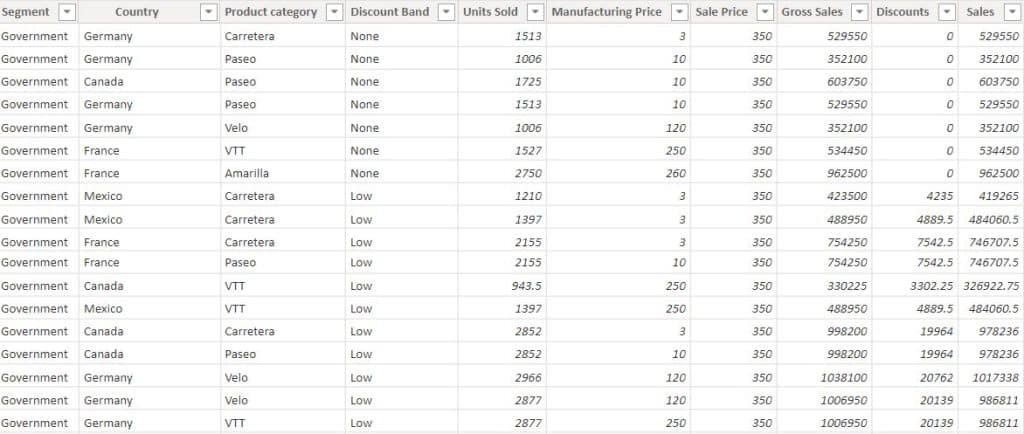
Table 2:

Follow the below steps to achieve this:
Step :1
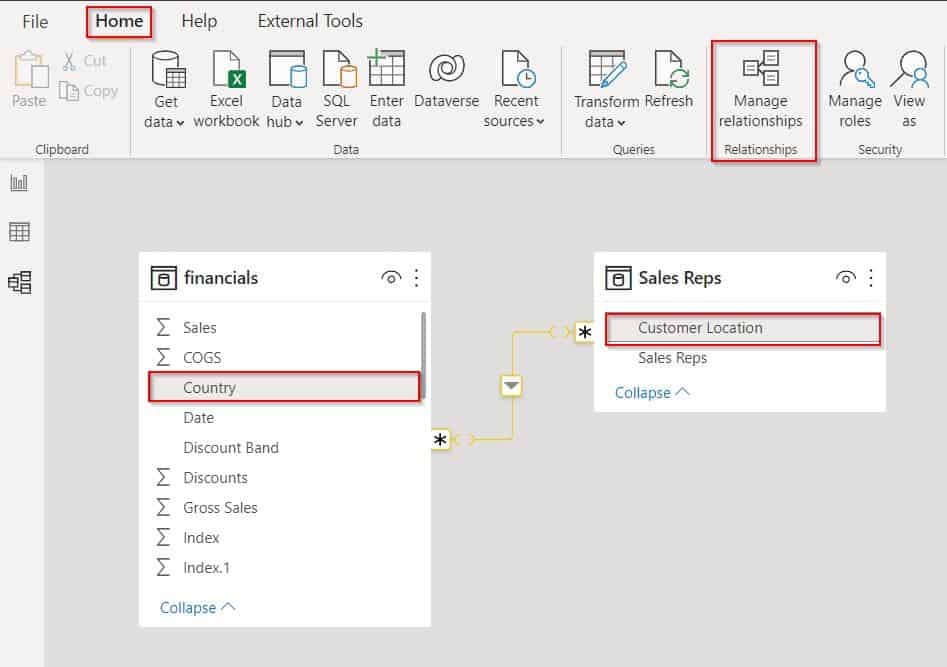
- Load data into the power bi desktop, Click on the Model view to create a relationship between two tables.
- Select Home tab – > Manage relationship and simply drag and drop the customer location and country fields and create a many-to-many relationship as shown below:
Step 2:
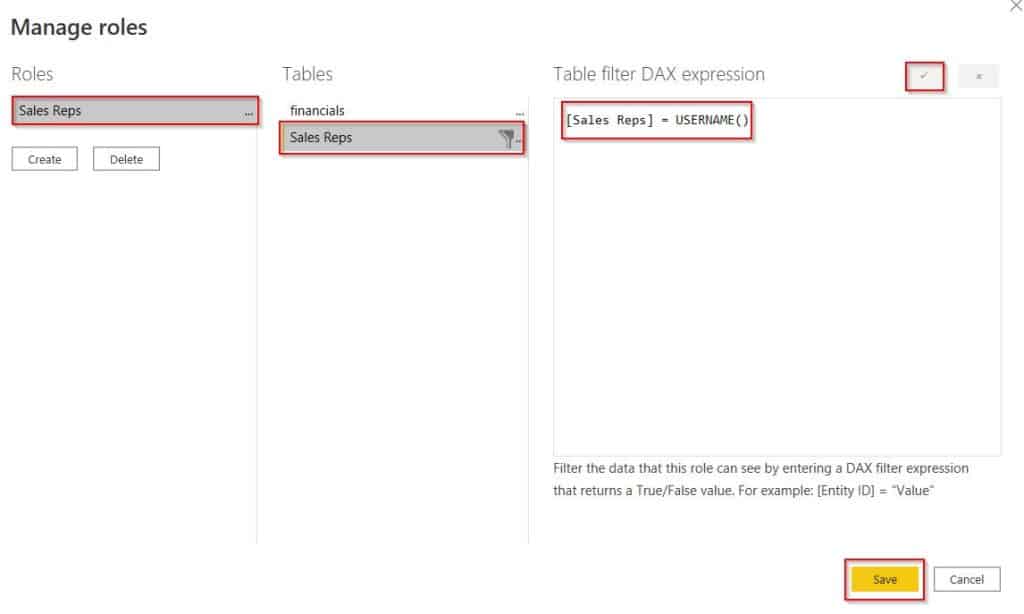
- Now go to the modeling tab -> Click on Manage Roles -> Click on Create to create a role called Sales reps.
- Under tables Add filter on the Sales Reps table and select column Sales reps.
- Under the Table filter and apply the below-mentioned DAX formula:
[Sales Reps] = USERNAME()Where,
USERNAME() = Username function returns the windows account name.
Step:3
- To check the UserName, select the New measure from the ribbon and apply the below formula.
UserName Measure = USERNAME()- Select the card visually, and drag and drop the created measure value, So that we can able to check the local system Windows account name.
- And also we have to make sure, that the sales reps column has the windows account name presented in the sales reps data table so that we can able to restrict the row-level security in the Power Bi desktop.

Step:4
- Now in the Power Bi report view, select the Donut chart visual from the visualization and drag-drop the country and sales field.
- The screenshot below displays the sales value by country in the donut chart visual in Power BI.

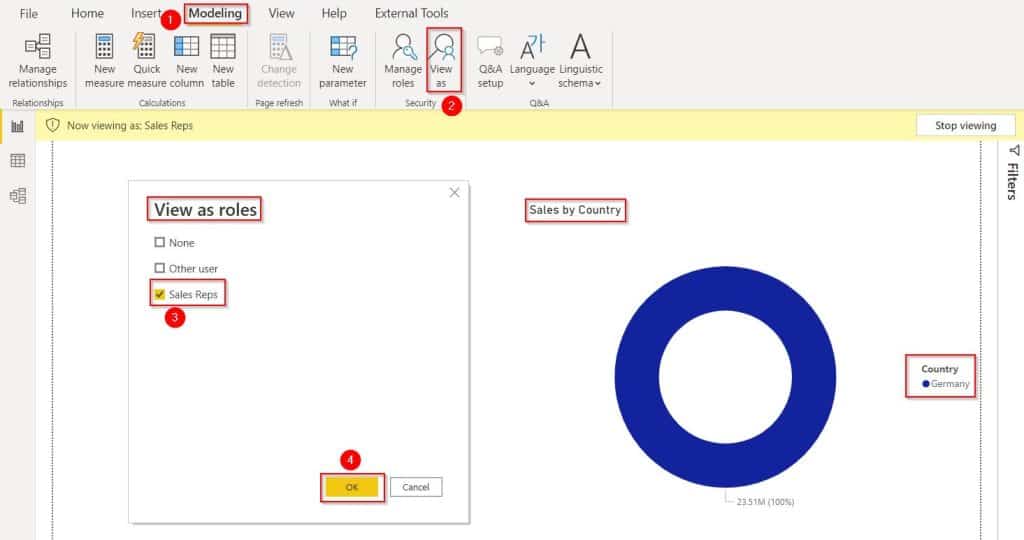
- Select the Modeling tab and click View as an option, Select the created role name Sales Reps. and click the ok button.
- The Screenshot below displays the donut chart visual based on the selected role that matches the windows account name and the remaining countries are restricted by the row level of security.
This is how to use the Row level of security based on the user name in the Power BI desktop.
Read Calculate Percentage of Two Columns in Power BI
Power BI Row-level Security based on email
Let us see how we can use the Row level of security based on email in the Power Bi desktop,
In this example, we will restrict the row-level security based on email, in this scenario, I have already created a power bi report that displays the sales by country.
Follow the below steps to apply row-level security based on email in the Power Bi desktop.
- Load data into the desktop, to create Row Level Security, go to the Modeling tab -> Manage roles.
- In the Manage roles pop-up window, select the create option to Create a new role and name the role.
- In the Table section, Select the ellipsis icon -> Add filter -> choose the column name under the table section, here I have selected the Sales Reps column field.
- Apply the below Dax in the Table filter DAX expression and click on the check icon to verify the Dax expression and save button as shown below:
[Sales Reps] = USERNAME()
- Now in the Power Bi report view, select the Donut chart visual from the visualization and drag-drop the country and sales field.
- The screenshot below displays the sales value by country in the donut chart visual in Power BI.

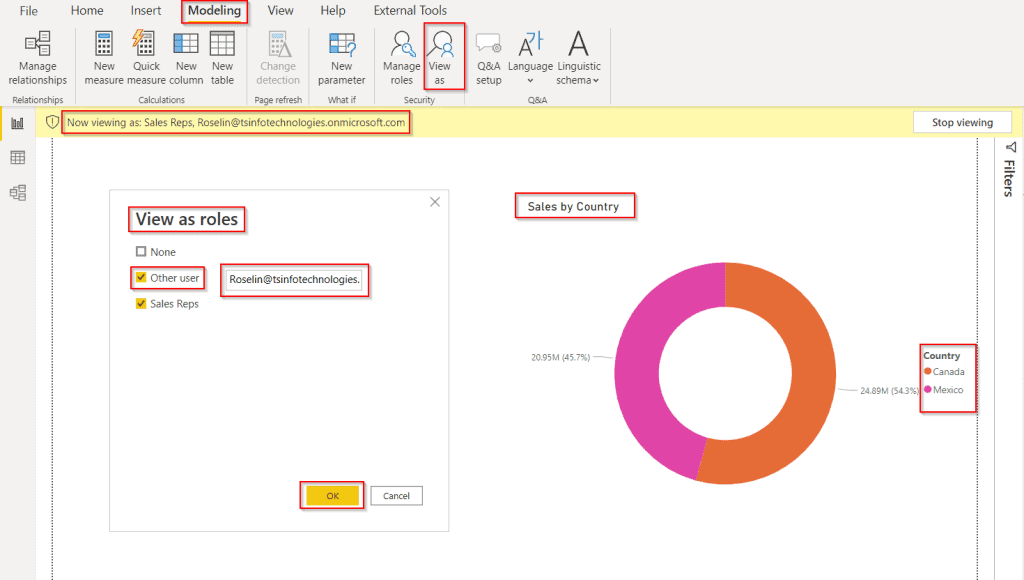
- To check the created row-level security role, select the Modeling tab and click the View as an option, Select the other users and enter the email account and click on the ok button.
- Now In the below screenshot, you can see the report based on the role and email. Then click on Stop viewing.
This is how to use the Row level of security based on email in the Power Bi desktop.
Power BI Row-level Security not working
- No, Row level of security (RLS) works both in Power Bi Desktop and Power BI Service.
- Using Dynamic Row Level Security, we can match the login names with the DAX UserName() and UserPrincipalName().
- For example, you can follow the below-mentioned heading to work with the Row level of Security in Power Bi.
Power BI Row-level Security Dynamic Example
Let us see how we can create and dynamically implement row-level security and define roles in the Power Bi desktop and Power Bi service.
- In Power BI Desktop -> USERNAME()and USERPRINCIPALNAME() returns the logged-in local system Windows account name.
- In Power BI Service-> USERNAME()and USERPRINCIPALNAME() returns the signed-in user account name.
To achieve this follow the below steps:
Step :1
- Log in to the Power Bi desktop and use the get data option to load data. To create Row Level Security, go to the Modeling tab and click Manage roles in the security section.
- A Manage roles pop-up window appears, under the roles section, Click on the create option to Create a new role and name it.
- In the Table section, Select the ellipsis icon -> Add filter -> choose the column name under the table section, here I have selected the Sales Reps field as highlighted below:
- Under the Table filter and apply the below-mentioned DAX formula:
[Sales Reps] = USERPRINCIPALNAME()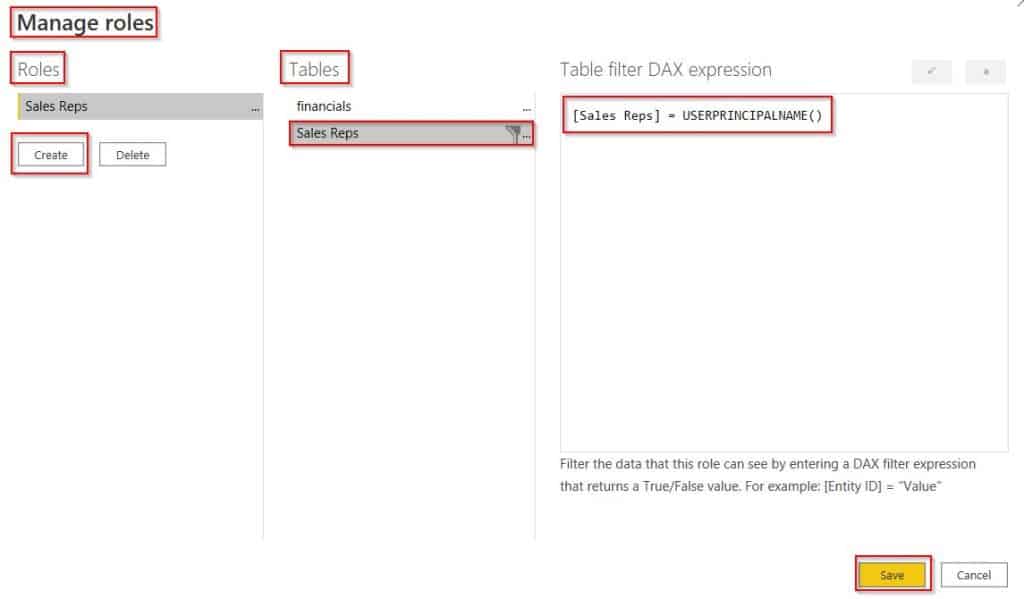
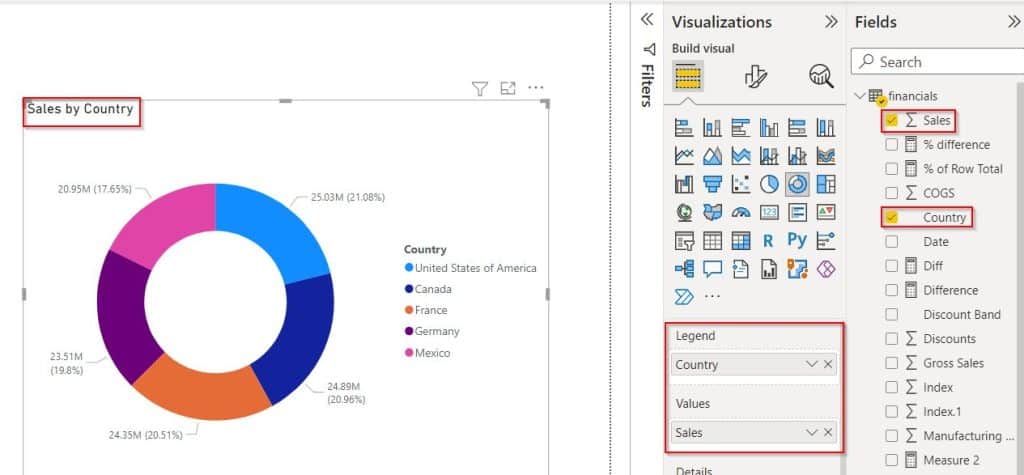
- Select the Donut chart visual from the visualization and drag-drop the country and sales field.
- The screenshot below displays the sales value by country in the donut chart visual in Power BI report canvas.
Check the Row level security in the Power BI Desktop :
- Select the Modeling tab and click View as an option, Select the created role name Sales Reps. and click the ok button.
- The Screenshot below displays the donut chart visual based on the selected role that matches the windows account name and the remaining countries are restricted by the row level of security in the Power Bi desktop.
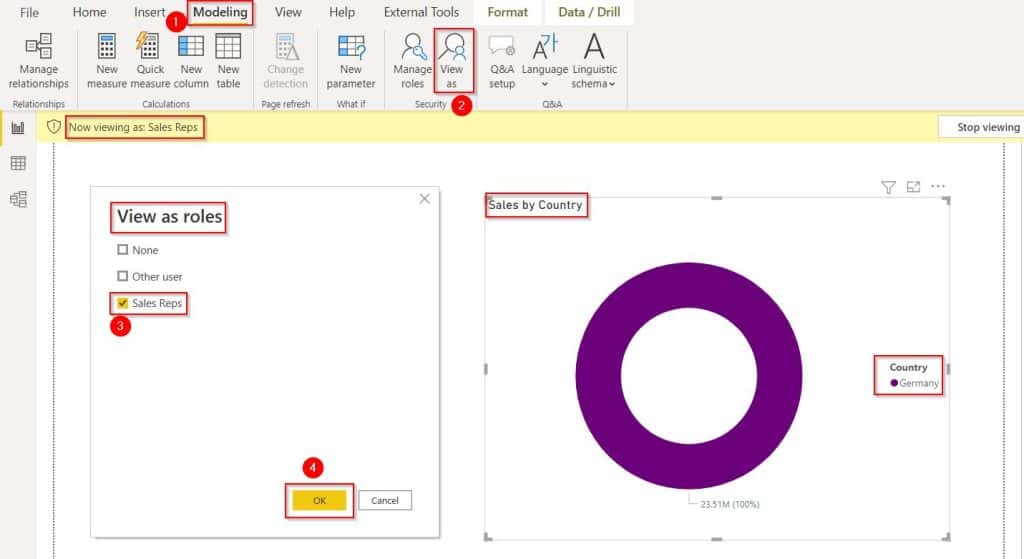
This is how USERPRINCIPALNAME() returns the logged-in local system Windows account name in the Power Bi desktop.
Check the Row level security in the Power BI Service:
- Now go to the Home page, then click on Publish, to Publish the generated Power Bi report to the Power BI Service as shown below:

- After publishing the report, Login to the Power bi service. Then click on the My workspace and choose the published Power Bi report’s dataset.
- Click on the ellipsis icon for more options and Select the security option as highlighted below:
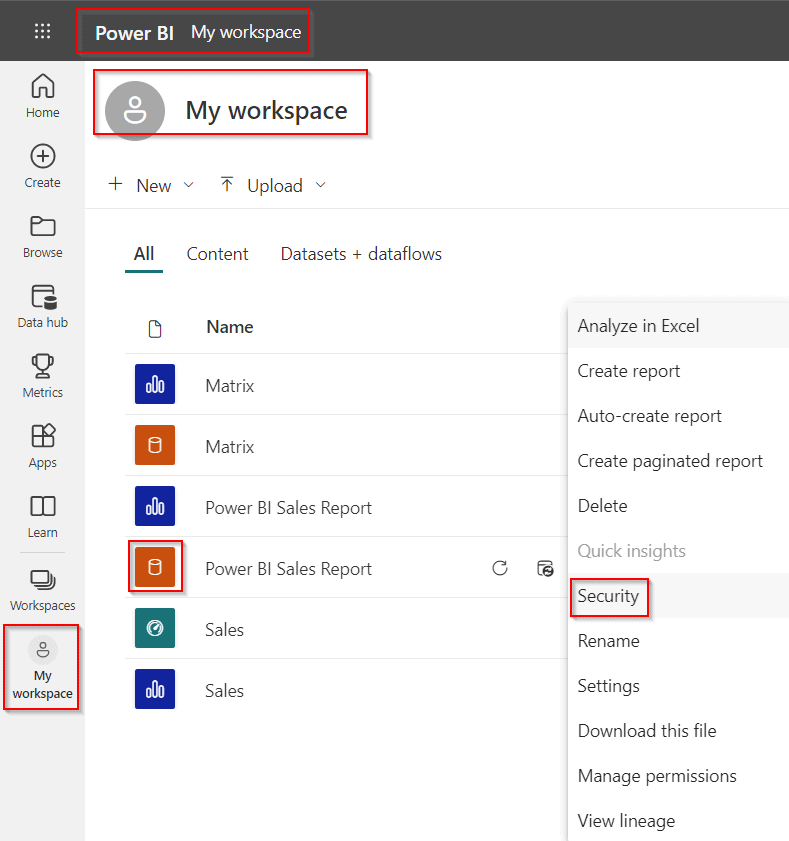
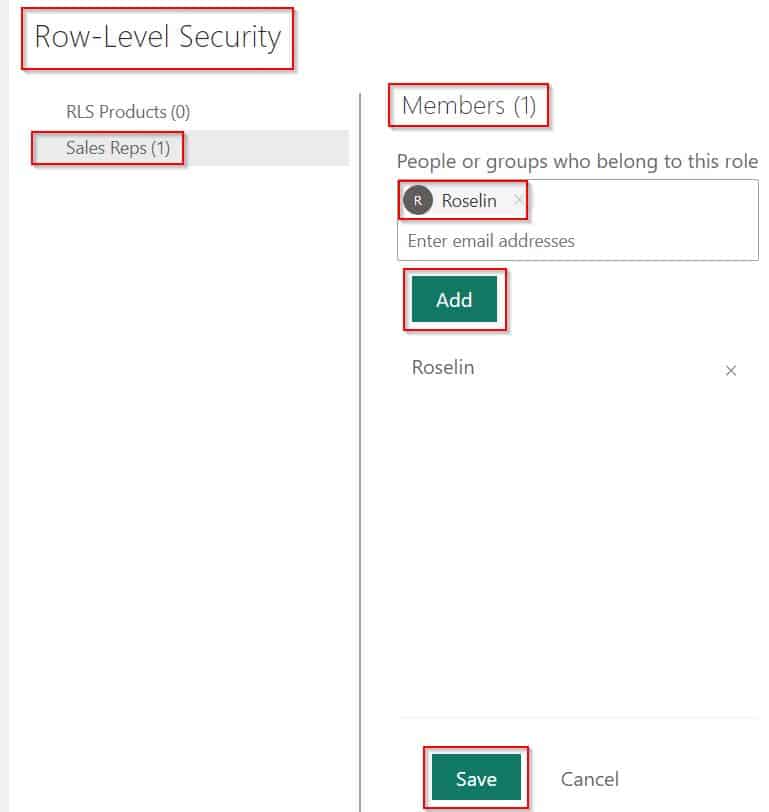
- Under add members, select the role created and add the users. Click on Add. Then Select the save option to save the members as below:
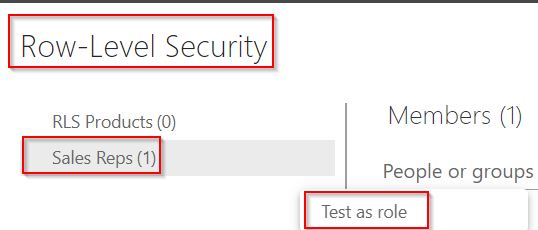
- Then Select the ellipsis icon for the created role and click on the Test as a role.
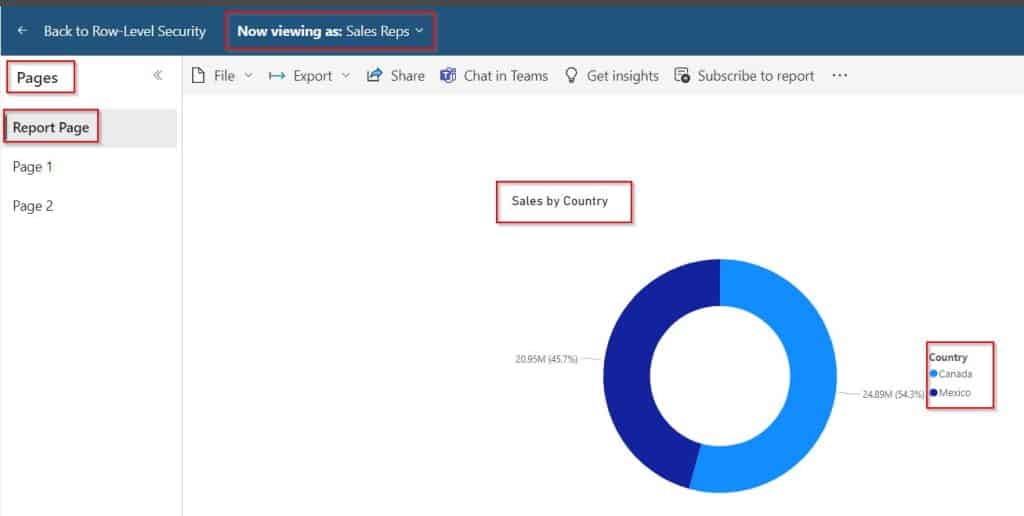
- Now in the below screenshot, you can see the Power BI report display the donut chart visual based on the selected role that matches the login username in the power bi service.
- The Power Bi report displays the donut chart with the two Countries called Canada and Mexico and the remaining countries are restricted by the row level of security in the Power Bi.
This is how USERPRINCIPALNAME() returns the logged-in tenant user name in the Power Bi Service.
This is how to create and dynamically implement row-level security and define roles in the Power Bi desktop and Power Bi service.
In this Power BI Tutorial, we have learned What is Power BI Row-level Security (RLS) and what are the different types of Row-level security available in Power BI.
In addition, we also learned how to implement Static Row-level security and Dynamic Row level security in Power BI with various examples. Moreover, we also covered the below headings:
- Power BI Row-level Security Static Example
- Power BI Row-level Security multiple values
- Power BI Row-level Security based on username
- Power BI Row-level Security based on email
- Power BI Row-level Security Dynamic Example
- Power BI Row-level Security not working
You may also like:
- Power BI Percentage of Total by Month
- Power BI Percentage of Total by Category
- How to Concatenate Text and Number in Power BI
I am Bijay a Microsoft MVP (10 times – My MVP Profile) in SharePoint and have more than 17 years of expertise in SharePoint Online Office 365, SharePoint subscription edition, and SharePoint 2019/2016/2013. Currently working in my own venture TSInfo Technologies a SharePoint development, consulting, and training company. I also run the popular SharePoint website EnjoySharePoint.com