Last week, I worked on a Power BI customer support report that required showing the number of support tickets created in the last 30 days. Also, it filters the data to show the tickets created in the previous seven days. All these things are possible by using the Power BI DAX statement.
In this Power BI article, I will show you how to filter last N days data using Power BI DAX, such as filtering the last 30 days’ data and the last 7 days’ data using various methods.
Filter Last 30 Days Data Using Power BI DAX [Using Date Field]
While working on a Power BI support ticket activity report, I was required to show the number of support tickets created in the last 30 days. The data includes a ‘CreatedDate’ column, which records each ticket’s creation date.
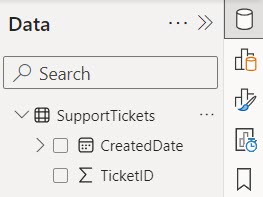
For this example, I created a table called SupportTickets, which includes the TicketID and CreatedDate columns.

Let’s follow the below steps:
Open Power BI Desktop and load the above table into Power. Then, you can see data in the data pane.
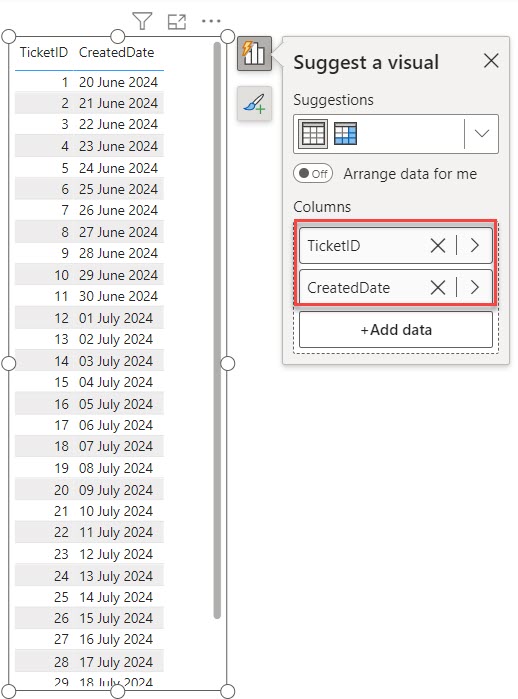
Now, create a Power BI table visual to show all columns in the SupportTickets data set.
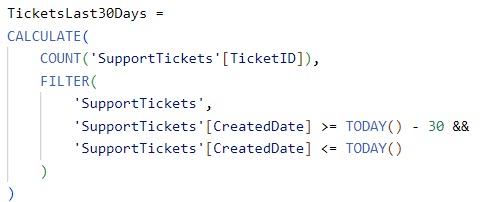
Here, we want to see the last 30 days, so we need to create a measure using the DAX expression below.
TicketsLast30Days =
CALCULATE(
    COUNT('SupportTickets'[TicketID]),
    FILTER(
        'SupportTickets',
        'SupportTickets'[CreatedDate] >= TODAY() - 30 &&
        'SupportTickets'[CreatedDate] <= TODAY()
    )
)
Where:
- TicketsLast30Days: This is the name of the measure we are creating.
- CALCULATE: This function changes the context in which data is evaluated. It’s used to perform calculations with specific filters.
- COUNT(‘SupportTickets'[TicketID]): This counts the number of rows in the ‘SupportTickets’ table where there is a value in the [TicketID] column.
- FILTER: This function creates a subset of data based on a condition. In this case, it’s filtering the ‘SupportTickets’ table to include only tickets created within the last 30 days.
- ‘SupportTickets'[CreatedDate] >= TODAY() – 30 && ‘SupportTickets'[CreatedDate] <= TODAY(): This is the condition used in the FILTER function. It selects tickets where the [CreatedDate] is between today and 30 days ago.
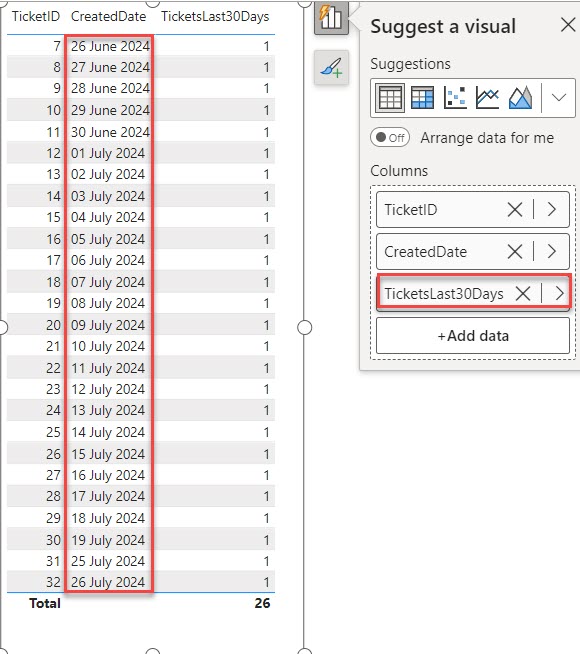
Add the TicketsLast30Days measure to the table visual you created above. The Power BI table visual will then show only the last 30-day dates.
You can use the Power BI card visual to see the total count of tickets that were created in the last 30 days.
Filter Latest Date Using Power BI DAX [Using Date Column]
Suppose you are analyzing sales data for a retail company. You have a large dataset in Power BI with a column named SaleDate that records the dates of all sales transactions. Your task is determining the latest sale date from this dataset to identify the most recent sales activity.
For this example, I have a data table called SalesDate, which includes the Order Date, Sales Amount, Product Category, and Product Name columns.
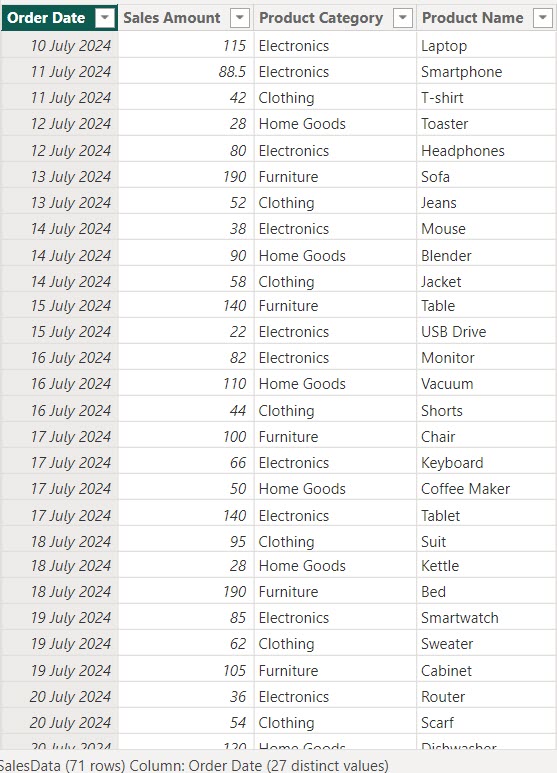
Now follow the below steps:
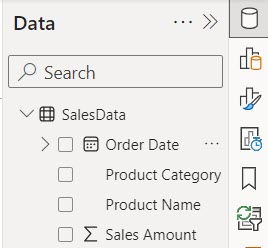
Open Power BI Desktop and load the above table into Power. Then, you can see data in the data pane.
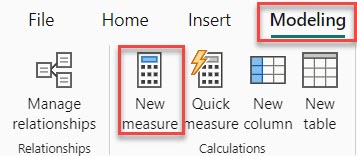
Now click the New measure under the Modeling tab to create a DAX measure to find the most recent sale date in the SaleDate column.
Then, in the formula bar, put the below DAX expression.
LatestOrderDate = MAX(SalesData[Order Date])Where:
- LatestOrderDate: This is the name of the measure we are creating.
- MAX(SalesData[Order Date]): This function finds the maximum (latest) date in the [Order Date] column of the ‘SalesData’ table.

Then, add a Power BI Card visual to see the LatestOrderDate from the SalesTable.
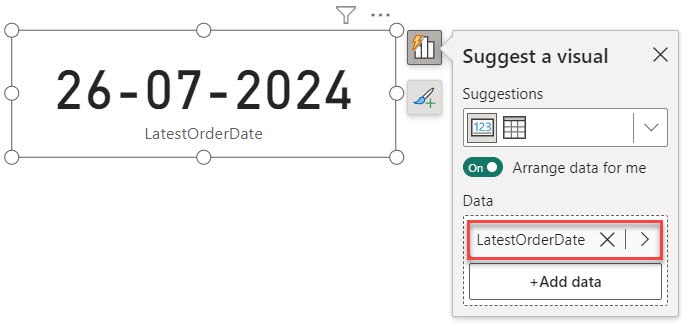
In the above, SalesTable 26-07-2024 is the LatestOrderDate.
Filter Last 7 Days Data Using Power BI DAX
I will tell you how we calculated the last seven days’ sales in a data table using Power BI DAX.
I used the same SalesTable above but added another column showing the last order date. You can create the same column in the above example but only create a new column instead of Creating a measure.
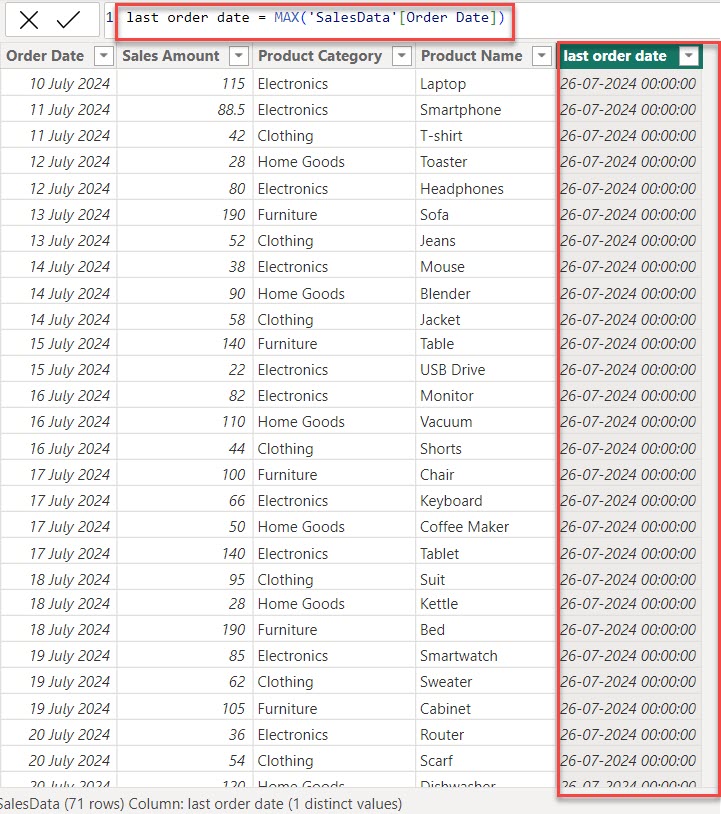
Now follow the below steps:
Go to the Table view, then under the Table tools, click New column.
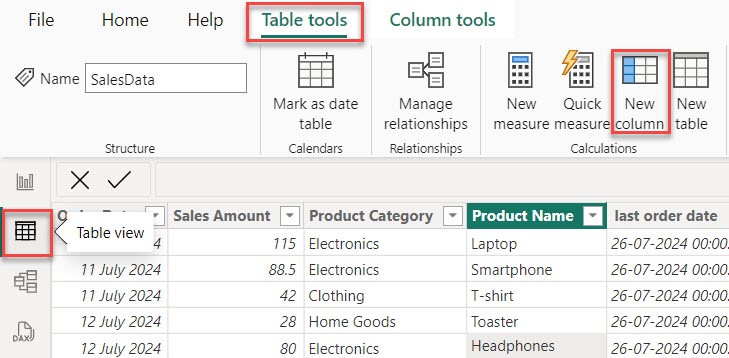
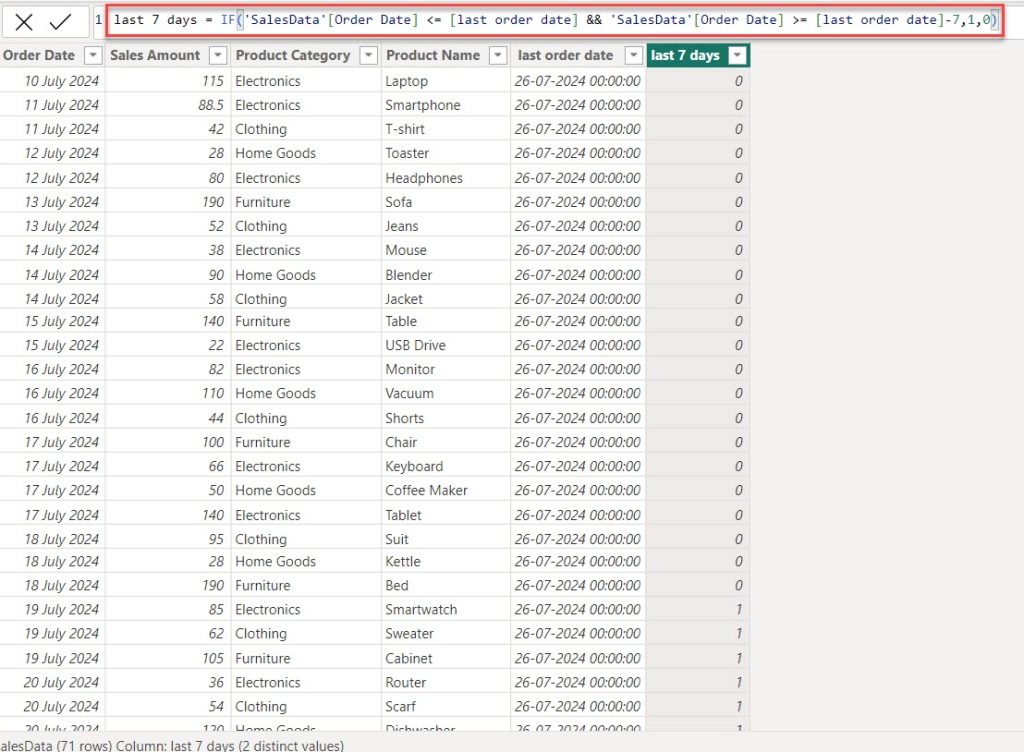
In the formula bar, put the DAX expression below.
last 7 days = IF('SalesData'[Order Date] <= [last order date] && 'SalesData'[Order Date] >= [last order date]-7,1,0)Where:
- last 7 days: This is the measure we are creating.
- IF: This function checks a condition and returns one value if the condition is true and another value if it is false.
- ‘SalesData'[Order Date] <= [last order date] && ‘SalesData'[Order Date] >= [last order date] – 7: This condition checks if the order date is within the last 7 days from the [last order date]. It includes dates that are up to 7 days before the [last order date] and up to the [last order date].
- 1,0: If the condition is true (the order date is within the last 7 days), it returns 1. If the condition is false, it returns 0.
Then go to the Report view, create a Power BI table visual, and add Order Date, Sales Amount, Product Category, and Product Name columns.
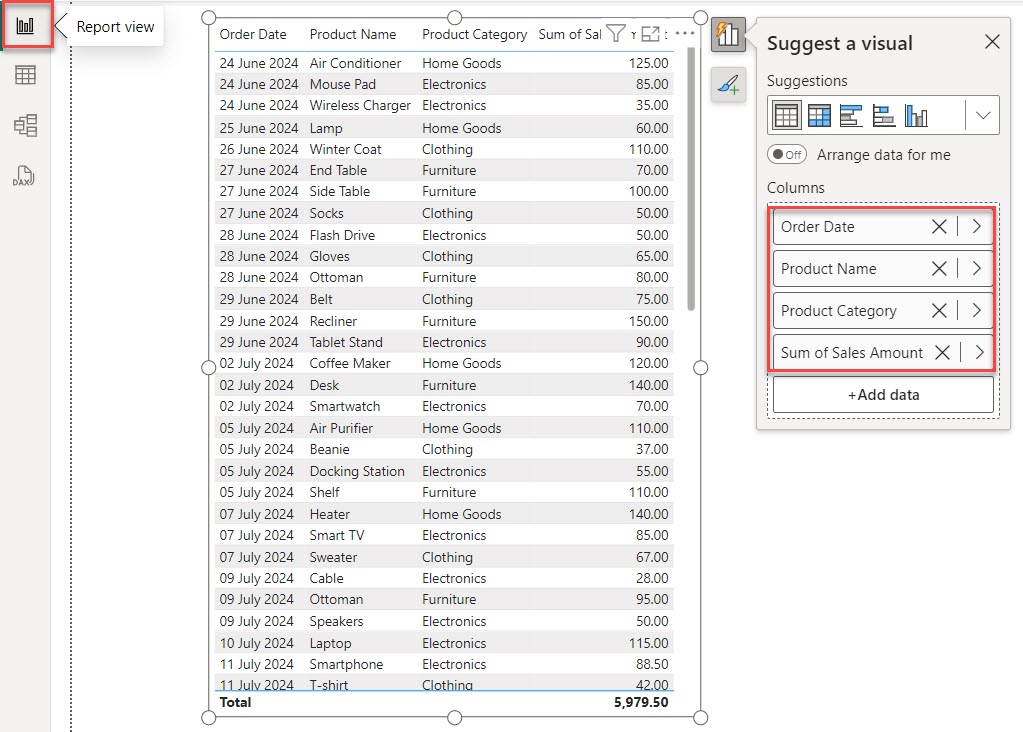
Then, add a Power BI slicer visual and add the “last 7 days” measure to it.
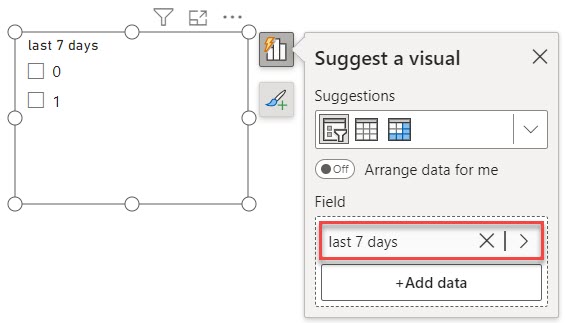
When you select 1 from the slicer, you can see the table visual displaying the last 7 days’ orders.
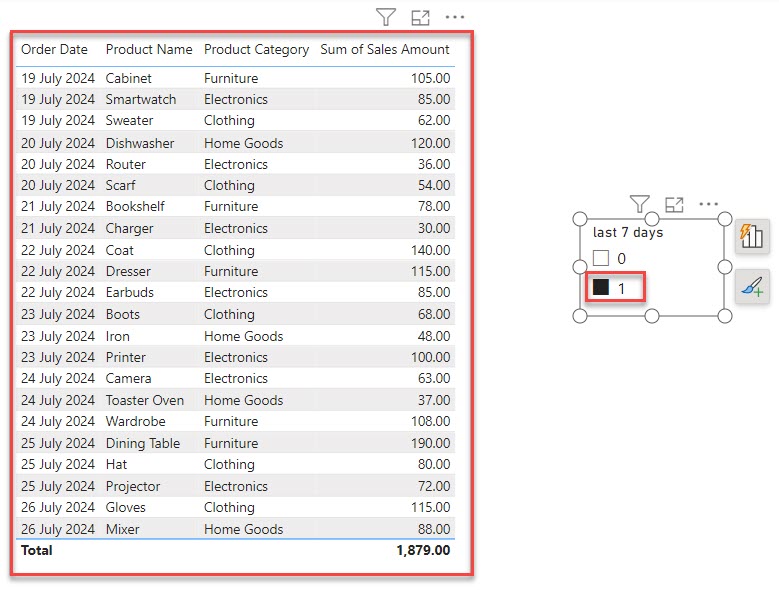
You can filter the last seven days’ sales in a data table using Power BI DAX.
I hope you follow all the steps to filter n days using Power BI DAX.
Some more Power BI articles you may also like:
- Filter Current Year Data Using Power BI DAX
- How to Filter Date Using Power BI DAX
- Filter Distinct Dates Using Power BI DAX
I am Bijay a Microsoft MVP (10 times – My MVP Profile) in SharePoint and have more than 17 years of expertise in SharePoint Online Office 365, SharePoint subscription edition, and SharePoint 2019/2016/2013. Currently working in my own venture TSInfo Technologies a SharePoint development, consulting, and training company. I also run the popular SharePoint website EnjoySharePoint.com